Micro-/mesoporous carbons for controlled release of antipyrine and indomethacin
Dipendu Saha*a,
Tara Mokena,
Jihua Chenb,
Dale K. Hensleyb,
Kristen Delaneyc,
Marcus A. Huntc,
Karl Nelsona,
Amada Spurria,
Lauren Benhama,
Robin Bricec and
Martina Azoroc
aDepartment of Chemical Engineering, Widener University, PA 19013, USA. E-mail: dsaha@mail.widener.edu; Fax: +1 610 499 4059; Tel: +1 610 499 4056
bCenter for Nanophase Materials Sciences, Oak Ridge National Laboratory, Oak Ridge, TN 37831, USA
cDepartment of Biological Sciences, Fayetteville State University, 1200 Murchison Road Fayetteville, NC 28301, USA
First published on 24th February 2015
Abstract
We have demonstrated the potential of meso- and microporous carbons in controlled release applications and targeted oral drug delivery. We have employed two mesoporous and two microporous carbons for the sustained release of one water-soluble drug (antipyrine) and one water-insoluble drug (indomethacin), using these as models to examine the controlled release characteristics. The micro-/mesoporous carbons were characterized as having a BET surface area of 372–2251 m2 g−1 and pore volume 0.63–1.03 cm3 g−1. The toxicity studies with E. coli bacterial cells did not reveal significant toxicity, which is in accordance with our previous studies on human cells with similar materials. Mucin adsorption tests with type III pork mucin demonstrated 20–30% mucin adsorption by the carbon samples and higher mucin adsorption could be attributed to higher surface area and more oxygen functionalities. Antipyrine and indomethacin loading was 6–78% in these micro-/mesoporous carbons. The signatures in thermogravimetric studies revealed the presence of drug molecules within the porous moieties of the carbon. The partial shifting of the decomposition peak of the drug adsorbed within the carbon pores was caused by the confinement of drug molecules within the narrow pore space of the carbon. The release profiles of both drugs were examined in simulated gastric fluid (pH = 1.2) and in three other release media with respective pH values of 4.5, 6.8 and 7.4, along with varying residence times to simulate the physiological conditions of the stomach, duodenum, small intestine and colon, respectively. All the release profiles manifested diffusion controlled sustained release that corroborates the effective role of micro-/mesoporous carbons as potential drug carriers.
1. Introduction
Controlled and sustained release of bioactive agents, including drugs, enzymes and related materials, is one of the major challenges of human health care and the medical sciences. Active and direct drug administration may provide a very high (toxic) or very low (ineffective) drug concentration in a physiological system.1 Repeated dose of the active drug may result in a saw-tooth type concentration profile that is also not effective.1 Nanoporous materials have been widely employed in the controlled release of several drugs and related materials. The drug delivery from nanoporous materials is controlled by the adsorption and desorption mechanism within the nanosized pores of the material. During ‘loading’ or adsorption of the drug, it is stored within the nanopores in molecular form, whereas its release within the physiological media is controlled by the diffusion and thermodynamics of the system.2 For water-soluble drugs, the diffusion barrier helps to maintain the sustained release. In the case of water-insoluble drugs, the molecular storing mechanism helps to overcome the high crystallization energy and enhance their release rates. The other benefits associated with a nanoporous media-driven drug delivery system include its ability to float in the gastrointestinal (GI) system owing to its lower bulk density2,3 and the protection of the biological payload from different types of physiological degradation agents, like enzymes or the immune system.2The largest number of reports incorporating porous materials as drug delivery agents covers different kinds of mesoporous silica, used for a multitude of drugs.4–9 However, owing to the associated drawbacks of silica-based systems, recently nanoporous or mesoporous carbons have been reported to successfully act as passive drug delivery vehicles. Aimed towards oral drug delivery, ibuprofen,10,11 indomethacin11 and lovastatin12 were successfully delivered from mesoporous carbons. A few anticancer drugs, like doxorubicin,13 campthothecin14 and mitoxantrone,15 were also successfully delivered from nanoporous carbons, targeted towards blood plasma or transmembrane delivery. Our past research demonstrated that soft-templated mesoporous carbons can successfully maintain controlled release of four different drugs, captopril,16,17 furosemide,17 ranitidine hydrochloride18 and antipyrine,18 aimed towards oral drug delivery. As the biocompatibility of a drug carrier is a fundamental prerequisite for its application, recently we have demonstrated that mesoporous carbons are biocompatible and this biocompatibility is confirmed with the help of cytotoxicity studies with HeLa cells, study of the cell viability of fibroblast cells and determination of hemocompatibility by hemolysis and blood protein adsorption studies.19
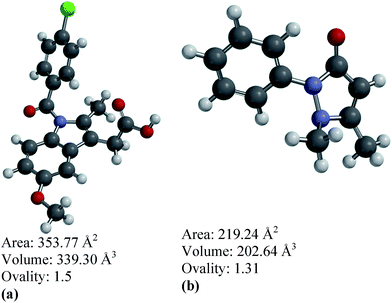
As a continued effort towards successfully establishing nanoporous carbons as passive and controlled drug delivery media, we have employed two different drugs based on aqueous solubility, indomethacin (water-insoluble) and antipyrine (water-soluble). Fig. 1(a) and (b) show the molecular configuration and geometric properties of these two drugs, as calculated using Spartan software. In order to investigate the drug loading and release profiles, we have selected four different nanoporous carbons, two microporous and two other mesoporous carbons with varying specific surface areas and pore widths. In order to target oral delivery, we have sequentially exposed the drug-loaded nanoporous carbons to pH 1.2, 4.5, 6.8 and 7.4 at pre-determined time intervals to mimic the physiological conditions of the stomach, duodenum, small intestine and colon, respectively.20
2. Experimental
2.1 Synthesis of micro-/mesoporous carbons
In order to synthesize the mesoporous carbons, we have used a strategy previously employed for phloroglucinol-F127 derived carbons.17,18 Typically, 5.0 g phloroglucinol and 4.0 g Pluronic F127 were dissolved in a mixture of 17 mL water and 24 mL ethanol with 0.5 mL 36% HCl as a catalyst and stirred for 30 minutes. After that, 4.8 mL 37% formaldehyde was added as a cross-linking agent and stirring was continued for 1 hour. The reaction mixture became turbid and the polymer layer was separated from the solvents by simple sedimentation and aged for a few days at room temperature. It was then put in a porcelain boat and carbonized in a tube furnace under N2 atmosphere with the following temperature profile: room temperature to 400 °C at 1° min−1, 400 °C to 1000 °C at 2 °C min−1, then maintaining the final temperature for 5 minutes followed by cooling down to room temperature under the N2 flow. This material is named as meso-C1. To activate this mesoporous carbon, it is ground and mixed with solid KOH in a 1![[thin space (1/6-em)]](https://www.rsc.org/images/entities/char_2009.gif) :
:![[thin space (1/6-em)]](https://www.rsc.org/images/entities/char_2009.gif) 3 ratio and heated under N2 up to 1000 °C at a ramp rate of 10 °C min−1, followed by cooling down to ambient temperature under N2 flow. The activated mesoporous carbon is termed as meso-C2. In order to synthesize microporous carbons, we employed polymerized furfuryl alcohol as a carbon precursor. Typically, 20 mL furfuryl alcohol was ice-cooled and 10 mL 0.19 g p-toluidine sulfonic acid in 10 mL tetrahydrofuran was added onto it dropwise over a time of 30 minutes as a polymerization inducing agent. The stirring was continued overnight to enhance the degree of polymerization till it became a dark green to black colored viscous material. It was carbonized in the tube furnace under the same N2 flow, heated up to 1000 °C at 10 °C min−1, and cooled under the same N2 atmosphere. It was then mixed with solid KOH in a 1
3 ratio and heated under N2 up to 1000 °C at a ramp rate of 10 °C min−1, followed by cooling down to ambient temperature under N2 flow. The activated mesoporous carbon is termed as meso-C2. In order to synthesize microporous carbons, we employed polymerized furfuryl alcohol as a carbon precursor. Typically, 20 mL furfuryl alcohol was ice-cooled and 10 mL 0.19 g p-toluidine sulfonic acid in 10 mL tetrahydrofuran was added onto it dropwise over a time of 30 minutes as a polymerization inducing agent. The stirring was continued overnight to enhance the degree of polymerization till it became a dark green to black colored viscous material. It was carbonized in the tube furnace under the same N2 flow, heated up to 1000 °C at 10 °C min−1, and cooled under the same N2 atmosphere. It was then mixed with solid KOH in a 1![[thin space (1/6-em)]](https://www.rsc.org/images/entities/char_2009.gif) :
:![[thin space (1/6-em)]](https://www.rsc.org/images/entities/char_2009.gif) 3 ratio and heated in the same fashion to that of meso-C2. The resultant carbon is termed as micro-C1. In order to obtain another high surface area carbon, we obtained a commercial chemically activated porous carbon from ACS Material®. It was washed with DI water several times and termed as micro-C2.
3 ratio and heated in the same fashion to that of meso-C2. The resultant carbon is termed as micro-C1. In order to obtain another high surface area carbon, we obtained a commercial chemically activated porous carbon from ACS Material®. It was washed with DI water several times and termed as micro-C2.
2.2 Characterization of micro-/mesoporous carbons
The porosity of the nanoporous materials were obtained using N2 adsorption–desorption at 77 K and CO2 adsorption–desorption at 273 K in a Quantachrome Autosorb iQ porosity and surface area analyzer. Porosity data, including Brunauer–Emmett–Teller (BET) specific surface area and pore size distribution by non-local density functional theory (NLDFT), were calculated within the software of the instrument. The transmission electron microscopy (TEM) images were captured with a Carl Zeiss Libra 120 TEM microscope operating at 120 kV. The samples were dispersed in ethanol by ultrasonicating at a 0.5 wt% concentration and drop-cast on the amorphous carbon-coated TEM grid (Ted Pella). The scanning electron microscopy (SEM) images were obtained using a Carl Zeiss Merlin SEM operating at 30 kV. No additional sample preparation was employed for SEM; the as-received samples were directly put on the SEM stand.2.3 Cytotoxicity and mucoadhesive properties
For this particular study, cytotoxicity studies were performed on E. coli cells using a standard protocol. Typically, the porous carbon samples were ground in a mortar and pestle and 10 mg of carbon powder was added to 0.5 mL ethanol (95%) and sonicated for 10 minutes. The dispersion was added to the E. coli suspension with carbon concentrations of 50, 300 and 500 μg mL−1 along with a control sample without any carbon material. All the carbon-seeded and control bacterial samples were incubated for 24 hours and then bacterial concentrations were monitored using a standard dilution and plating method, and were measured in triplicate. In order to facilitate imaging, trypan blue stain was added to the cells and the images were captured using an Olympus bx-40 microscope with 1000× magnification in transmitted light mode.Surface adsorption of mucin is an indirect measure of the mucoadhesive properties of a drug carrier medium.21,22 In a typical experiment, 20 mg of pure carbon sample was stirred in a 20 cm3 500 ppm mucin (Sigma-Aldrich, extracted from pork stomach, type III) solution in DI water for 12 hours at 37 °C. After that, the carbon particles were separated by filtration and the concentration of the mucin in the residual solution was measured to calculate the mucin adsorption by the carbon. All the mucin concentrations were measured by standard Bradford protein assay at 595 nm wavelength in a Thermo-Scientific GENESYS 10S UV-Vis spectrophotometer. The mucin adsorption amount was calculated as:
| Adsorption% = [(Initial mucin − Final mucin)/Initial mucin] × 100. |
2.4 Drug loading and delivery
For indomethacin, nanoporous carbons (except for micro-C2) and pure drug were stirred in a 6.5![[thin space (1/6-em)]](https://www.rsc.org/images/entities/char_2009.gif) :
:![[thin space (1/6-em)]](https://www.rsc.org/images/entities/char_2009.gif) 1 ratio in 120 mL ethanol overnight and the carbon was separated from the solvent by simple filtration. Because of the high surface area and high loading of micro-C2, the ratio was set to 1
1 ratio in 120 mL ethanol overnight and the carbon was separated from the solvent by simple filtration. Because of the high surface area and high loading of micro-C2, the ratio was set to 1![[thin space (1/6-em)]](https://www.rsc.org/images/entities/char_2009.gif) :
:![[thin space (1/6-em)]](https://www.rsc.org/images/entities/char_2009.gif) 1. Antipyrine was loaded by stirring carbon and pure drug in a 3
1. Antipyrine was loaded by stirring carbon and pure drug in a 3![[thin space (1/6-em)]](https://www.rsc.org/images/entities/char_2009.gif) :
:![[thin space (1/6-em)]](https://www.rsc.org/images/entities/char_2009.gif) 1 ratio in DI water overnight and the carbon separated in the similar fashion. In order to measure the drug loading amount, 2 μL of elutant drug solution is mixed with either 20 mL ethanol (for indomethacin) or DI water (for antipyrine) and measured with a Thermoscientific GENESYS 10S UV-Vis spectrophotometer against a pre-calibrated chart. The separated carbon materials are quickly washed with their respective solvents to remove accumulated drug from the surface.
1 ratio in DI water overnight and the carbon separated in the similar fashion. In order to measure the drug loading amount, 2 μL of elutant drug solution is mixed with either 20 mL ethanol (for indomethacin) or DI water (for antipyrine) and measured with a Thermoscientific GENESYS 10S UV-Vis spectrophotometer against a pre-calibrated chart. The separated carbon materials are quickly washed with their respective solvents to remove accumulated drug from the surface.
In order to visualize the presence of adsorbed drug molecules within the porous carbon moieties, thermograms of drug decomposition at high temperature were measured in the TA Instruments SDT Q600 under N2 flow. The thermograms of the derivative wt% of drug loaded carbons were compared with the pure drugs.
The conditions for the release experiments were pH = 1.2, 4.5, 6.8 and 7.4 for 3, 1, 3 and 5 h, respectively, representing the physiological conditions of the stomach, duodenum, small intestine and colon.20 For all release experiments, the temperature of the release medium was set to 37 °C to simulate body temperature. The medium with pH 1.2 (simulated gastric fluid, SGF) was formulated by mixing DI water with 1% NaCl and adjusting the pH with HCl (without pepsin). The pH of the rest of the media was adjusted using HCl only without any enzyme. To perform the release experiments, drug loaded carbons were brought into contact with the respective physiological media at a 0.2 g dose per 50 mL media (for indomethacin) or 0.1 g dose per 50 mL media (for antipyrine). The stirring speed for the pH = 1.2 medium was 150 rpm, whereas it was set at 50 rpm for rest of the media.20 For all the samples, 3 cm3 of sample was taken out and immediately replenished with similar medium. For micro-C2, an additional filtration was employed to separate the fine carbon particles before analysis. For indomethacin release experiments only, 3 cm3 of release medium was mixed with 1 cm3 of ethanol (200 proof) before measuring the concentration in the UV-Vis spectrophotometer. All the concentrations in the UV-vis measurements were calculated based on a pre-calibrated chart, prepared for each kind of release medium. Owing to the high concentration of released antipyrine in the micro-C2/antipyrine release experiments, 100 μL of release medium was mixed with 2 cm3 of pure release medium (to dilute) before measuring it in the UV-vis spectrophotometer.
3. Results and discussion
3.1 Materials characteristics
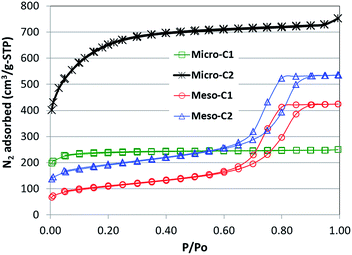
The pore textural properties, including BET specific surface area, are calculated by analysing the N2 adsorption–desorption isotherms at 77 K. The N2 adsorption plots are provided in Fig. 2. The large hysteresis loops for meso-C1 and meso-C2 confirmed the existence of mesoporosity in those carbons. The isotherms for the microporous carbons did not show any hysteresis loop. The BET specific surface areas and total pore volumes of all the carbons are shown in Table 1. It is clear that micro-C2 has the largest BET surface area (2251 m2 g−1) and total pore volume (1.03 cm3 g−1). The lowest BET surface area and pore volume is exhibited by meso-C1 (372 m2 g−1 and 0.63 cm3 g−1). Despite the high BET surface area and pore volume, the microporous carbons did not show significant mesopore distribution.| Carbon | BET specific surface area (m2 g−1) | Total pore volume (cm3 g−1) |
|---|---|---|
| Meso-C1 | 372 | 0.63 |
| Meso-C2 | 641 | 0.78 |
| Micro-C1 | 761 | 0.35 |
| Micro-C2 | 2251 | 1.03 |
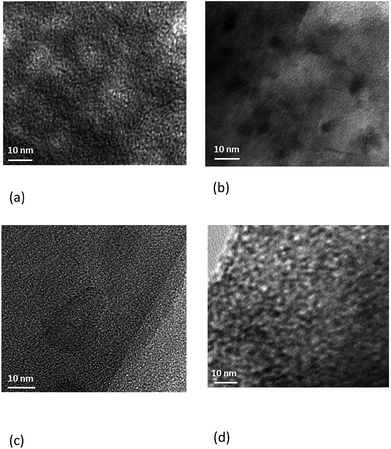
The scanning and transmission electron microscopy images (SEM and TEM) are provided in Fig. 3 and 4. The sizes of the mesoporous carbon particles are larger and in the order of 1400–1500 μm. The size of the micro-C1 particles is smaller, about 500 μm, whereas the smallest particles belong to micro-C2, which are in the range of 5–12 μm. The pores, which are in the order of nanometers, are clearly observed for meso-C1, meso-C2 and micro-C1 (Fig. 3(c), (f) and (i)). A network of larger pores, in the order of 4–5 μm, is observed for meso-C2 (Fig. 3(e)), which are definitely formed in the course of chemical activation. An array of pores of width less than 1 μm is also observed on the external surface of micro-C1, which can be attributed to the chemical activation. We could not locate nanosized pores for micro-C2 by SEM analysis. The TEM images of all the nanoporous carbons reveal that they possess partial graphitic ribbons and that the pores are highly disorganized in nature. For micro-C2, ‘worm’ shaped pores are clearly visible in the TEM image (Fig. 4(d)).
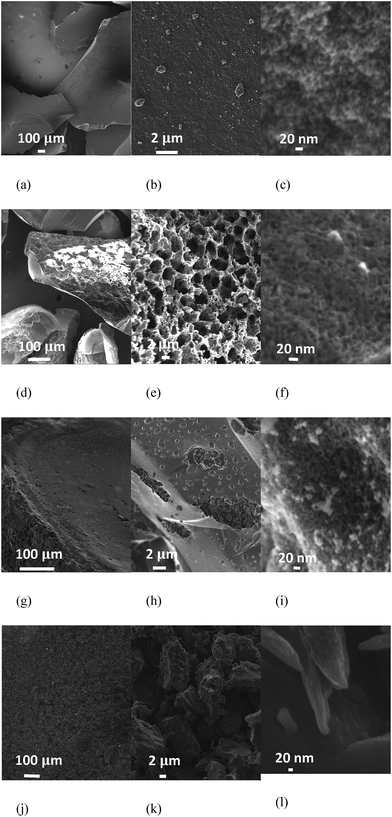 | ||
| Fig. 3 SEM images of the micro-/mesoporous carbons: meso-C1 (a–c), meso-C2 (d–f), micro-C1 (g–i), micro-C2 (j–l). | ||
3.2 Toxicity studies
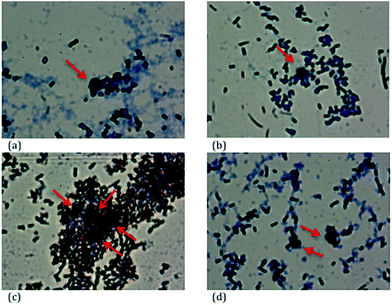
The cytotoxicity results of three different carbon concentrations of 50, 300 and 500 μg mL−1 on E. coli cells are shown in Fig. 5 and representative light microscope images with each type of nanoporous carbon sample are shown in Fig. 6(a)–(d). Although we could not locate any trend in bacterial survival rate with the properties of the nanoporous carbons, the results do not correspond to toxic behavior of the carbons. Meso-C1 and meso-C2 demonstrated slightly lower surviving rates compared to the control or blank sample at the lower concentrations of 50 and 300 μg mL−1 and micro-C2 demonstrated a similar trend for 300 μg mL−1, but the other concentrations do not corroborate such trends. At the higher concentration, micro-C1 and micro-C2 samples displayed even higher survival rates compared to the blank sample. The higher survival rate compared to the blank sample could be attributed to the fact that the bacterial cells preferred the nanoporous carbons as a better substrate media to grow and multiply compared to the Petri-dish; the microscope images also confirmed that the bacterial cells could accumulate around the carbon particles. Positive growth of E. coli bacterial cells compared to control is also observed in the literature,23 which reported the survival of a bacterial colony in contact with TiO2 nanoparticles and two polymeric materials, tri-n-octylphosphine oxide (TOPO) and Brij-76. This was attributed to the possible fact that those materials could promote cellular growth, or the bacterial cells might have metabolized them as oligoelements. Such occurrences, if true, may also contribute to the results of our investigations. Although the exact nature of the interaction between carbon particles and cells requires a much more detailed and controlled study, it can be concluded that the nanoporous carbon samples did not possess significant toxicity to the cells.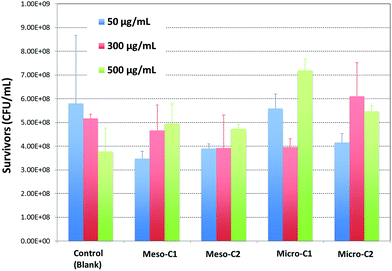 | ||
| Fig. 5 Results of E. coli survival in contact with micro-/mesoporous carbons, with three different carbon concentrations of 50, 300 and 500 μg mL−1. | ||
3.3 Mucin adsorption results
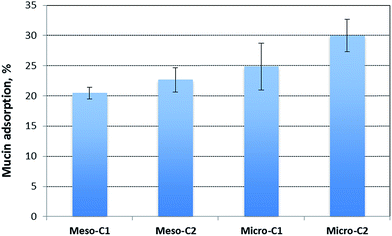
Mucin adsorption results for the four types of carbons are in the range of 20–30% and are shown in Fig. 7. The pattern clearly suggests that mucin adsorption increases with the increase in BET surface area (refer to Table 1). The other reason for higher mucin adsorption in the high surface area carbons may be attributed to the surface affinity. All of the three carbons, meso-C2, micro-C1 and micro-C2, were chemically activated with KOH to enhance the surface area. KOH activation essentially introduces some oxygen functionalities on the carbon pores. Such oxygen containing functional groups may form hydrogen bonds with the nitrogen atoms of mucin, thereby facilitating the overall adsorption. The fair amount of mucin adsorption suggests that the carbon particles might have a good possibility of adhering to the mucus surface of the GI tract and increasing their residence time.3.4 Drug loading and release characteristics
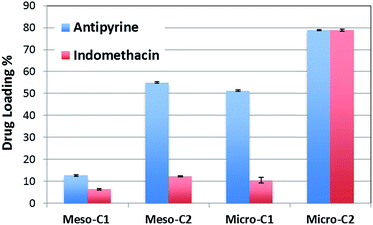
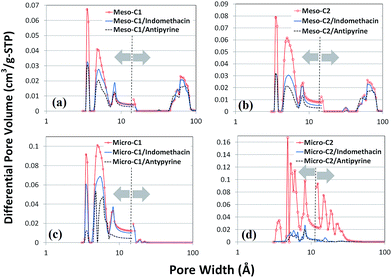
Fig. 8 represents the loading or adsorption amounts of indomethacin and antipyrine in the different nanoporous carbons. The general trend is that the loading amount increases with the increase in surface area. The highest loading of both indomethacin and antipyrine is displayed by micro-C2 (around 78.8 ± 0.1%), which has the largest BET SSA, whereas the smallest uptake is manifested by meso-C1 (6.33 ± 0.3% for indomethacin; 12.6 ± 0.35% for antipyrine), which has the lowest surface area. A minor deviation in this trend occurred for indomethacin and antipyrine adsorption in micro-C1. Although micro-C1 has a slightly higher BET SSA than (761 m2 g−1 versus 641 m2 g−1) it adsorbed a slightly smaller amount of both drugs compared to meso-C2. Most likely, the higher pore volume of meso-C2 helped to accommodate a greater number of molecules of the drug, or the presence of mesopores in meso-C2 facilitated the transport of the drugs to the micropores. The amount of indomethacin (or antipyrine) uptake by micro-C2 is the largest uptake reported so far for any porous material. In a previous study by Karavasili et al.11 for a hard-templated mesoporous carbon, CMK-3, the loading amount of indomethacin was around 15%, which is similar to that of the meso-C2 sample in this study (12.23 ± 0.17%).In order to visualize the location of the drug loading sites, we have analyzed the differential pore size distribution plots of the pure and drug-loaded carbons (Fig. 9(a)–(d)). Although the outgassing conditions of the drug-loaded carbons (70–80 °C, 24 hours) were not as stringent as the pure carbons (300 °C, 3 hours) and the drug-loaded carbons might also contain few water or ethanol molecules trapped in the narrower pores, such analysis will provide a qualitative view of the pore occupancy by the drug molecules. Despite the size of indomethacin being much larger than antipyrine (as shown in Fig. 1(a) and (b)), indomethacin did not occupy any of the mesopores in meso-C1 and meso-C2, unlike antipyrine, which occupied both types of pores. Such anomalous behavior may be attributed to the localized interactions of indomethacin with the carbon pore walls, the influence of functional groups on the pore and the possible orientation and bending of the molecule in the narrower pore space. For micro-C1 and micro-C2, we found that all the pores are partially filled with drug molecules. The largest pore filling shown by micro-C2 for both indomethacin and antipyrine is clearly correlated with its highest loading capacity (∼78%). Unlike the rest of the carbon samples, micro-C2 possessed continuous pore widths from 4 to 40 Å. We believe that such a hierarchical pore distribution strongly influences well-facilitated transport of the drug molecules and ultimately helps them be adsorbed into the pores.
The comparison of the thermograms of the drug-loaded carbons with those of the pure drugs (Fig. 10(a) and (b)) clearly showed the presence of drugs within the porous carbon moieties. The decomposition peak of the pure antipyrine appears around 303 °C, but the peak temperature is shifted around 30 °C towards higher temperature for all antipyrine-loaded carbons, which may be attributed to the confinement effect in the nanosized pores. For pure indomethacin, the largest peak appears at 328 °C, with a very small peak at around 370 °C. In indomethacin-loaded carbons, both the peaks became prominent and the shift of peak temperature was much larger compared to antipyrine.
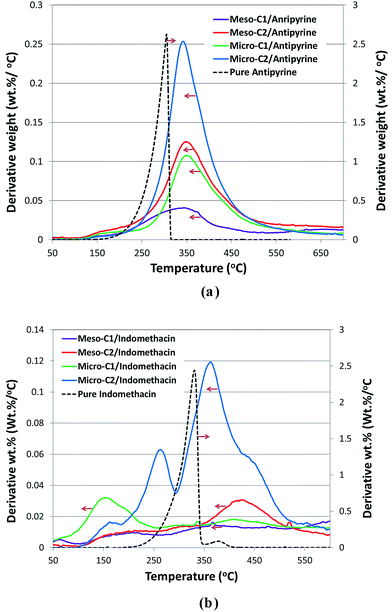 | ||
| Fig. 10 Thermograms of pure drug and drug-loaded carbons for antipyrine (a) and indomethacin (b). The arrows the show the direction of the corresponding Y-axis, derivative wt% (wt%/°C). | ||
Intuitively, the confinement effect, as a function of carbon pore size and geometry of drug molecule in accordance with the surface functionality of the carbon pores, plays the key role in the decomposition temperature profile. Further insights into the precise role of carbon pores in confining a particular drug molecule requires a much more elaborate study that is beyond the scope of this work.
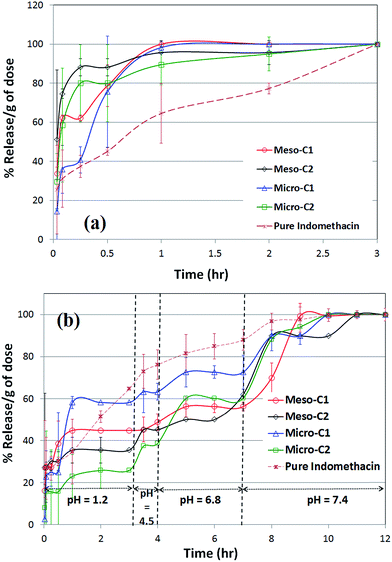
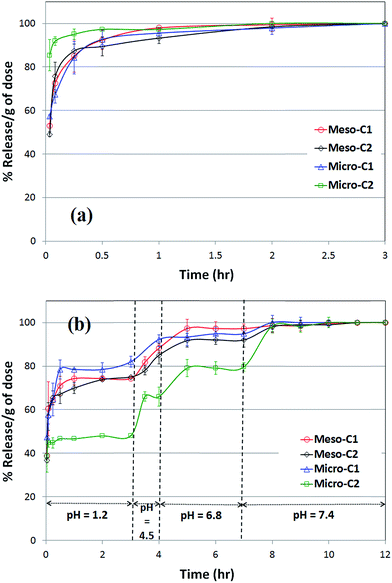
The release profile of indomethacin in SGF (pH = 1.2) and at 37 °C is shown in Fig. 11(a). The release rate of the drugs from all the nanoporous carbons is faster than the pure indomethacin formulation, clearly showing the beneficial role of the nanoporous carbons. Such a faster release of indomethacin is similar to that of submicron-sized mesoporous carbon particles synthesized using a hard-templating method.24 Although in our experiment we found that the release rate reached the saturation level in the time interval of 1 to 3 hours, a distinctive saturation time of indomethacin release has been reported for different types of formulation. The saturation time was as low as 10 minutes for two types of hard-templated mesoporous carbon.11,24 The time to reach the saturation level was over 8 hours for a chitosan-coated hydrogen formulation25 and 15–20 hours for cross-linked chondroitin in rat cecal material26 or amino functionalized and carbopol-coated MCM-41 in SGF.27
In order to simulate the release profile of indomethacin-loaded nanoporous carbons in the rest of GI tract, we have extended the release experiments to pH values of 4.5, 6.8 and 7.4 at 37 °C and over the course of 12 hour in total, along with a comparison with pure indomethacin (Fig. 11(b)). Such a complete comparison the drug release profile in varying pH to simulate all the conditions of the gastro-intestinal (GI) tract is very rare in the literature20 and, most likely, does not exist for indomethacin and antipyrine. We found that all the nanoporous carbons that apparently reached the saturation level continued to release indomethacin for 10–11 hours up to pH = 7.4. Most likely, the drug molecules that were adsorbed far inside the pores or in narrower pores and with the highest adsorptive force are released in the late period. We found that release from pure indomethacin also leveled off within the 10–12 hour period. Indomethacin release from amino functionalized and carbopol coated MCM-41 was 5–8 hours27 at pH 6.8. The same release rate was 3–10 hours at pH 6.5, 6.8 and 7.2 for a methacrylate loaded formulation28 or 10–15 hours for thermo-responsive polyvinyl alcohol or polyacrylic acid29 at pH 7. In a few instances, the release rate was extremely slow and in the order of days. The release of indomethacin was 20–30 hours from diatom silica30 at pH 7.4 and over 10 days from nanocomposites of silica gel.31 It also took over 15–20 days to reach the saturation level for PEG-coated zirconia particles in simulated body fluid (SBF).32 The high release time for porous media may be attributed to the accumulation of the drug in crystalline form on the outside of particles or in macropores, which take a longer time to gradually dissolve or leach out in the release media. For the polymeric formulations, the cause may be far more complicated; it can be related to polymer–drug interactions or entrapment of the drug by polymer layers. It can be clearly stated that, for oral delivery of a poorly soluble drug like indomethacin, the release rate should be designed to be fast as possible in order to benefit from the high rate of dissolution and absorption in the GI tract.
The release experiments of antipyrine in simulated gastric fluid (SGF) at 37 °C (Fig. 12(a)) reveals that all the nanoporous carbons release almost 90% of the saturation level within an hour and gradually reach the saturation level in a greater than two hour period.
Amongst all the carbons, micro-C2 showed the fastest release; over 80% of saturation level was reached in the first burst of release. Most likely, the drug molecules that were present in the outer periphery of the pores were released during this time. Such a release profile is very similar to that of release from phloroglucinol-derived mesoporous carbons at 35.5 °C, but is considerably faster than that from lignin-derived mesoporous carbons.18
The complete release profile of antipyrine in all four pH values at 37 °C is shown in Fig. 12(b). Unlike the release pattern in SGF, the micro-C2 sample maintained the sustained release for the longest interval of time, up to 8–9 hours. There is no significant difference in the release patterns amongst the rest of the carbon samples, which reached 90–95% of the saturation level in a five hour period. The reason for the best-sustained release pattern of micro-C2 can most likely be attributed to the largest drug uptake and variable pore width, as observed in Fig. 9(d). Most likely, it started to dissolve from the largest pores and eventually reached the narrower pores at the end of the release pattern. Additionally, the narrower pores exerted the strongest adsorptive force on the drug molecules, resulting in its release being mostly delayed. Such a release profile shows more delay than that from porous silica in pH 7.4, as reported by Salonen et al.33 The release time of antipyrine was as high as 6 hours from organogels in simulated intestinal fluid.34 It is also reported that the release of antipyrine was delayed as much as 6 to 11 hours in different release media by employing the swollen gels of hydroxypropyl methyl cellulose (HPMC)35 or other microcrystalline cellulose compositions.36 Such evidence suggests that combining nanoporous carbons with polymeric materials may improve their performance for the sustained release of hydrophilic drugs.
4. Conclusions
In this phase of research, we have employed four types of micro- and mesoporous carbon for controlled release purposes of two model drugs, indomethacin (water-insoluble) and antipyrine (water-soluble). The micro-/mesoporous carbons were characterized to have a BET surface area and pore volume that are in the range of 372–2251 m2 g−1 and 0.63–1.03 cm3 g−1, respectively. Neither of the carbon samples demonstrated significant toxicity in the bacterial culture studies. The drug loading amounts were 6–78%, where the highest amount of drug loading was manifested by micro-C1, which possesses the highest BET surface area and pore volume. The drug release experiments were performed in SGF and in three other different media with varying pH and residence times to mimic the physiological conditions of the actual gastrointestinal (GI) tract. All the carbons demonstrated a sustained release profile that confirmed that these materials can be employed as potential drug carriers.Acknowledgements
TEM (J.C.) and SEM (D.K.H.) experiments were conducted at the Center for Nanophase Materials Sciences, Oak Ridge National Laboratory, which is a DOE Office of Science User Facility. D.S. acknowledges the faculty development award and provost grant from the School of Engineering of Widener University.References
- U. Edlund and A. C. Albertson, Adv. Polym. Sci., 2002, 157, 67 CrossRef CAS.
- M. Arruebo, Wiley Interdiscip. Rev.: Nanomed. Nanobiotechnol., 2012, 4, 16 CrossRef CAS PubMed.
- B. N. Singh and K. H. Kim, J. Controlled Release, 2000, 63, 235 CrossRef CAS PubMed.
- M. Vallet-Regi, F. Ballas and D. Arcos, Angew. Chem., Int. Ed., 2007, 46, 7548 CrossRef CAS PubMed.
- P. Yang, S. Gai and J. Lin, Chem. Soc. Rev., 2012, 41, 3679 RSC.
- W. Xu, J. Riikonen and V.-P. Lehto, Int. J. Pharm., 2013, 453, 181 CrossRef CAS PubMed.
- I. I. Slowing, J. L. Vivero-Escoto, C.-W. Wu and V. S.-Y. Lin, Adv. Drug Delivery Rev., 2008, 60, 1278 CrossRef CAS PubMed.
- C. Barbe, J. Bartlett, L. Kong, K. Finnie, H. Q. Lin, M. Larkin, S. Calleja, A. Bush and G. Calleja, Adv. Mater., 2004, 16, 1959 CrossRef CAS.
- I. I. Slowing, B. G. Trewyn, S. Giri and V. S.-Y. Lin, Adv. Funct. Mater., 2007, 17, 1225 CrossRef CAS.
- X. Wang, P. Liu, Y. Tian and L. Zang, Microporous Mesoporous Mater., 2011, 145, 98 CrossRef CAS.
- C. Karavasili, E. P. Amanatiadou, L. Sygellou, D. K. Giasafaki, T. A. Steriotis, G. C. Charalambopoulou, I. S. Vizirianakis and D. G. Fatouros, J. Mater. Chem. B, 2013, 1, 3167 RSC.
- P. Zhao, L. Wang, C. Sun, T. Jiang, J. Zhang, Q. Zhang, J. Sun, Y. Deng and S. Wang, Eur. J. Pharm. Biopharm., 2012, 80, 535 CrossRef CAS PubMed.
- J. Zhu, L. Liao, X. Bian, J. Kong, P. Yang and B. Liu, Small, 2012, 8, 2715 CrossRef CAS PubMed.
- J. Gu, S. Su, Y. Li, Q. He and J. Shi, Chem. Commun., 2011, 47, 2101 RSC.
- A. Labiano, M. Dai, D. Taylor, W.-S. Young, T. H. Epps III, K. Rege and B. D. Vogt, Microporous Mesoporous Mater., 2012, 160, 143, DOI:10.1016/j.micromeso.2012.05.003.
- D. Saha, E. A. Payzant, A. S. Kumbhar and A. K. Naskar, ACS Appl. Mater. Interfaces, 2013, 5, 5868 CAS.
- D. Saha, K. E. Warren and A. K. Naskar, Carbon, 2014, 71, 47, DOI:10.1016/j.carbon.2014.01.005.
- D. Saha, K. E. Warren and A. K. Naskar, Microporous Mesoporous Mater., 2014, 196, 327, DOI:10.1016/j.micromeso.2014.05.024.
- M. F. Gencoglu, A. Spurri, M. Franko, J. Chen, D. K. Hensley, C. L. Heldt and D. Saha, ACS Appl. Mater. Interfaces, 2014, 6, 15068 CAS.
- L. Sun, Y. Wang, T. Jiang, X. Zheng, J. Zhang, J. Sun, C. Sun and S. Wang, ACS Appl. Mater. Interfaces, 2013, 5, 103 CAS.
- J. Filipovic-Grcic, N. Skalko-Basnet and I. Jalsenjak, J. Microencapsulation, 2001, 18, 3 CrossRef CAS PubMed.
- H. K. Han, H.-J. Shin and D. H. Ha, Eur. J. Pharm. Sci., 2012, 46, 500 CrossRef CAS PubMed.
- R. Brayner, R. Ferrari-iliou, N. Brivois, S. Djediat, M. F. Benedetti and F. Fievet, Nano Lett., 2006, 6, 866 CrossRef CAS PubMed.
- S. C. Shen, W. K. Ng, L. Z. O. Chia, Y.-C. Dong and R. B. H. Tan, Powder Technol., 2014, 261, 241 CrossRef CAS.
- O. Munjeri, J. H. Collett and J. T. Fell, J. Controlled Release, 1997, 46, 273 CrossRef CAS.
- A. Rubinstein, D. Nakar and A. Sinto, Pharm. Res., 1992, 9, 276 CrossRef CAS.
- B. Tzankov, K. Yoncheva, M. Popova, A. Szegedi, G. Momekov, J. Mihály and N. Lambov, Microporous Mesoporous Mater., 2013, 171, 131, DOI:10.1016/j.micromeso.2012.12.037.
- A. Akhgari, H. A. Garekani, F. Sadeghi and M. Azimaie, Int. J. Pharm., 2005, 305, 22 CrossRef CAS PubMed.
- H. S. Shin, S. Y. Kim and Y. M. Lee, J. Appl. Polym. Sci., 1997, 65, 685 CrossRef CAS.
- M. Barianba, M. S. Aw and D. Losic, Adv. Powder Technol., 2013, 24, 757 CrossRef.
- J. H. Chang, C. H. Shim, B. J. Kim, Y. Shin, G. J. Exerhos and K. J. Kim, Adv. Mater., 2005, 17, 634 CrossRef CAS.
- M. Catauro, F. Bollino, F. Papale, S. Pacifico, S. Galasso, C. Ferrara and P. Mustarelli, Drug Delivery, 2013, 21, 595 CrossRef PubMed.
- J. Salonen, L. Laitinen, A. M. Kaukonen, J. Tuura, M. Bjorkqvist, T. Heikkila, K. Vaha- Heikkila, J. Hirvonen and V.-P. Lehto, J. Controlled Release, 2005, 108, 362 CrossRef CAS PubMed.
- K. Iwanaga, M. Kawai, M. Miyazaki and M. Kakemi, Int. J. Pharm., 2012, 436, 869 CrossRef CAS PubMed.
- C. Dahlberg, A. Fureby, M. Schuleit, S. V. Dvinskikh and I. Furó, J. Controlled Release, 2007, 122, 199 CrossRef CAS PubMed.
- M. E. Sangalli, A. Maroni, L. Zema, F. Giordano and A. Gazzabiga, J. Controlled Release, 2001, 73, 103 CrossRef CAS PubMed.
| This journal is © The Royal Society of Chemistry 2015 |

