Mixed-solvothermal synthesis, structures, surface photovoltage, luminescence and molecular recognition properties of three new transition metal phosphonates with 3D framework and supramolecular structures

Tong Sun, Cheng-Qi Jiao, Wen-Zhu Li, Zhen-Gang Sun*, Chao Ma, Yan-Yu Zhu, Ming-Xue Ma, Hui Luo, Xiao-Wen Zhang and Mei-Ling Wang
School of Chemistry and Chemical Engineering, Liaoning Normal University, Dalian 116029, P. R. China. E-mail: szg188@163.com

Received 6th January 2015 , Accepted 3rd March 2015

First published on 4th March 2015


Abstract

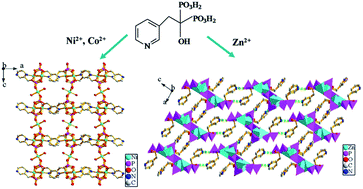
Three new transition metal(II) phosphonates with 3D framework and supramolecular structures, namely, [M1.5(L)(H2O)]·NH2(CH3)2·H2O (M = Ni (1), Co (2)) and [Zn2(H2L)(HL)]·NH2(CH3)2·3H2O (3) (H4L = C5H4NCH2C(OH)(PO3H2)2), have been synthesized under mixed-solvothermal conditions and structurally characterized. Compounds 1 and 2 are isostructural and adopt a 3D framework structure. The {M(1)O5N} octahedra and {CPO3} tetrahedra are interconnected into a 1D chain via corner-sharing, which is further linked to adjacent chains through pyridyl rings to form a 2D layer structure. Neighboring layers are bridged through {M(2)O6}, leading to a 3D framework structure with a 1D channel system along the b-axis. For compound 3, the {Zn(1)O4} and {Zn(2)O4} polyhedra are interconnected by phosphonate groups into a 1D double chain, and the double chain is further connected to adjacent chains through hydrogen bonds to form a 2D supramolecular network. Then these neighboring layers are further connected through hydrogen bonding interactions to give rise to a 3D supramolecular structure. Surface photovoltage spectroscopy (SPS) and field-induced surface photovoltage spectroscopy (FISPS) of compounds 1 and 2 indicate that they possess a positive SPV response in the range of 300–800 nm and show p-type semiconductor characteristics. Compound 3 has been realized for the sensitive sensing of N,N-dimethylformamide (DMF) by a luminescent method.

Introduction

The design and construction of novel functional hybrid materials based on metal phosphonates has attracted considerable attention in recent years due to the possibility to form interesting structures with potential applications in the areas of catalysis, ion exchange, proton conductivity, intercalation chemistry, photochemistry and materials chemistry, and so on.1 Therefore, the rational design and synthesis of novel metal phosphonates with an intriguing diversity of architectures and properties has become a particularly important subject. The key factor is the selection of multifunctional phosphonic acid ligands for assembling metal ions to fabricate a desired framework. Much work on metal phosphonates has shown that the use of bi- and multifunctional phosphonic acids containing –NH2, –OH, and –COOH sub functional groups may not only result in novel structural types of metal phosphonates but also bring interesting properties.2

By using phosphonic acids with amine, hydroxyl, pyridyl and carboxylate groups as ligands, a series of metal phosphonates with different architectures have also been isolated in our laboratory.3

In view of photoelectric property, phosphonic acids containing a pyridyl group may be a good ligand due to its rigidity and large π-conjugated system. With the aim of exploring novel metal phosphonates with interesting structures and properties, we focus our attention on a multifunctional phosphonic acid ligand with pyridyl group, C5H4NCH2C(OH)(PO3H2)2 (H4L, Scheme 1), since it features a close connection of two phosphonate moieties, one hydroxyl and one pyridyl via one methylene group and shows diversified coordination capabilities with metal ions. In this paper, by employing C5H4NCH2C(OH)(PO3H2)2 (H4L) as the phosphonate ligand, three new transition metal(II) phosphonates with 3D framework and supramolecular structures, [M1.5(L)(H2O)]·NH2(CH3)2·H2O (M = Ni (1), Co (2)) and [Zn2(H2L)(HL)]·NH2(CH3)2·3H2O (3), have been synthesized by the mixed-solvothermal reaction of divalent transition metals and C5H4NCH2C(OH)(PO3H2)2 (H4L) in N,N-dimethylformamide (DMF) and water. The results showed that dimethylamine (dma), a decomposition product of DMF, acts as structure-directing agents and charge-compensating cation. Herein we report their syntheses, crystal structures, surface photovoltage, luminescence and molecular recognition properties. To our knowledge, research on the properties of metal phosphonates is mainly focused on the magnetism, luminescence, proton conductivity and ion exchange etc., there are seldom reports about surface photovoltage and molecular recognition properties of these materials. Surface photovoltage spectroscopy (SPS) is a useful tool for surveying the charge change of the solid surface, and it can be used to investigate the photophysics of the excited states and the surface charge behavior of the sample.4 Recently, only a few investigations on the surface photovoltage property of metal phosphonates have been reported by our group.5 Molecular recognition, an important process in biological and chemical systems, has been used to investigate straightforward and highly sensitive sensing of small molecules.6 In recent years, sensing of ions and small molecules utilizing some luminescent MOF materials has been realized.7 Despite great efforts have been made for the sensing applications of the luminescent MOF materials, to the best of our knowledge, no metal phosphonates hybrids have been investigated so far for their molecular recognition properties. Very recently, only a few metal phosphonate hybrids with molecular recognition property have also been obtained by our group.8 Research on the surface photovoltage and molecular recognition properties of other metal phosphonates is currently underway.


image file: c5ra00197h-s1.tif
Scheme 1 Structure of 1-hydroxy-2-(3-pyridyl)ethylidene-1,1-diphosphonic acid (H4L).

Experimental

Materials and measurements

The 1-hydroxy-2-(3-pyridyl)ethylidene-1,1-diphosphonic acid, C5H4NCH2C(OH)(PO3H2)2 (H4L) were purchased from Xinxiang Tianfeng Fine Chemicals Co., Ltd. All other chemicals were obtained from commercial sources and used without further purification. C, H, and N content were determined by using a PE-2400 elemental analyzer. Ni, Co, Zn and P content were determined by using an inductively coupled plasma (ICP) atomic absorption spectrometer. IR spectra were recorded on a Bruker AXS TENSOR-27 FT-IR spectrometer with KBr pellets in the range 4000–400 cm−1. The X-ray powder diffraction data was collected on a Bruker AXS D8 Advance diffractometer using Cu-Kα radiation (λ = 1.5418 Å) in the 2θ range of 5–60° with a step size of 0.02° and a scanning rate of 3° min−1. Thermogravimetric (TG) analyses were performed on a Perkin-Elmer Pyris Diamond TG-DTA thermal analyses system in static air with a heating rate of 10 K min−1 from 50 °C to 1000 °C. The luminescence spectra were investigated on a HITACHI F-7000 spectrofluorimeter (solid). Surface photovoltage spectroscopy (SPS) and field-induced surface photovoltage spectroscopy (FISPS) measurements were conducted with the sample in a sandwich cell (ITO/sample/ITO) with the light source-monochromator-lock-in detection technique in the range of 300–800 nm. The suspensions of compound 3 were prepared by introducing 5 mg of compound 3 into 5.00 mL of acetone, 2,4-pentanedione, DMF, DMA, formaldehyde, ethyl acetate, benzyl alcohol, propylene oxide and THF at room temperature. The luminescence properties of the suspensions were measured after aging 72 hours.
Synthesis of [Ni1.5(L)(H2O)]·NH2(CH3)2·H2O (1). A mixture of Ni(Ac)2·4H2O (0.12 g, 0.50 mmol), H4L (0.15 g, 0.50 mmol), N,N-dimethylformamide (DMF) (4 mL) and H2O (4 mL) was stirred for dissolution about 1 h at room temperature, and then heated at 140 °C for 72 h in a 20 mL Teflon-lined stainless steel autoclave under autogenous pressure. After the mixture was cooled slowly to room temperature, the green plate crystals were obtained. Yield 33.8% (based on Ni). Anal. calc. for C9H19N2O9P2Ni1.5: C, 24.06; H, 4.26; N, 6.23; P, 13.79; Ni, 19.60. Found: C, 24.02; H, 4.23 N, 6.28; P, 13.75; Ni, 19.65%. IR (KBr, cm−1): 3450(m), 3099(m), 2680(w), 1636(m), 1470(m), 1434(m), 1378(w), 1249(w), 1090(s), 951(s), 842(m), 701(m), 631(m), 569(s), 460(m).
Synthesis of [Co1.5(L)(H2O)]·NH2(CH3)2·H2O (2). The procedure was the same as that for 1 except that Ni(Ac)2·4H2O was replaced by Co(Ac)2·4H2O (0.10 g, 0.40 mmol). The pink microcrystal was obtained. Yield 36.8% (based on Co). Anal. calc. for C9H19N2O9P2Co1.5: C, 24.04; H, 4.26; N, 6.23; P, 13.78; Co, 19.65. Found: C, 24.08; H, 4.23; N, 6.26; P, 13.73; Co, 19.69%. IR (KBr, cm−1): 3450(m), 3099(m), 2680(w), 1633(m), 1472(m), 1434(m), 1369(w), 1249(w), 1083(s), 948(s), 845(m), 703(m), 632(m), 568(s), 466(m).
Synthesis of [Zn2(H2L)(HL)]·NH2(CH3)2·3H2O (3). A mixture of Zn(Ac)2·2H2O (0.16 g, 0.75 mmol), H4L (0.15 g, 0.50 mmol), N,N-dimethylformamide (DMF) (4 mL) and H2O (4 mL) was stirred for dissolution about 1 h at room temperature, and then heated at 120 °C for 72 h in a 20 mL Teflon-lined stainless steel autoclave under autogenous pressure. After the mixture was cooled slowly to room temperature, the colorless block crystals were obtained. Yield 45.6% (based on Zn). Anal. calc. for C16H29N3O17P4Zn2: C, 24.32; H, 3.70; N, 5.32; P, 15.68; Zn, 16.56. Found: C, 24.35; H, 3.68; N, 5.35; P, 15.63; Zn, 16.61%. IR (KBr, cm−1): 3426(s), 3091(m), 2974(w), 2918(m), 2857(w), 1626(m), 1566(m), 1472(w), 1387(m), 1075(s), 984(s), 818(m), 686(m), 631(m), 567(m).

Crystallographic studies

Data collections for compounds 1 and 3 were performed on the Bruker AXS Smart APEX II CCD X-ray diffractometer equipped with graphite monochromated Mo-Kα radiation (λ = 0.71073 Å) at 293 ± 2 K. An empirical absorption correction was applied using the SADABS program. All structures were solved by direct methods and refined by full-matrix least squares fitting on F2 by SHELXS-97.9 All non-hydrogen atoms were refined with anisotropic thermal parameters. Hydrogen atoms except those for water molecules were generated geometrically with fixed isotropic thermal parameters, and included in the structure factor calculations. Hydrogen atoms for water molecules were not included in the refinement. Details of crystallographic data and structural refinements of compounds 1 and 3 are summarized in Table 1. Hydrogen bonds of compound 3 are given in Table 2. Selected bond lengths and angles of compounds 1 and 3 are listed in Tables S1 and S2 (ESI).
Table 1 Crystal data and structure refinement for compounds 1 and 3
a R1 = Σ(|F0| − |FC|)/Σ|F0|.b wR2 = [Σw(|F0| − |FC|)2/ΣwF02]1/2.
Compounds 1 3
Formular C9H19N2O9P2Ni1.5 C16H29N3O17P4Zn2
Fw 449.27 790.04
Crystal system Orthorhombic Monoclinic
Space group Pbca P2(1)/c
a (Å) 18.7958(9) 9.9975(8)
b (Å) 8.2622(4) 9.1275(7)
c (Å) 18.8550(8) 30.548(3)
α (°) 90 90
β (°) 90 97.544(2)
γ (°) 90 90
V3) 2928.1(2) 2763.5(4)
Z 8 4
Dc (g cm−3) 2.038 1.899
μ (mm−1) 2.219 2.052
F(000) 1848 1608
Theta range (°) 2.16 to 26.50 2.05 to 26.49
Reflns measd 46[thin space (1/6-em)]677 14[thin space (1/6-em)]958
Unique reflns, Rint 3021, 0.0827 5634, 0.0588
Goodness-of-fit 1.079 1.024
R1, wR2a,b [I > 2σ(I)] 0.0670, 0.1568 0.0778, 0.1848
R1, wR2a,b (all data) 0.0931, 0.1860 0.1152, 0.2067


Table 2 Hydrogen bond for compound 3a
D–H⋯A D(D–H)/Å d(H⋯A)/Å D–H–A/° d(D⋯A)/Å
a Symmetry transformations used to generate equivalent atoms: #5 −x + 3, y − 1/2, −z + 1/2; #6 −x + 1, −y, −z.
N(1)–H(1A)⋯O(5)#5 0.90 1.78 160.2 2.641(5)
N(2)–H(2C)⋯O(11)#6 0.90 1.77 168.0 2.654(3)


Results and discussion

Syntheses

Under mixed-solvothermal conditions, three new transition metal phosphonates have been successfully prepared. A systematic approach has been attempted to produce single phase materials, the optimal conditions of synthesizing were explored. It was found that the molar ratio of M2+/H4L has a strong effect on the formation of these compounds. The pure phases of compound 1 can be obtained with good yields when the molar ratio of M2+ and H4L is 1[thin space (1/6-em)]:[thin space (1/6-em)]1. Compound 3 was obtained in the regions with the molar ratio M2+ and H4L is 3[thin space (1/6-em)]:[thin space (1/6-em)]2. We try to prepare compound 2 following the same molar ratio to that of compounds 1 and 3. Finally, the microcrystal of compound 2 was obtained with good yields when the molar ratio of M2+ and H4L is 4[thin space (1/6-em)]:[thin space (1/6-em)]5. In addition, the reaction temperature plays an important role in the formation of the title compounds. Single phase of compound 1 was obtained at the reaction temperature of 140 °C, while compound 3 was obtained at 120 °C. Unfortunately, the microcrystal of compound 2 was not suitable for single crystal structure analysis. Despite our efforts to grow single-crystals of compound 2 with other molar ratios and different synthetic conditions, we were not successful in obtaining good samples for X-ray diffraction studies. However, X-ray powder diffraction analysis indicates that compounds 1 and 2 are isostructural, clearly indicating that pure phase of compound 2 is obtained. The powder X-ray diffraction patterns and the simulated X-ray diffraction of compounds 1–3 are shown in the ESI (Fig. S1 and S2). The diffraction peaks on the patterns correspond well in position, confirming that the title compounds are in pure phase. The differences in reflection intensity are probably due to the preferred orientation in the powder samples. Our results show that N,N-dimethylformamide (DMF) plays a dual role in the formation of the title compounds. Under the mixed-solvothermal conditions, N,N-dimethylformamide (DMF) not only serves as a solvent but also can be decomposed to produce dimethylamine, which acts as structure-directing agents and charge-compensating cations. We did not successfully obtain good samples for X-ray diffraction studies without the presence of DMF molecule.

Description of the crystal structures

Since compounds 1 and 2 are isostructural, hence only the structure of compound 1 will be discussed in detail as a representation. X-ray single crystal diffraction revealed that compound 1 crystallizes in the orthorhombic space group Pbca (see Table 1).

The asymmetric unit of compound 1 consists of two crystallographically unique Ni(II) ions (occupancy: Ni(1) 100%, Ni(2) 50%), one deprotonated L4− anion, one coordinated water molecule, one Hdma+ (dma = dimethylamine) cation and one solvate water molecule. As shown in Fig. 1, Ni(1) ion is six-coordinated. Four of the six coordination positions are filled with four phosphonate oxygen atoms (O3, O5, O1A and O4B) from three separate L4− anions [Ni(1)–O3 = 2.147(5), Ni(1)–O5 = 2.057(5), Ni(1)–O1A = 2.051(5), Ni(1)–O4B = 2.056(5) Å], one hydroxyl oxygen atom [Ni(1)–O7 = 2.164(2) Å], and one nitrogen atom [Ni(1)–N1C = 2.098(2) Å]. Ni(2) ion is also six-coordinated by four phosphonate oxygen atoms (O2, O2D, O6 and O6D) from two phosphonate ligands [Ni(2)–O2 = 2.007(5), Ni(2)–O6 = 2.061(5) Å], and two oxygen atoms (O8 and O8D) from two coordinated water molecules [Ni(2)–O8 = 2.153(2) Å] (Table S1, ESI). These values are comparable to those reported for other Ni(II) phosphonates.10 In compound 1, the phosphonate oxygen atoms and the hydroxyl oxygen atom are all coordinated. The L4− anion serves as an octadentate metal linker, bridging with five Ni(II) ions (Fig. 2a). Based on the charge balance, the nitrogen atom of dimethylamine cation is 1H-protonated.


image file: c5ra00197h-f1.tif
Fig. 1 Structure unit of compound 1 showing the atom labeling. Thermal ellipsoids are shown at the 50% probability level. All H atoms are omitted for clarity. Symmetry code for the generated atoms: (A) −x + 2, y + 1/2, −z + 1/2; (B) −x + 2, y − 1/2, −z + 1/2; (C) x + 1/2, y, −z + 1/2; (D) −x + 2, −y, −z + 1.

image file: c5ra00197h-f2.tif
Fig. 2 (a) The coordination fashions of L4− in compound 1; (b) the coordination fashions of HL3− in compound 3; (c) the coordination fashions of H2L2− in compound 3.

The overall structure of compound 1 can be described as a 3D framework type. Within the structure of compound 1, two Ni(1) ions are interconnected by a pair of L4− ligands through phosphonate oxygen atoms (O3, O5, O1A and O4B) to generate a 1D chain down the b-axis, and pyridyl rings are hung in this chain (Fig. 3a). The above chains are bridged by pyridyl rings to form a 2D layer structure in ab-plane (Fig. 3b). As shown in Fig. 4a, neighboring layers are bridged by {Ni(2)O6}, leading to a 3D framework structure with one type of channel system running along b-axis (Fig. 4b). The channel is formed by 29-membered rings, and dimension of the channel is estimated to be 10.3 Å (Ni1–Ni2) × 7.5 Å (C5–C7) based on structure data.


image file: c5ra00197h-f3.tif
Fig. 3 (a) The 1D chain of compound 1 along the b-axis; (b) view of the 2D layer structure in the ab-plane for compound 1.

image file: c5ra00197h-f4.tif
Fig. 4 (a) View of the 3D framework for compound 1; (b) the channel of compound 1 along the b-axis.

Compound 3 crystallizes in the monoclinic space group P2(1)/c (see Table 1). The asymmetric unit contains two crystallographically unique Zn(II) ions, one HL3− anion, one H2L2− anion, one Hdma+ (dma = dimethylamine) cation and three solvate water molecules. As shown in Fig. 5, the Zn(1) center is four-coordinated by four phosphonate oxygen atoms (O1, O4, O7 and O3A) from three phosphonate ligands [Zn(1)–O1 = 1.990(5), Zn(1)–O4 = 1.939(5), Zn(1)–O7 = 1.929(6), Zn(1)–O3A = 1.926(5) Å]. Zn(2) ion is also four-coordinated by four phosphonate oxygen atoms (O2, O6, O8B and O10B) from two phosphonate ligands [Zn(2)–O2 = 1.945(5), Zn(2)–O6 = 1.945(6), Zn(2)–O8 = 1.926(6), Zn(2)–O10 = 1.964(16) Å] (Table S2, ESI). These values are comparable to those reported for other Zn(II) phosphonate compounds.11 In compound 3, the phosphonate ligands adopt two different types of chelating and bridging modes. The HL3− anion functions as a pentadentate ligand and links with three Zn(II) ions (Fig. 2b). Whereas the H2L2− anion acts as a tridentate metal linker, binding two Zn(II) ions (Fig. 2c). Based on the charge balance, the nitrogen atom (N1) and one phosphonate oxygen atom (O12) of the H2L2− anion are 1H-protonated, respectively.


image file: c5ra00197h-f5.tif
Fig. 5 Structure unit of compound 3 showing the atom labeling. Thermal ellipsoids are shown at the 50% probability level. All H atoms are omitted for clarity. Symmetry code for the generated atoms: (A) −x + 2, y − 1/2, −z + 1/2.

Compound 3 exhibits a 3D supramolecular structure type. The HL3− ligands connect adjacent Zn(1) ions and Zn(2) ions into an infinite double chain running along the b-axis, and pyridyl rings are hanging in this chain (Fig. 6a). As shown in Fig. 6b, the double chain is further connected to adjacent chains through hydrogen bonds to form a 2D supramolecular network. There are hydrogen bonds between the nitrogen atoms (N1) and the phosphonate oxygen atoms (O5) from the phosphonate ligands with the distances of 3.1675 Å (N(1)–H(1A)⋯O(5)#5) and the corresponding angles of 160.2° (Fig. 6c). Furthermore, such layers are assembled into a three-dimensional supramolecular network via interlayer N(2)–H(2C)⋯O(11)#6 hydrogen bonds (Fig. 7). The hydrogen bond N(2)–H(2C)⋯O(11)#6 has a D⋯A distance of 2.654(3) Å and D–H⋯A angle of 168.0°. The detailed geometric data is listed in Table 2.


image file: c5ra00197h-f6.tif
Fig. 6 (a) The 1D chain structure of compound 3; (b) view of 2D crystalline framework and O–H⋯O hydrogen bonds (green dotted lines) in 3; (c) the connectivity of hydrogen bonds for compound 3.

image file: c5ra00197h-f7.tif
Fig. 7 (a) The connectivity of hydrogen bonds for compound 3; (b) side view of the 3D supramolecular network connected by hydrogen bonds.

IR spectra

The IR spectra for compounds 1–3 were recorded in the region 4000–400 cm−1 (Fig. S3 and S4, ESI). The IR spectra of compounds 1 and 2 have many similar features corresponding to the common groups, thus only the spectrum of compound 1 will be discussed. The band centered at 3450 cm−1 for compound 1 and 3426 cm−1 for compound 3 are attributed to the O–H stretching vibrations of water molecules and hydroxyl groups.12a The bands are observed at 3099 cm−1 for 1 and 3091 cm−1 for 2, which are probably due to the stretching vibrations of the N–H group.12b Sharp bands located at about 3000 cm−1 are due to the C–H stretching vibrations for compounds 1–3. The set of bands between 1200 and 900 cm−1 are due to stretching vibrations of the tetrahedral {CPO3} groups.12c Additional medium and weak bands at low energies are probably due to bending vibrations of the tetrahedral {CPO3} groups.

Thermal analyses

Thermogravimetric analyses of compounds 1–3 have been performed in the temperature range of 50–1000 °C in static air atmosphere. The TG diagram of compound 1 reveals three main steps of weight losses (Fig. S5, ESI). Between 50 and 210 °C, it completes the first step of weight loss, corresponding to the release of one solvate water molecule. The observed weight loss of 6.3% is a little larger than the calculated value (4.0%). Then it occur the second weight loss between 210 and 385 °C, which can be attributed to the pyrolysis of one dimethylamine molecule. The observed weight loss of 9.6% is close to the calculated value (10.0%). The last step from 385 to 983 °C is due to the decomposition of the phosphonate groups. The total weight loss is 40.6%. The TG curve of compound 2 is similar to that of compound 1, and also shows three steps of weight loss (Fig. S6, ESI). The first step, the weight loss of 4.6% form 50 to 155 °C, can be due to loss of one lattice water molecule (4.0% theoretical). The second step covered a temperature range 155 to 374 °C, which can be attributed to the pyrolysis of one dimethylamine molecule. The third stage occurring between 374 and 937 °C corresponds to the decomposition of the compound. The total weight loss is 42.7%. The final residuals of compounds 1 and 2 are not characterized because that the final residuals of thermal decomposition are amorphous. The TG diagram of compound 3 exhibits one main continuous and complicated weight loss, which can be attributed to the release of three solvate water molecules, one dimethylamine molecule and the combustion of the organic ligands (Fig. S7, ESI). The weight loss started at about 50 °C and ended at 926 °C. The total weight loss is 39.2%. The final residuals of thermal decomposition are amorphous and are not further characterized.

Surface photovoltage properties

Surface photovoltage spectroscopy (SPS) is an effective technique that can be used to investigate the photophysics of the excited states and the surface charge behavior of the sample. It not only relates to the electron transitions under light inducement, but also reflects the separation and transfer of photo-generated charges as well as the optical absorption characteristics of semiconductor samples.13 The principle and the scheme are described elsewhere.14 Surface photovoltage spectroscopy of compounds 1 and 2 were measured with a solid junction photovoltaic cell (ITO/sample/ITO) in the range 300–800 nm. The detected SPS signal is equivalent to the change in the surface potential barrier on illumination (δVs), which is given by the equation: δVs = VsVos, where Vs and Vos are the surface potential barriers before and after illumination, respectively. As far as band to band transitions are concerned, a positive response of surface photovoltage (SPV) (δVs > 0) means that the sample is characterized as a p-type semiconductor, whereas a negative response is an n-type semiconductor.15

The magnitude of the surface potential barrier depends on the numbers of surface net charge. Fig. 8a and b show the SPS spectra of compounds 1 and 2, respectively. They all appear as positive SPV response bands between 300 and 800 nm. It can be seen that the signal detected by SPS at 300–800 nm is a wide peak and is actually the result of an overlap of several SPV response bands. To make the assignment of each SPV response band clear, we separated them by the Origin 7.0 program. As shown in Fig. 8a, the SPS spectrum of compound 1 presents two positive SPV responses at 341 nm and 433 nm in the range 300–800 nm. The response at λmax = 341 nm is attributed to the band gap transition from valence band to conduction band, while the response at λmax = 433 nm can be assigned to the LMCT transition (from ligand to metal charge transfer transition). The SPS of compound 2 is similar to that of compound 1. After Origin 7.0 treatment, two responses bands at 346 nm and 425 nm were observed. The former response band at λmax = 346 nm may be assigned to the band gap transition from valence band to conduction band, and the latter band is attributed to the LMCT transition. The surface photovoltage spectra indicate that not only semiconductor possess photovoltage characteristic, some materials with the semiconductor characteristic (such as coordination polymers) also can exhibit the photovoltage property. Therefore, metal phosphonates can be regarded as a kind of extended novel semiconductors.


image file: c5ra00197h-f8.tif
Fig. 8 The SPS of compounds 1 (a) and 2 (b). The dotted lines are the SPV response bands obtained after treatment with Origin 7.0.

Comparing the SPV responses of compound 1 with other nickel(II) compounds, such as [Ni(pdc)(H2O)3]n, {[Ni(Imh)4(H2O)2][Ni(btec)(H2O)2·(Imh)2]·H2O}n and [Ni(opha)(phen)(H2O)3]·H2O, it reveals that the response intensity of compound 1 is obviously stronger.16 This intensity difference is mainly attributed to the differences in their structures. Compound 1 features a 3D framework structure with coordination bonds. The coordination bonds provide more transmission passage for the electrons, which decided that more electrons diffuse to the surface, resulting in the increase of the SPV response intensities. However, [Ni(pdc)(H2O)3]n and {[Ni(Imh)4(H2O)2][Ni(btec) (H2O)2·(Imh)2]·H2O}n possess 1D infinite chain structure, and the chains are connected to 2D and 3D structure by hydrogen bonds, respectively. [Ni(opha)(phen)(H2O)3]·H2O is just a usual mononuclear structure, which is further assembled into a 1D double chain structure through hydrogen bonds. On account of the coordination bonds are stronger, the ability of hydrogen bonds to transfer electrons or holes is weaker than that of coordination bonds. So the SPV response intensities of [Ni(pdc)(H2O)3]n, {[Ni(Imh)4(H2O)2][Ni(btec)(H2O)2·(Imh)2]·H2O}n and [Ni(opha)(phen)(H2O)3]·H2O are lower than that in compound 1.

Field-induced surface photovoltage spectroscopy (FISPS) can be measured by applying an external electric field to the sample with a transparent electrode. For a p-type semiconductor, when a positive electric field is applied on the semiconductor surface, the SPV response increases since the external field is consistent with the built-in field. On the contrary, when a negative electric field is applied, the SPV response is weakened. In contrast to p-type semiconductors, the SPV response intensity of n-type semiconductors increases as a negative field is applied and reduces as a positive electric field is applied. Fig. 9 shows the FISPS of compounds 1 and 2 in the range of 300–800 nm when the external electric fields are −0.2, 0, and +0.2 V, respectively. The SPV response intensities of the two compounds increase when the positive fields increase, while they reduce when the external negative fields increase. This is attributed to the positive electric field being beneficial to the separation of photoexcited electron–hole pairs, which in turn results in an increase of response intensity; however, the negative electric field has just the opposite effect. The FISPS confirm the p-type characteristics of compounds 1 and 2. The detection about surface charge behavior and photoelectric property of metal phosphonates has the important references and elicitation for exploiting photoelectric property of transition metal compounds. Therefore, it is important and interesting to study the surface photovoltage properties of metal phosphonates.


image file: c5ra00197h-f9.tif
Fig. 9 The FISPS of compounds 1 (a) and 2 (b).

Luminescent properties

The luminescent properties of compound 3 and H4L were investigated in solid state at room temperature. The free phosphonate ligand (H4L) displays a fluorescent emission band at λmax = 419 nm upon excitation at 370 nm (Fig. 10a), the luminescence emission of the phosphonic acid can be attributable to intraligand transitions of H4L, such as π → π* transition. As shown in Fig. 10b, the emission spectrum of compound 3 is very similar to that of discrete H4L, and it demonstrates that the emission spectrum of compound 3 is neither metal-to-ligand charge transfer (MLCT) nor ligand-to-metal charge transfer (LMCT) in nature but rather is attributed to an intraligand emission state.17 Compared to the free H4L ligand, the fluorescent spectrum of compound 3 shows a significant enhancement in intensity in the emission band, which can be attributed to the fact that H4L ligands coordinated to Zn(II) ions would impose rigidity.18 The d10 Zn(II) ion is difficult to oxidize and it is rarely in the nature of metal-to-ligand charge transfer (MLCT). However, Zn(II) complexes often exhibit ligand-centered emission. The ligand-to-metal charge transfer (LMCT) phenomenon can also be observed sometimes in reported Zn(II) complexes.18a The further study for Zn(II) luminescent system is underway. Unfortunately, the luminescent lifetime of compound 3 is not observed, since it is too short to be measured. The investigation of luminescent property indicates that compound 3 may be good candidate for blue-light luminescent materials.
image file: c5ra00197h-f10.tif
Fig. 10 Solid-state emission spectra of H4L (a) and compound 3 (b) at room temperature.

Molecular recognition properties

To examine the potential of compound 3 for sensing of small molecules, compound 3 was immersed in different organic solvent for luminescence studies. The suspensions were prepared by introducing 5 mg of compound 3 into 5.00 mL of acetone, 2,4-pentanedione, DMF, DMA, formaldehyde, ethyl acetate, benzyl alcohol, propylene oxide and THF. Under the same measurement, the luminescence properties indicate that the solvent molecules play an important role in compound 3. Comparing the luminescence intensity of compound 3, the suspensions show varying degrees of quenching effects, particularly in the case of DMF, which exhibit the most significant quenching effect. However, ethanol has the least effect on the luminescence intensity, relatively (Fig. 11). Such solvent-dependent luminescence properties are of interest and considerable for the selective sensing of DMF solvent molecules, therefore we examined the molecular recognition properties of compound 3 in detail for further exploration. Compound 3 was dispersed in ethanol as the standard suspension, and the DMF content was gradually increased to monitor the emissive response. As shown in Fig. 12, the luminescence intensities of compound 3 in suspensions gradually decreased with the addition of DMF solvent. The luminescence intensity almost disappeared at the DMF content of 83.8 vol%. Thus compound 3 can be used as a candidate for selective sensing of DMF.
image file: c5ra00197h-f11.tif
Fig. 11 The emission spectra of compound 3 introduced into various pure solvents (a) and the luminescence intensities of compound 3 introduced into various pure solvents (b).

image file: c5ra00197h-f12.tif
Fig. 12 The emission spectra of compound 3 introduced into various contents of DMF solvent (a) and the luminescence intensities of compound 3 introduced into various contents of DMF solvent (b).

In a recent publication of Zeng et al., they have ascribed the quenching effects on the luminescence intensity to the energy transfer through hydrogen bonding interactions between coordinated water molecules and the solvent molecules.19 In this work, the most significant structural feature of compound 3 is a supramolecular network structure with the presence of hydrogen bonding, highlighting its potential for sensing of small molecules. In our opinion, the existence of hydrogen bonding may enhance the interaction between compound 3 and the guest molecules. It is worth mentioning that the X-ray diffraction of compound 3 after introduction of DMF indicated that the original framework is not changed (Fig. S2, ESI). Although the detailed mechanism for such quenching effect of small solvent molecules is in depth study, the binding interaction of the complexes with guest solvent molecules definitely plays an important role.20 Therefore compound 3 can be used for sensing of DMF.

Conclusions

In this study, three new transition metal(II) phosphonates with 3D framework and supramolecular structures, namely, [M1.5(L)(H2O)]·NH2(CH3)2·H2O (M = Ni (1), Co (2)) and [Zn2(H2L)(HL)]·NH2(CH3)2·3H2O (3) have been synthesized under mixed-solvothermal conditions. Compounds 1 and 2 are isostructural and adopt a 3D framework structure. The {M(1)O5N} octahedra and {CPO3} tetrahedra are interconnected into a 1D chain via corner-sharing, which is further linked to adjacent chains through pyridyl rings to form a 2D layer structure. Neighboring layers are bridged through {M(2)O6}, leading to a 3D framework structure with 1D channel system along the b-axis. For compound 3, the {Zn(1)O4} and {Zn(2)O4} polyhedra are interconnected by phosphonate groups into a 1D double chain, and the double chain is further connected to adjacent chains through hydrogen bonds to form a 2D supramolecular network. Then the neighboring layers are further connected through hydrogen bonding interactions to give rise to a 3D supramolecular structure. The SPS and FISPS of compounds 1 and 2 reveal that they possess positive SPV responses in the range of 300–800 nm and show p-type semiconductor characteristic. Therefore, metal phosphonates can be regarded as a kind of extended novel semiconductors. The investigation of luminescent property indicates that compound 3 may be a good candidate for blue-light luminescent materials, and compound 3 can be a good material to be used for the sensing of DMF.

Acknowledgements

This work is supported by the National Natural Science Foundation of China (Grant no. 21371085).

Notes and references

  1. (a) M. Bazaga-García, R. M. P. Colodrero and K. D. Demadis, J. Am. Chem. Soc., 2014, 136, 5731 CrossRef PubMed; (b) A. Clearfield and K. Demadis, Metal Phosphonate Chemistry: From Synthesis to Applications, Royal Society of Chemistry, Oxford, 2012, p. 164 Search PubMed; (c) M. T. Wharmby, J. P. S. Mowat, S. P. Thompson and P. A. Wright, J. Am. Chem. Soc., 2011, 133, 1266 CrossRef CAS PubMed; (d) H. Hirao and K. Morokuma, J. Am. Chem. Soc., 2010, 132, 17901 CrossRef CAS PubMed; (e) P. O. Adelani and T. E. Albrecht-Schmitt, Inorg. Chem., 2010, 49, 5701 CrossRef CAS PubMed; (f) M. Plabst, L. B. McCusker and T. Bein, J. Am. Chem. Soc., 2009, 131, 18112 CrossRef CAS PubMed.
  2. (a) J. T. Whitteck, P. Malova, S. C. Peck, R. M. Cicchillo, F. Hammerschmidt and W. A. van der Donk, J. Am. Chem. Soc., 2011, 131, 4236 CrossRef PubMed; (b) T. H. Zhou, F. Y. Yi, P. X. Li and J. G. Mao, Inorg. Chem., 2010, 49, 905 CrossRef CAS PubMed; (c) A. N. Alsobrook, B. G. Hauser, J. T. Hupp, E. V. Alekseev, W. Depmeierc and T. E. Albrecht-Schmitt, Chem. Commun., 2010, 46, 9167 RSC.
  3. (a) W. Chu, Z. G. Sun, C. Q. Jiao, Y. Y. Zhu, S. H. Sun, H. Tian and M. J. Zheng, Dalton Trans., 2013, 42, 8009 RSC; (b) K. Chen, D. P. Dong, Z. G. Sun, C. Q. Jiao, C. Li, C. L. Wang, Y. Y. Zhu, Y. Zhao, S. H. Sun, M. J. Zheng, H. Tian and W. Chu, Dalton Trans., 2012, 41, 10948 RSC; (c) D. P. Dong, L. Liu, Z. G. Sun, C. Q. Jiao, Z. M. Liu, C. Li, Y. Y. Zhu, K. Chen and C. L. Wang, Cryst. Growth Des., 2011, 11, 5346 CrossRef CAS; (d) L. Liu, Z. G. Sun, N. Zhang, Y. Y. Zhu, Y. Zhao, X. Lu, F. Tong, W. N. Wang and C. Y. Huang, Cryst. Growth Des., 2010, 10, 406 CrossRef CAS.
  4. L. Kronik and Y. Shapira, Surf. Sci. Rep., 1999, 37, 1 CrossRef CAS.
  5. (a) H. Luo, Y. Y. Zhu, Z. G. Sun, C. Q. Jiao, G. N. Zhang, T. Sun, M. X. Ma and W. Z. Li, RSC Adv., 2014, 4, 49899 Search PubMed; (b) M. J. Zheng, Y. Y. Zhu, Z. G. Sun, J. Zhu, C. Q. Jiao, W. Chu, S. H. Sun and H. Tian, CrystEngComm, 2013, 15, 1445 RSC; (c) D. P. Dong, Z. G. Sun, F. Tong, Y. Y. Zhu, K. Chen, C. Q. Jiao, C. L. Wang, C. Li and W. N. Wang, CrystEngComm, 2011, 13, 3317 RSC; (d) H. Tian, Y. Y. Zhu, Z. G. Sun, F. Tong, J. Zhu, W. Chu, S. H. Sun and M. J. Zheng, New J. Chem., 2013, 37, 212 RSC.
  6. (a) M. Zhang, Z. J. Pu, X. L. Chen, X. L. Gong, A. X. Zhu and L. M. Yuan, Chem. Commun., 2013, 49, 5201 RSC; (b) B. L. Chen, S. C. Xiang and G. D. Qian, Acc. Chem. Res., 2010, 43, 1115 CrossRef CAS PubMed; (c) B. L. Chen, L. B Wang, F. Zapata, G. D. Qian and E. B. Lobkovsky, J. Am. Chem. Soc., 2008, 130, 6718 CrossRef CAS PubMed.
  7. (a) H. Xu, F. Liu, Y. J. Cui, B. L. Chen and G. D. Qian, Chem. Commun., 2011, 47, 3153 RSC; (b) J. Y. Guo, H. Xu, S. Q. Su, J. F. Cai, S. Dang, S. C. Xiang, G. D. Qian, H. J. Zhang, M. O'Keeffe and B. L. Chen, Chem. Commun., 2011, 47, 5551 RSC; (c) Y. Q. Xiao, Y. J. Cui, Q. Zheng, S. C. Xiang, G. D. Qian and B. L. Chen, Chem. Commun., 2010, 46, 5503 RSC; (d) Z. J. Zhang, S. C. Xiang, X. T. Rao, Q. Zheng, F. R. Fronczek, G. D. Qian and B. L. Chen, Chem. Commun., 2010, 46, 7205 RSC.
  8. (a) S. P. Shi, Y. Y. Zhu, Z. G. Sun, W. Zhou, L. L. Dai, M. X. Ma, W. Z. Li, H. Luo and T. Sun, Cryst. Growth Des., 2014, 14, 1580 CrossRef CAS; (b) W. Zhou, Y. Y. Zhu, C. Q Jiao, Z. G. Sun, S. P. Shi, L. L. Dai, T. Sun, W. Z. Li, M. X. Ma and H. Luo, CrystEngComm, 2014, 16, 1174 RSC; (c) L. L. Dai, Y. Y. Zhu, C. Q. Jiao, Z. G. Sun, S. P. Shi, W. Zhou, W. Z. Li, T. Sun, H. Luo and M. X. Ma, CrystEngComm, 2014, 16, 5050 RSC.
  9. G. M. Sheldrick, SHELXTL-97, Program for X-ray Crystal Structure Solution and Refinement, University of Göttingen, Germany, 1997 Search PubMed.
  10. (a) S. F. Tang, L. J. Li, X. X. Lv, C. Wang and X. B. Zhao, CrystEngComm, 2014, 16, 7043 RSC; (b) O. Yakubovich, G. Kiriukhina, O. Dimitrova, A. Volkov, A. Golovanov, O. Volkova, E. Zvereva, S. Baidya, T. Saha-Dasguptab and A. Vasiliev, Dalton Trans., 2013, 42, 14718 RSC; (c) A. O. Gudima, G. V. Shovkova, O. K. Trunova, F. Grandjean, G. J. Long and N. Gerasimchuk, Inorg. Chem., 2013, 52, 7467 CrossRef CAS PubMed.
  11. (a) X. L. Zhang, K. Cheng, F. Wang and J. Zhang, Dalton Trans., 2014, 43, 285 RSC; (b) Y. S. Ma, X. Y. Tang, W. Y. Yin, B. Wu, F. F. Xue, R. X. Yuan and S. Royb, Dalton Trans., 2012, 41, 2340 RSC; (c) H. P. Perry, K. J. Gagnon, J. Law, S. Teatb and A. Clearfielda, Dalton Trans., 2012, 41, 3985 RSC.
  12. (a) K. R. Ma, J. N. Xu, L. R. Zhang, J. Shi, D. J. Zhang, Y. L. Zhu, Y. Fan and T. Y. Song, New J. Chem., 2009, 33, 886 RSC; (b) F. Fredoueil, D. Massiot, P. Janvier, F. Gingl, M. Bujoli-Doeuff, M. Evain, A. Clearfielda and B. Bujoli, Inorg. Chem., 1999, 38, 1831 CrossRef CAS PubMed; (c) A. Cabeza, X. Ouyang, C. V. K. Sharma, M. A. G. Aranda, S. Bruque and A. Clearfield, Inorg. Chem., 2002, 41, 2325 CrossRef CAS PubMed.
  13. (a) B. F. Xin, L. Q. Jing, Z. Y. Ren, B. Q. Wang and H. G. Fu, J. Phys. Chem. B, 2005, 109, 280 CrossRef PubMed; (b) Y. H. Lin, D. J. Wang, Q. D. Zhao, M. Yang and Q. L. Zhang, J. Phys. Chem. B, 2004, 108, 3202 CrossRef CAS.
  14. (a) J. Zhang, D. J. Wang, Y. M. Chen, T. J. Li, H. F. Mao, H. J. Tian, Q. F. Zhou and H. J. Xu, Thin Solid Films, 1997, 300, 208 CrossRef CAS; (b) L. Q. Jing, X. J. Sun, J. Shang, W. M. Cai, Z. L. Xu, Y. G. Du and H. G. Fu, Sol. Energy Mater. Sol. Cells, 2003, 79, 133 CrossRef CAS.
  15. (a) Q. X. Han, P. T. Ma, J. W. Zhao, Z. L. Wang, W. H. Yang, P. H. Guo, J. P. Wang and J. Y. Niu, Cryst. Growth Des., 2011, 11, 436 CrossRef CAS; (b) S. Z. Li, J. W. Zhao, P. T. Ma, J. Du, J. Y. Niu and J. P. Wang, Inorg. Chem., 2009, 48, 9819 CrossRef CAS PubMed.
  16. L. P. Sun, S. Y. Niu, J. Jin, G. D. Yang and L. Ye, Inorg. Chem. Commun., 2006, 9, 679 CrossRef CAS PubMed.
  17. (a) J. Wu, H. W. Hou, H. Y. Han and Y. Fan, Inorg. Chem., 2007, 46, 7960 CrossRef CAS PubMed; (b) M. S. Wang, G. C. Guo, M. L. Fu, L. Xu, L. Z. Cai and J. S. Huang, Dalton Trans., 2005, 2899 RSC; (c) J. L. Song, H. H. Zhao, J. G. Mao and K. D. Dunbar, Chem. Mater., 2004, 16, 1884 CrossRef CAS.
  18. (a) T. Ma, M. X. Li, Z. X. Wang and J. C. Zhang, Cryst. Growth Des., 2014, 14, 4155 CrossRef CAS; (b) H. Y. Wang, S. Gao, L. H. Huo, S. W. Ng and J. G. Zhao, Cryst. Growth Des., 2008, 8, 665 CrossRef CAS; (c) P. Roy, K. Dhara, M. Manassero, J. Ratha and P. Banerjee, Inorg. Chem., 2007, 46, 6405 CrossRef CAS PubMed.
  19. (a) Y. F. Xiao, T. T. Wang and H. P. Zeng, J. Solid State Chem., 2015, 22, 137 Search PubMed; (b) D. Ma, W. X. Wang, Y. W. Li, J. Li, C. Daiguebonne, G. Calvezc and O. Guillou, CrystEngComm, 2010, 12, 4372 RSC.
  20. (a) R. Fu, S. M. Hu and X. T. Wu, CrystEngComm, 2011, 13, 2331 RSC; (b) K. L. Wong, G. L. Law, Y. Y. Yang and W. T. Wong, Adv. Mater., 2006, 18, 1051 CrossRef CAS.

Footnote

Electronic supplementary information (ESI) available: X-ray crystallographic files in CIF format for compounds 1 and 3. IR spectra of compounds 1–3, XRD patterns of the experiments compared to those simulated from X-ray single-crystal data for compounds 1–3, TG curves of compounds 1–3. CCDC 1040904 and 1040905. See DOI: 10.1039/c5ra00197h

This journal is © The Royal Society of Chemistry 2015
Click here to see how this site uses Cookies. View our privacy policy here.