A molecular assembly of piperidine carboxylic acid dithiocarbamate on gold nanoparticles for the selective and sensitive detection of Al3+ ion in water samples†
Vaibhavkumar N. Mehtaa,
Rakesh Kumar Singhalb and
Suresh Kumar Kailasa*a
aDepartment of Applied Chemistry, S. V. National Institute of Technology, Surat – 395 007, India. E-mail: sureshkumarchem@gmail.com; skk@ashd.svnit.ac.in; Fax: +91-261-2227334; Tel: +91-261-2201730
bAnalytical Chemistry Division, Bhabha Atomic Research Center, Trombay, Mumbai 400085, India
First published on 27th March 2015
Abstract
A sensitive and selective colorimetric method has been developed for the detection of Al3+ ions using 4-piperidine carboxylic acid dithiocarbamate-functionalized gold nanoparticles (PCA-DTC-Au NPs) as a probe. A high degree of PCA-DTC-Au NP aggregation was observed following the addition of Al3+ ion in the presence of 0.4 M NaCl in Tris–HCl buffer at pH 6.0. The Al3+ ions effectively induced the aggregation of PCA-DTC-Au NPs, resulting in a color change from red to blue. The characteristic surface plasmon resonance (SPR) peak of PCA-DTC-Au NPs was red-shifted to 660 nm. The Al3+ ion-induced aggregation of PCA-DTC-Au NPs was monitored by UV-visible spectrophotometry. The absorbance ratio (A660 nm/A523 nm) was linear for concentrations of Al3+ ion within the range 0.01–100 μM, with a correlation coefficient of R2 = 0.997. The probe was free from interference due to other metal ions and the color change was extremely specific towards Al3+ ion. The applicability of the present method in practical samples was studied by determining Al3+ ion in spiked water samples (drinking, tap, canal and river water) containing known concentrations of Al3+ ion.
1. Introduction
The quantitative and qualitative detection of heavy metal ions in a variety of environmental and biological samples has recently assumed considerable importance due to their toxic effect at certain concentrations on living organisms.1,2 Aluminum is the third most abundant metal element in the earth's crust, accounting for around 8% of the total mineral in the biosphere.3–5 The distribution of aluminum in the environment has been aggravated by the widespread use of aluminum-based materials in industrial applications, including paper, textiles, cosmetics and pharmaceuticals, and also for water treatment, in food additives and in the production of light alloys.6–9 Although aluminum is not essential to any biological processes, it shows toxic effects in humans at defined concentrations when it accumulates in the body through the food chain.10 Furthermore, the accumulation of excessive amounts of Al3+ ion in the human body may damage the cellular energy transfer processes and metabolism in various organs. Importantly, the disruption of Al3+ ion level has also been linked to Alzheimer's and Parkinson's diseases and to breast cancer.11–16In addition, agricultural production is significantly influenced by contamination of soil and water by aluminum, which affects the cellular uptake by plant roots of nutrients such as Ca2+ ion.17–19 To avoid the toxic effect of Al3+ ion, WHO has recommended that the maximum intake of Al3+ should be limited to 3–10 mg per day, with a weekly tolerable limit of 7 mg kg−1 of body mass.20 The trace identification of Al3+ ion in various environmental and biological samples has thus become vitally important.
A number of traditional analytical techniques have been developed for the trace identification of Al3+ ion in environmental and biological samples, including atomic absorption spectrometry, inductively coupled plasma mass spectrometry and atomic emission spectrometry, and atomic fluorescence spectrometry and voltammetry.21–26 Unfortunately these methods are often time-consuming and complicated, and require tedious sample preparation prior to on-site metal ion detection. The development of a simple but sensitive method which allows the detection of Al3+ ion in environmental and biological samples of minimal volume is essential.
In recent years great efforts have been committed to the determination of Al3+ ion in environmental and biological samples using a variety of organic ligands, including rhodamine, fluorescein, benzothiazole, anthraquinone, naphthalimide, naphthalene and coumarin as optical probes.27–30 Similarly, Dong's group has synthesized sodium 4-(2,5-diphenyl-1H-pyrrol-1-yl)benzoate (TriPP-COONa) for use as a water-soluble “turn-on” fluorescent chemosensor for the detection of Al3+ ion.31 Although these probes provide relatively good selectivity and sensitivity towards Al3+ ion, they unfortunately require specific solvents, together with a complicated multistep procedure for preparation.32 Colorimetric assays based on metallic nanoparticles, particularly Au and Ag NPs, have attracted interest due to their simplicity, cost-effectiveness and high sensitivity, and the fact that identification can be either by color change or UV-visible spectroscopy, with minimal sample requirement.33,34
Au NPs are used as a potential colorimetric probe due to their high extinction coefficient and distance-dependent optical properties.35 As a result Au NPs-based colorimetric assays provide a simple platform for the detection of a wide variety of analytes without the need for advanced instruments. The color changes are sensitive to size and shape, and the color of the solution changes from red to blue, accompanied by a shift in the surface plasmon band to longer wavelength.36 Limited work has so far been reported on the detection of Al3+ ion in environmental and biological samples using Au and Ag NP-based colorimetric methods. For example, Li et al. have illustrated the use of Au NPs functionalized by the pentapeptide, Cys–Ala–Leu–Asn–Asn (CALNN), as a colorimetric probe for the detection of Al3+ ion in aqueous media and in living cellular surfaces.37 Ye's group has described the use of mononucleotide-functionalized Au and Ag NPs for the colorimetric detection of Al3+ ion on living cellular surfaces.38 Similarly, Yang and co-workers have developed a colorimetric assay for Al3+ ion in water samples using citrate-functionalized Au NPs as a colorimetric probe.39 Wu et al. have demonstrated the use of triazole-ether-functionalized Au NPs as a probe for the colorimetric detection of Al3+ ion in sea water samples.40 5-Mercaptomethyltetrazole-functionalized Au NPs have been used as a colorimetric probe for the detection of Al3+ ion in environmental water and human urine samples.41 Most recently, Wu et al. have synthesized glutathione-functionalized Ag NPs for the colorimetric detection of Al3+ ion in water samples.42 These reports demonstrate the potential use of surface-functionalized Au and Ag NPs as colorimetric probes for the sensitive and selective detection of Al3+ ion in environmental and biological samples. Hence, surface modification of Au NPs with various organic ligands plays a critical role in achieving selective interaction with the target analytes.43
Recently dithiocarbamate derivatives have been in great demand due to their ease of preparation and greatly reduced interatomic distance between the two sulfur atoms, which can easily become attached to the surface of Au NPs by an Au–S bond.44,45 To date, a number of sensing approaches have described the use of dithiocarbamate derivatives based on Au and Ag NPs for the selective and sensitive detection of biomolecules, pesticides, cations and anions in environmental and biological samples.46–50 Inspired by these reports, we have functionalized Au NPs with 4-piperidine carboxylic acid dithiocarbamate and evaluated this as a potential colorimetric probe for the trace identification of Al3+ ion.
In the present study we used PCA-DTC-Au NPs as a colorimetric probe for the selective and sensitive detection of Al3+ ion in spiked water samples (drinking, tap, canal and river water). The PCA-DTC-Au NPs became quickly aggregated in the presence of Al3+ ion, resulting a red shift in the SPR peak and a visual change in color from red to blue. The aggregation of PCA-DTC-Au NPs may be attributed to the formation of complexes between carboxylate and Al3+ ion (Scheme 1).
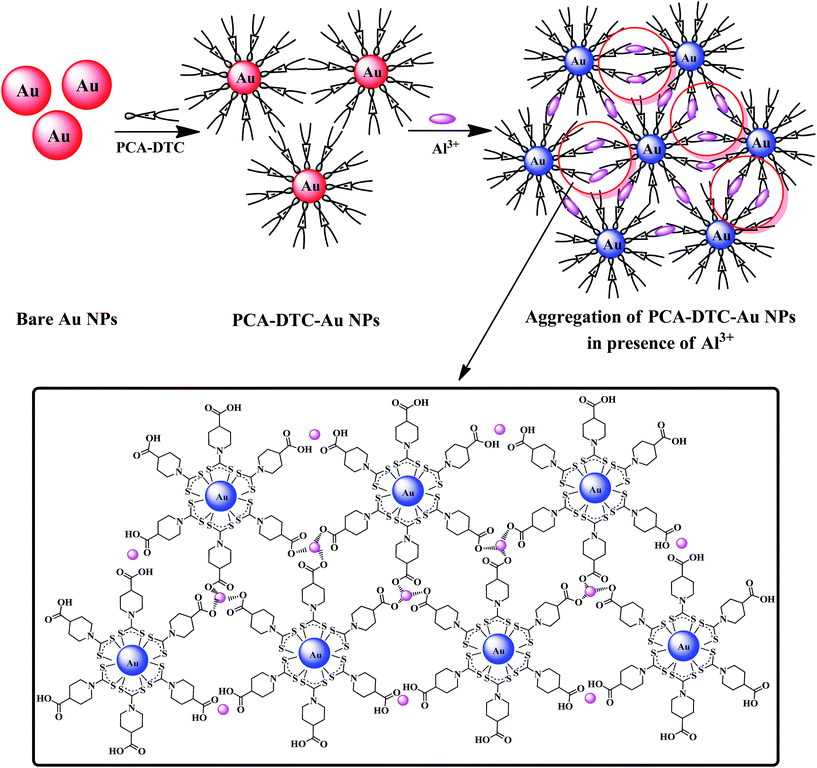 | ||
| Scheme 1 Schematic representation of the colorimetric sensing of Al3+ ion using PCA-DTC-Au NPs as a probe. | ||
2. Experimental
2.1 Chemicals and materials
All chemicals were of analytical grade and were used without further purification. Chloroauric acid (HAuCl4·xH2O), tris(hydroxymethyl)aminomethane (Tris), 4-piperidine carboxylic acid, and metal salts (Cu(NO3)2·3H2O, Co(NO3)2·6H2O, Cd(NO3)2·4H2O, Pb(NO3)2, Hg(NO3)2·H2O, NiSO4·6H2O, Mn(NO3)2·4H2O, Mg(NO3)2·6H2O, Zn(NO3)2·6H2O, Ba(NO3)2·4H2O, CaCl2·2H2O, FeCl2·4H2O, FeCl3·6H2O and AlCl3) were purchased from Sigma-Aldrich, USA. Carbon disulfide, acetic acid and ethanol were obtained from Merck Ltd., India, and trisodium citrate dihydrate from SD Fine Chemicals Ltd., India. Ammonium acetate was supplied by Labort Fine Chemicals Ltd., India. Sodium acetate, NaCl, KCl, NaOH, Na2HPO4, K2HPO4, and HCl were obtained from Finar Chemicals Ltd., India. Solutions were prepared using Milli-Q-purified water.2.2 Synthesis of PCA-DTC-Au NPs
The Au NPs were prepared by citrate-mediated reduction of HAuCl4 using the reported method, with minor modifications.51 HAuCl4 solution (50 mL; 1.0 mM) was refluxed under constant stirring and trisodium citrate (5 mL; 38.8 mM) then injected into the solution and stirred for further 15 min. The formation of Au NPs was indicated by a color change from pale yellow to ruby red.The dithiocarbamate derivative of piperidine carboxylic acid (PCA-DTC) was synthesized by the following procedure. An equimolar (0.01 M) mixture of piperidine carboxylic acid and CS2 was heated at 50 °C for 4 h in ethanolic KOH. The resulting dithiocarbamate derivative was filtered off and acidified with dilute AcOH before recrystallizing from ethanol. PCA-DTC-Au NPs were obtained by adding 1.0 mL of 1.0 mM PCA-DTC solution into 15 mL of bare Au NPs with continuous stirring over 2 h. To remove unbound excess PCA-DTC ligands, the PCA-DTC-Au NP solution was centrifuged in sequence at 10![[thin space (1/6-em)]](https://www.rsc.org/images/entities/char_2009.gif) 000 and 4000 rpm for 5 min.
000 and 4000 rpm for 5 min.
The resulting molecularly assembled PCA-DTC-Au NPs were used as a colorimetric probe for metal ion detection. ESI Fig. S1† gives a schematic illustration of the synthesis of PCA-DTC and the functionalization of Au NPs with PCA-DTC.
2.3 Colorimetric detection of Al3+ ion using PCA-DTC-Au NPs
Typically, for each measurement 400 μL of Al3+ ion at different concentrations (0.01 to 100 μM) were added separately into 1.3 mL of PCA-DTC-Au NPs in the presence of 0.4 M NaCl, Tris–HCl buffered at pH 6.0. The sample vials were vortexed 1 min and then allowed to stand 5 min at room temperature. The color of the solution changed from red to blue, confirming the aggregation of PCA-DTC-Au NPs by Al3+ ion. The aggregation was confirmed by UV-visible absorption spectra, dynamic light scattering (DLS) and transmission electron microscopy (TEM).2.4 Detection of Al3+ ion in environmental water samples
In order to validate the practical applicability of the method, the detection of Al3+ ion in samples of drinking, tap, canal and river water was carried out using PCA-DTC-Au NPs as a probe. The water samples were collected from a variety of environmental sources in Surat, India: drinking and tap water from SVNIT, canal water from an agriculture canal, and river water from Tapi River, and the samples were filtered through a 0.45 μm membrane. The water samples were spiked with different concentrations of Al3+ ion (1.0, 50 and 100 μM) and analyzed using the procedure described.2.5 Instrumentation
UV-visible spectra were recorded on a Maya Pro 2000 spectrophotometer (Ocean Optics, USA) at room temperature. Fourier transform infrared (FT-IR) spectra were determined on a PerkinElmer spectrometer (FT-IR Spectrum BX, Germany), 1H NMR spectra on a Varian 400 MHz instrument (USA), and TEM samples by dropping 10–15 μL NPs colloidal solution onto a copper grid (3 mm, 200 mesh) coated with carbon film, allowing it to dry, and then analyzing it using a Tecnai 20 (Philips, Holland) transmission electron microscope at an acceleration voltage of 100 kV. DLS measurements were carried out using a Zetasizer Nano ZS90 (Malvern, UK). Energy-dispersive X-ray spectra (EDX) were recorded on a JSM-7600F scanning electron microscope (Jeol, Japan).3. Results and discussion
3.1 Characterization of PCA-DTC-Au NPs
The PCA-DTC-Au NPs were characterized by spectroscopic (UV-visible, FT-IR and 1H NMR) and microscopic techniques (TEM and DLS) to confirm their functionalization with PCA-DTC. Fig. 1 shows the UV-visible absorption spectra of bare Au NPs and PCA-DTC-Au NPs. The bare Au NPs showed a characteristic SPR peak at 519 nm, but after functionalization with PCA-DTC the SPR peak was very slightly red-shifted to 523 nm, confirming the attachment of PCA-DTC by a Au–S ‘zero length’ covalent bond. The red-shift in the SPR peak may be attributed to the change in the dielectric constant of the negatively charged PCA-DTC-Au NPs.52 It was noticed that the PCA-DTC-Au NPs remained in dispersion, due to electrostatic repulsion between the negatively charged surfaces of the PCA-DTC-Au NPs.53 ESI Fig. S2† shows the FT-IR spectra of piperidine 4-carboxylic acid, PCA-DTC and PCA-DTC-Au NPs, and ESI Fig. S2(a)† shows the FT-IR spectrum of piperidine 4-carboxylic acid, with characteristic peaks at 3527 and 3447 cm−1, corresponding to stretching vibrations of the –OH and –NH groups, respectively. A peak at 1642 cm−1 was attributed to the carboxylic (–COO) group of piperidine, and the peaks at 1473, 2856 and 2935 cm−1 to –C–H stretching of the methylene group. A strong peak due to C–N stretching was observed at 1410 cm−1, and –OH bending and –N–H wagging of the secondary amine were observed at 934 and 682 cm−1, respectively. In addition, the FT-IR spectrum of PCA-DTC exhibited new peaks at 1253, 1107 and 963 cm−1, which corresponded to the stretching and bending of –CS–NH, –C–S and –C![[double bond, length as m-dash]](https://www.rsc.org/images/entities/char_e001.gif) S groups, respectively. The characteristic peak at 2817 cm−1 represented the stretching and bending vibrations of the –S–H group in PCA-DTC (ESI Fig. S2(b)†). It can be seen that the stretching and bending vibrations of the –S–H group at 2817 cm−1 had disappeared, confirming attachment of the –S–H group to the surface of Au NPs by a thiolate linkage. The characteristic PCA-DTC peaks at 1253, 1107 and 963 cm−1 had disappeared or shifted after attachment to the surface of the Au NPs (ESI Fig. S2(c)†).
S groups, respectively. The characteristic peak at 2817 cm−1 represented the stretching and bending vibrations of the –S–H group in PCA-DTC (ESI Fig. S2(b)†). It can be seen that the stretching and bending vibrations of the –S–H group at 2817 cm−1 had disappeared, confirming attachment of the –S–H group to the surface of Au NPs by a thiolate linkage. The characteristic PCA-DTC peaks at 1253, 1107 and 963 cm−1 had disappeared or shifted after attachment to the surface of the Au NPs (ESI Fig. S2(c)†).
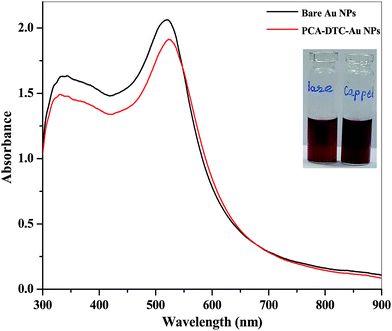 | ||
| Fig. 1 UV-visible spectra of bare Au NPs and PCA-DTC-Au NPs. Inset shows bare Au NPs and PCA-DTC-Au NPs. | ||
ESI Fig. S3† shows the 1H NMR spectra of piperidine 4-carboxylic acid, PCA-DTC and PCA-DTC-Au NPs. The peaks at 1.5–1.9 δ ppm and 2.8–3.3 δ ppm correspond to the four methylene groups in piperidine. The peaks at 2.3 and 4.6 δ ppm are attributed to –C–H and –NH groups, respectively (ESI Fig. S3(a)†). As shown in ESI Fig. S3(b),† the –NH peak at 4.6 δ ppm disappeared and a new peak of –SH group was observed at 2.5 δ ppm, confirming the formation of PCA-DTC. Moreover, the 1H NMR spectrum of PCA-DTC-Au NPs did not exhibit any proton peaks, which confirmed the up-field chemical shift of all the protons in the PCA-DTC-Au NPs (ESI Fig. S3(c)†).
The average hydrodynamic diameter and morphology of the PCA-DTC-Au NPs were investigated by DLS and TEM. Fig. 2(a) and (b) show DLS of bare Au NPs and PCA-DTC-Au NPs, and it can be seen that the bare Au NPs were well dispersed, with an average hydrodynamic diameter ∼15 nm. However, the hydrodynamic diameter of the Au NPs was slightly increased to ∼22 nm, due to attachment of PCA-DTC to their surface (Fig. 2(b)).
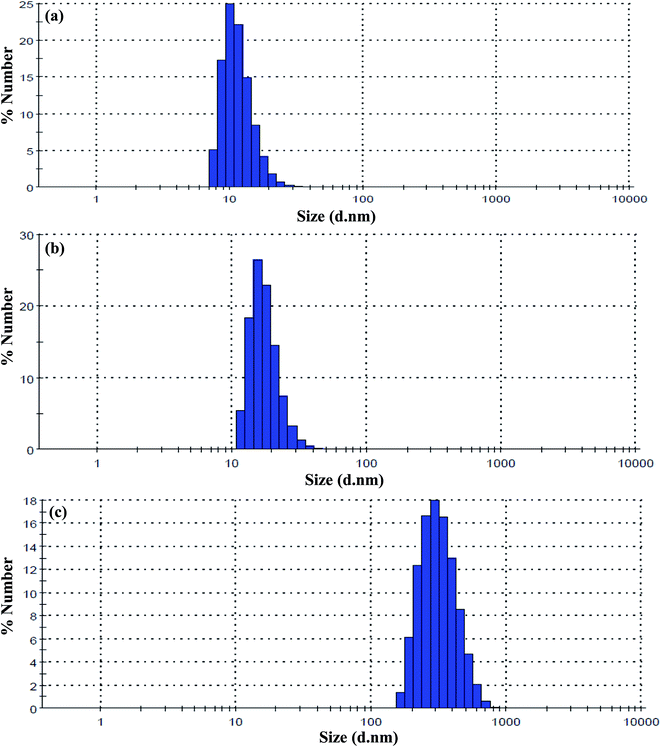 | ||
| Fig. 2 DLS of (a) bare Au NPs and (b) PCA-DTC-Au NPs, and (c) Al3+ ion-induced aggregation of PCA-DTC-Au NPs. | ||
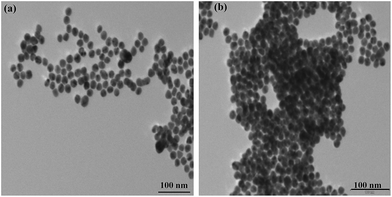
Fig. 3(a) shows the TEM image of PCA-DTC-Au NPs, from which it is seen that the PCA-DTC-Au NPs were spherical in shape and uniformly dispersed in the aqueous solution, with an average size ∼13 nm. This is slightly at variance with the DLS data, due to the fact that TEM measures only metallic core size, whereas in DLS the average hydrodynamic diameter of PCA-DTC-Au NPs can also be calculated for the attached organic molecules by light scattering through the sample.50
ESI Fig. S4(a) and (b)† show the EDX spectra of bare Au NPs and PCA-DTC-Au NPs. The EDX of bare Au NPs and PCA-DTC-Au NPs were obtained by projecting an electron beam on the NPs, which revealed the existence of the elements Au, C, O, and S in the PCA-DTC-Au NPs. The attachment of PCA-DTC to the surface of the Au NPs was confirmed by calculating the atomic percentage ratio between the Au NPs and the sulfur atom (Au/S = 1).
3.2 Selective recognition of Al3+ ion using PCA-DTC-Au NPs as a probe
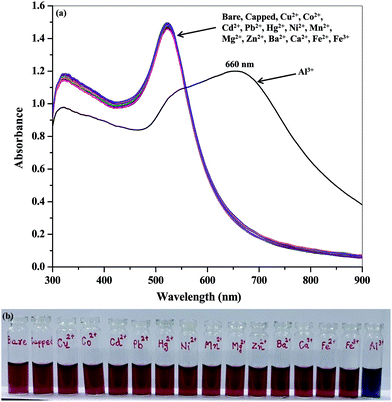
The selectivity of PCA-DTC-Au NPs was investigated by adding 400 μL of solutions of various metal ions (Cu2+, Co2+, Cd2+, Pb2+, Hg2+, Ni2+, Mn2+, Mg2+, Zn2+, Ba2+, Ca2+, Fe2+, Fe3+ and Al3+, 100 μM) into 1.3 mL of PCA-DTC-Au NPs in the presence of 0.4 M NaCl with Tris–HCl buffer at pH 6.0. The corresponding UV-visible spectra and photographic images are shown in Fig. 4. It can be observed that the Al3+ ion alone effectively induced the aggregation of PCA-DTC-Au NPs, with a red-shift in the SPR peak from 523 to 660 nm, giving a color change from red to blue that could be observed with the naked eye. The SPR peak and the color of the PCA-DTC-Au NPs showed no significant change in the presence of the other metal ions, demonstrating that these had not induced the aggregation of PCA-DTC-Au NPs. These results confirmed that it was only the Al3+ ion that induced a higher degree of PCA-DTC-Au NP aggregation by the formation of a complex. As shown in ESI Fig. S5,† it is clear that it was only the Al3+ ion that showed a higher absorption ratio (A660 nm/A523 nm), confirming the greater selectivity of PCA-DTC-Au NPs towards the Al3+ ion than other metal ions.3.3 Sensing mechanism for the detection of Al3+ ion using PCA-DTC-Au NPs
It is well known that Al3+ ion is a ‘hard’ acid and preferably binds with ‘hard’ donor sites such as N and O atoms in its coordination sphere.27 As shown in ESI Fig. S1,† 4-piperidine carboxylic acid contains amino (–NH) and carboxyl (–COOH) groups which can preferentially bind to metal ions by formation of coordination complexes. The secondary amino group (–NH) did not act as a donor site, since it was already involved in the formation of a dithiocarbamate derivative with carbon disulfide, and it was therefore only carboxyl groups that were available to form complexes with Al3+. Furthermore, the carboxylate ion was generated by deprotonation of the carboxylic acid of PCA-DTC, since the pKa1 and pKa2 values of piperidine 4-carboxylic acid are 4.33 and 10.43, respectively. It follows that the –COO− group showed high affinity to form a complex with ‘hard’ metal ions at pH 6.0.54 As a result, the inter-particle distance of PCA-DTC-Au NPs was greatly decreased by the Al3+ ion through complex formation between the –COO− group of PCA-DTC-Au NPs and the Al3+ ion, yielding a red-shift in the SPR peak and a visual color change from red to blue. To support this assumption, the emission intensity of carboxylate ion containing the organic derivative, TriPP–COO−, was quickly and greatly enhanced by the addition of Al3+ ion, due to electrostatic binding between the Al3+ ion and TriPP–COO−, and resulting in an aggregation-induced emission mechanism.31 We therefore concluded that the carboxylic group of PCA-DTC-Au NPs was acting as a donor and binding group for Al3+ ions, thereby decreasing the interparticle distance, and thus providing a potential ‘zero-wait’ detection probe for Al3+ ion.In addition, the Al3+ ion-induced aggregation of PCA-DTC-Au NPs was confirmed by DLS and TEM. As shown in Fig. 2(c), the average hydrodynamic diameter of PCA-DTC-Au NPs was drastically increased from ∼21 nm to ∼366 nm by the addition of Al3+ ion (100 μM), confirming the aggregation of PCA-DTC-Au NPs induced by Al3+ ion through complex formation between the carboxylic group of PCA-DTC-Au NPs and the Al3+ ion.
Fig. 3(b) shows a TEM image of the Al3+-induced aggregation of PCA-DTC-Au NPs, from which it can be observed that the monodisperse PCA-DTC-Au NPs became polydisperse by the addition of Al3+ ion (100 μM). As shown in ESI Fig. S4(c),† the EDX spectrum of Al3+ ion-induced aggregation of PCA-DTC-Au NPs exhibited the optical absorption peak of Au, S and Al elements within the range 1 to 3 keV, confirming that the aggregation of PCA-DTC-Au NPs had been induced by Al3+ ion.
3.4 Influence of pH on the colorimetric detection of Al3+ ion
The effect of various pH buffers was also investigated to establish the stability and the sensing ability of PCA-DTC-Au NPs towards Al3+ ion. ESI Fig. S6† shows the absorption ratios (A660 nm/A523 nm) of PCA-DTC-Au NPs before and after addition of Al3+ ion in the presence, respectively, of Tris, phosphate buffer saline, sodium acetate and ammonium acetate buffer systems within the pH range 2.0–12. A higher absorption ratio (A660 nm/A523 nm) of PCA-DTC-Au NPs was observed at pH 2.0, 11 and 12 without addition of Al3+ ions, indicating the self-aggregation of PCA-DTC-Au NPs due to intermolecular hydrogen bonding between the protonated carboxylate group of PCA-DTC-Au NPs and protonation of dithiocarbamate anions due to breaking of the Au–S bond at acidic pH (pH ≤ 4.0).55,56 In addition, the –SH group became detached from the surface of the Au NPs due to the insignificant deprotonation of dithiocarbamate groups at pH ≥ 10.0.57 The PCA-DTC-Au NPs remained stable between pH 4.0 and 9.0 due to electrostatic repulsion between the negatively charged carboxylate ions of PCA-DTC.58The effect of buffer pH on the Al3+ ion-induced aggregation of PCA-DTC-Au NPs was also investigated, and is shown in ESI Fig. S6.† These results revealed that the absorption ratio (A660 nm/A523 nm) of PCA-DTC-Au NPs was significantly greater in Tris–HCl buffer at pH 6.0 following the addition of Al3+ ion, and gradually decreased afterwards with other buffer solutions. The decrease in absorption ratio in alkaline media may be attributed to the formation of an aluminum hydroxide precipitate at pH ≥ 8.0. The Tris–HCl buffer at pH 6.0 was therefore selected as optimal for the effective Al3+ ion-induced aggregation of PCA-DTC-Au NPs.
3.5 Optimization of NaCl concentration
The ionic strength of the Au NPs solution is also an indispensable parameter for improving the sensitivity of the system towards the target analyte, by varying the electrostatic interaction between the latter and Au NPs.59 The effect of NaCl concentration was therefore investigated to ascertain the lower detection limit. ESI Fig. S7† shows the UV-visible spectra of PCA-DTC-Au NPs in the presence of a range of NaCl concentrations (0.05 to 0.50 M). These results revealed that no noticeable change was observed, either in the SPR peak or in the color of PCA-DTC-Au NPs, with NaCl concentrations between 0.05 and 0.35 M. It was observed that increasing concentrations of NaCl, from 0.40 to 0.50 M, caused the PCA-DTC-Au NPs to aggregate, due to a decrease in the electrostatic repulsion between adjacent nanoparticles. The aggregation of PCA-DTC-Au NPs resulted in a visual color change from red to blue, leading to a red-shift in the SPR peak from 523 to 700 nm.ESI Fig. S8 and S9† show the UV-visible spectra and absorption ratio (A660 nm/A523 nm) of PCA-DTC-Au NPs after the addition of Al3+ ion (100 μM) at different concentrations of NaCl. It can be observed that the absorption ratio (A660 nm/A523 nm) of PCA-DTC-Au NPs in the presence of Al3+ ion (100 μM) increased with increasing NaCl concentration. Moreover, the absorption ratio of PCA-DTC-Au NPs in the presence of Al3+ ion was relatively higher at 0.40 M NaCl concentration. We therefore selected 0.40 M NaCl as the optimum concentration for the sensitive detection of Al3+ ion.
3.6 Sensitivity of PCA-DTC-Au NPs in the detection of Al3+ ion
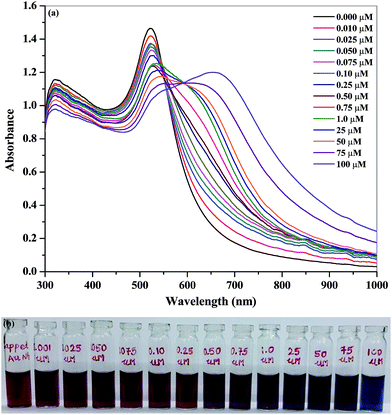
The sensitivity of PCA-DTC-Au NPs as a colorimetric probe was evaluated in the presence of different concentrations of Al3+ ion, and the corresponding UV-visible spectra were measured under optimized conditions. Fig. 5 shows the UV-visible spectra and color change of PCA-DTC-Au NPs upon addition of concentrations of Al3+ ion between 0.010 and 100 μM. As seen in Fig. 5(b), at increasing concentrations of Al3+ ions within this range the color of the PCA-DTC-Au NPs solution gradually changed from red to purple and then to blue, confirming the higher degree of PCA-DTC-Au NPs aggregation with a higher concentration of Al3+ ions.The SPR peak of PCA-DTC-Au NPs at 523 nm gradually decreased with increasing concentration of Al3+ ion, resulting in a new SPR peak at 660 nm (Fig. 5(a)). A calibration graph was created showing the absorption ratio (A660 nm/A523 nm) against log concentration of Al3+ ion between 0.01 and 100 μM, and this can be utilized for quantification of Al3+ ion. As shown in ESI Fig. S10,† a linear relationship was obtained, using eqn (1):
y = 1.7562 + 0.1933![[thin space (1/6-em)]](https://www.rsc.org/images/entities/char_2009.gif) log log![[thin space (1/6-em)]](https://www.rsc.org/images/entities/char_2009.gif) C [Al3+] C [Al3+]
| (1) |
The limit of detection (LOD) for Al3+ ion was calculated using eqn (2)
| LOD = 3σ/k, | (2) |
It is well established that the size, shape and concentration of Au NPs may differ from batch to batch and that SPR-based sensors are dependent both on their size and shape and on the surrounding chemical environment.34 We therefore constructed a calibration graph for the detection of Al3+ ion using two batches of PCA-DTC-Au NPs. ESI Fig. S11(a)† shows the UV-visible spectra of PCA-DTC-Au NPs in the presence of various concentrations of Al3+ ion obtained from the different batches. It can be observed that the aggregation of PCA-DTC-Au NPs in the presence of Al3+ ion resulted in a red-shift in SPR from 523 to 650 nm, yielding the color change from red to blue.
Based on the calibration graph, the LOD for Al3+ ion was found to be 44 nM, with a correlation coefficient value (R2) of 0.9929, which is very close to the LOD of the second batch (ESI Fig. S11(b)†). These results indicated that the absorption ratios (A660 nm/A523 nm) varied very slightly from batch to batch (±0.27), but these slight variations were not significant in terms of the quantification of Al3+ ion according to the WHO specification.
The potentiality of PCA-DTC-Au NPs for the detection of Al3+ ion was also compared with reported methods based on Au and Ag NP-based colorimetric assays (Table 1). The results suggest that the PCA-DTC-Au NP-based colorimetric probe gave a lower LOD than the reported Au- and Ag NP-assisted UV-visible spectroscopy.37–39,41,42 It was observed that the LOD of the present method for Al3+ ion detection was in no way comparable to that of triazole-ether-modified Au NPs, due to the availability of more binding sites on the surface of Au NPs.40
| NPs | Capping agent | Size (nm) | LOD (M) | Detection method | Ref. |
|---|---|---|---|---|---|
| Au NPs | Pentapeptide (CALNN) | 13 | 0.2 × 10⁻⁶ | UV-visible | 37 |
| Au NPs | Mononucleotide | 11.94 ± 0.74 | 0.46 × 10⁻⁶ | UV-visible | 38 |
| Ag NPs | Mononucleotide | 19.98 ± 1.73 | 0.09 × 10⁻⁶ | UV-visible | |
| Au NPs | Citrate | 17 | 1.0 × 10⁻⁶ | UV-visible | 39 |
| Au NPs | Triazole-ether | 3–7 | 18 × 10−9 | UV-visible | 40 |
| Au NPs | 5-Mercaptomethyltetrazole | 12 | 0.53 × 10⁻⁹ | UV-visible | 41 |
| Ag NPs | Glutathione | 10 | 0.16 × 10⁻⁶ | UV-visible | 42 |
| Au NPs | PCA-DTC-Au NPs | 13 | 38 × 10−9 | UV-visible | Present method |
3.7 Interference studies
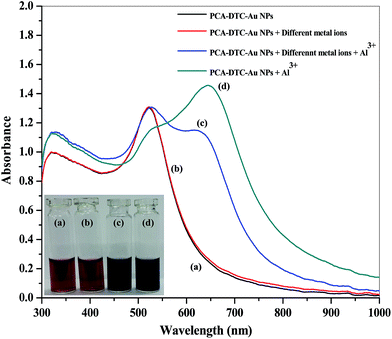
Interference by other metal ions was investigated in order to evaluate the selectivity of PCA-DTC-Au NPs towards Al3+ ion, by measuring the UV-visible spectra of PCA-DTC-Au NPs in the presence of mixtures of metal ions. A range of different metal ions (Cu2+, Co2+, Cd2+, Pb2+, Hg2+, Ni2+, Mn2+, Mg2+, Zn2+, Ba2+, Ca2+, Fe2+ and Fe3+) at 500 μM were added to PCA-DTC-Au NPs in the presence of Al3+ ion (100 μM). As shown in Fig. 6, the UV-visible spectra of PCA-DTC-Au NPs showed no significant change upon the addition of mixture of metal ions at this concentration. Moreover, the color of PCA-DTC-Au NPs remained ruby red, which confirmed that the other metal ions had not induced the aggregation of the PCA-DTC-Au NPs. In addition, the red-shift in the SPR peak of PCA-DTC-Au NPs was only observed after the addition of Al3+ ion (100 μM) to the mixture of metal ions, leading to the visual color change from red to blue. These results suggested that other metal ions were not interfering in the quantification of Al3+ ion in various environmental and biological samples using PCA-DTC-Au NPs as a colorimetric probe.3.8 Application of PCA-DTC-Au NPs to the detection of Al3+ ion in spiked water samples
In order to evaluate the practical applicability and accuracy of the proposed method, various environmental water samples (drinking, tap, canal and river water) were collected and spiked with different concentrations of Al3+ ion (1.0, 50 and 100 μM), and then analyzed by the aforesaid procedure. The percentage recovery and relative standard deviation (RSD) values were calculated by spiking with the different concentration of Al3+ ion in the water samples. The results are shown in Table 2. In the spiked samples of drinking, tap, canal and river water the percentage recovery values for Al3+ ion were 97.52–98.93%, with RSD values below 2.73%. It can therefore be concluded that PCA-DTC-Au NPs can be used as a specific colorimetric probe for the selective and sensitive detection of Al3+ ion in environmental samples, giving good precision and accuracy.| Samples | Added (μM) | Founda (μM) | Recoverya (%) | RSD (%) |
|---|---|---|---|---|
| a Mean ± standard deviation (n = 3). | ||||
| Drinking water | 1.0 | 0.98 ± 0.004 | 98.08 | 2.08 |
| 50 | 49.13 ± 0.010 | 98.25 | 1.73 | |
| 100 | 98.93 ± 0.009 | 98.93 | 1.03 | |
| Tap water | 1.0 | 0.98 ± 0.006 | 97.82 | 2.73 |
| 50 | 49.07 ± 0.007 | 98.14 | 1.20 | |
| 100 | 98.76 ± 0.010 | 98.76 | 1.19 | |
| Canal water | 1.0 | 0.97 ± 0.006 | 97.9 | 2.62 |
| 50 | 49.03 ± 0.014 | 98.05 | 2.28 | |
| 100 | 98.23 ± 0.018 | 98.23 | 2.10 | |
| River water | 1.0 | 0.97 ± 0.006 | 97.52 | 2.65 |
| 50 | 49.15 ± 0.010 | 98.31 | 1.62 | |
| 100 | 98.43 ± 0.009 | 98.43 | 1.06 | |
4. Conclusions
A rapid, cost-effective and selective PCA-DTC-Au NPs based colorimetric method has been developed for the quantification of Al3+ ion in environmental samples. Al3+ ion was shown to induce the aggregation of PCA-DTC-Au NPs due to the formation of a coordination complex between carboxylate and Al3+ ion, resulting in a visual color change from red to blue and a red-shift in the SPR peak from 523 to 660 nm. In addition, the Al3+-induced aggregation of PCA-DTC-Au NPs was confirmed by DLS and TEM. The absorption ratio (A660 nm/A523 nm) of PCA-DTC-Au NPs is directly proportional to the concentration of Al3+ ion. The sensing of Al3+ ion can be monitored by the naked eye and the detection limit was 38 nM. The use of a PCA-DTC-Au NP-based colorimetric probe thus offers a simplified procedure for the trace identification of Al3+ ion in a variety of environmental, industrial and biological samples.Acknowledgements
Our thanks are offered to the Director, SVNIT, for providing the facilities for conducting this study. We are also grateful to the Department of Science and Technology, India, for a UV-visible spectrophotometer under the Fast-track Young Scientist Program (SR/FT/CS-54/2010). We wish to thank Mr Vikas Patel, SICART, and Mr V.V. Nagar Anand for their assistance with the TEM data, and Mr Chetan Patel, Chemical Engineering Department, SVNIT, Surat, for the DLS measurements.References
- B. Timmer, W. Olthuis and A. A. van den Berg, Sens. Actuators, B, 2005, 107, 666–677 CrossRef CAS PubMed.
- D. W. Domaille, E. L. Que and C. J. Chang, Nat. Chem. Biol., 2008, 4, 168–175 CrossRef CAS PubMed.
- J. R. Walton, Encyclopedia of Environmental Health, 2011, 1, 331–342 Search PubMed.
- D. L. Godbold, E. Fritz and A. Huttermann, Proc. Natl. Acad. Sci. U. S. A., 1988, 85, 3888–3892 CrossRef CAS.
- J. M. Donald and M. S. Golub, Neurotoxicol. Teratol., 1989, 11, 341–351 CrossRef.
- S. V. Verstraeten, L. Aimo and P. I. Oteiza, Arch. Toxicol., 2008, 82, 789–802 CrossRef CAS PubMed.
- R. A. Yokel, Fundam. Appl. Toxicol., 1987, 9, 795–806 CrossRef CAS.
- G. Ciardelli and N. Ranieri, Water Res., 2001, 35, 567–572 CrossRef CAS.
- N. E. W. Alstad, B. M. Kjelsberg, L. A. Vollestad, E. Lydersen and A. B. S. Poleo, Environ. Pollut., 2005, 133, 333–342 CrossRef CAS PubMed.
- P. Nayak, Environ. Res., 2002, 89, 101–115 CrossRef CAS.
- J. L. Greger, Annu. Rev. Nutr., 1993, 13, 43–63 CrossRef CAS PubMed.
- J. R. Sorenson, I. R. Campbell, L. B. Tepper and R. D. Lingg, Environ. Health Perspect., 1974, 8, 3–95 CrossRef CAS.
- K. P. Kepp, Chem. Rev., 2012, 112, 5193–5239 CrossRef CAS PubMed.
- J. R. Walton, Neurotoxicology, 2006, 27, 385–394 CrossRef CAS PubMed.
- I. S. Parkinson, M. K. Ward and D. N. Kerr, J. Clin. Pathol., 1981, 34, 1285–1294 CrossRef CAS.
- P. D. Darbre, J. Inorg. Biochem., 2005, 99, 1912–1919 CrossRef CAS PubMed.
- S. C. Warren-Smith, S. Heng, H. Ebendorff-Heidepriem, A. D. Abell and T. M. Monro, Langmuir, 2011, 27, 5680–5685 CrossRef CAS PubMed.
- C. Meriño-Gergichevich, M. Alberdi, A. G. Ivanov and M. Reyes-Díaz, Soil Sci. Plant Nutr., 2010, 10, 217–243 Search PubMed.
- M. L. Mora, M. A. Alfaro, S. C. Jarvis, R. Demanet and P. Cartes, Soil Use Manage., 2006, 22, 95–101 CrossRef PubMed.
- J. Barcelo and C. Poschenrieder, Environ. Exp. Bot., 2002, 48, 75–92 CrossRef CAS.
- I. Narin, M. Tuzen and M. Soylak, Talanta, 2004, 63, 411–418 CrossRef CAS PubMed.
- B. Chen, Y. Zeng and B. Hu, Talanta, 2010, 81, 180–186 CrossRef CAS PubMed.
- L. J. Melnyk, J. N. Morgan, R. Fernando, E. D. Pellizzari and O. Akinbo, J. AOAC Int., 2003, 86, 439–447 CAS.
- B. Fairman, A. Sanz-Medel, P. Jones and E. H. Evans, Analyst, 1998, 123, 699–703 RSC.
- H. Wang, Z. Yu, Z. Wang, H. Hao, Y. Chen and P. Wan, Electroanalysis, 2011, 23, 1095–1099 CrossRef CAS PubMed.
- X. Shi, H. Wang, T. Han, X. Feng, B. Tong, J. Shi, J. Zhi and Y. Dong, J. Mater. Chem., 2012, 22, 19296–19302 RSC.
- S. Das, M. Dutta and D. Das, Anal. Methods, 2013, 5, 6262–6285 RSC.
- S. Goswami, S. Paul and A. Manna, RSC Adv., 2013, 3, 10639–10643 RSC.
- R. Patil, A. Moirangthem, R. Butcher, N. Singh, A. Basu, K. Tayade, U. Fegade, D. Hundiwale and A. Kuwar, Dalton Trans., 2014, 43, 2895–2899 RSC.
- P. Ding, J. Wang, J. Cheng, Y. Zhao and Y. Ye, New J. Chem., 2015, 39, 342–348 RSC.
- T. Han, X. Feng, B. Tong, J. Shi, L. Chen, J. Zhi and Y. Dong, Chem. Commun., 2012, 48, 416–418 RSC.
- D. T. Quang and J. S. Kim, Chem. Rev., 2010, 110, 6280–6301 CrossRef CAS PubMed.
- E. M. Nolan and S. J. Lippard, Chem. Rev., 2008, 108, 3443–3480 CrossRef CAS PubMed.
- K. Saha, S. S. Agasti, C. Kim, X. Li and V. M. Rotello, Chem. Rev., 2012, 112, 2739–2779 CrossRef CAS PubMed.
- Y. Li, H. J. Schluesener and S. Xu, Gold Bull., 2010, 43, 29–41 CrossRef CAS.
- M. C. Daniel and D. Astruc, Chem. Rev., 2004, 104, 293–346 CrossRef CAS PubMed.
- X. Li, J. Wang, L. Sun and Z. Wang, Chem. Commun., 2010, 46, 988–990 RSC.
- M. Zhang, Y. Q. Liu and B. C. Ye, Chem.–Eur. J., 2012, 18, 2507–2513 CrossRef CAS PubMed.
- S. Chen, Y. M. Fang, Q. Xiao, J. Li, S. B. Li, H. J. Chen, J. J. Sun and H. H. Yang, Analyst, 2012, 137, 2021–2023 RSC.
- Y. C. Chen, I. L. Lee, Y. M. Sung and S. P. Wu, Talanta, 2013, 117, 70–74 CrossRef CAS PubMed.
- D. Xue, H. Wang and Y. Zhang, Talanta, 2014, 119, 306–311 CrossRef CAS PubMed.
- N. Yang, Y. Gao, Y. Zhang, Z. Shen and A. Wu, Talanta, 2014, 122, 272–277 CrossRef CAS PubMed.
- R. Gunupuru, D. Maity, G. R. Bhadu, A. Chakraborty, D. Srivastava and P. Paul, J. Chem. Sci., 2014, 126, 627–635 CrossRef CAS PubMed.
- P. Morf, F. Raimondi, H. G. Nothofer, B. Schnyder, A. Yasuda, J. M. Wessels and T. A. Jung, Langmuir, 2006, 22, 658–663 CrossRef CAS PubMed.
- Y. Zhao, W. Perez-Segarra, Q. Shi and A. Wei, J. Am. Chem. Soc., 2005, 127, 7328–7329 CrossRef CAS PubMed.
- S. K. Kailasa and H. F. Wu, Analyst, 2012, 137, 1629–1638 RSC.
- J. V. Rohit and S. K. Kailasa, Anal. Methods, 2014, 6, 5934–5941 RSC.
- A. Pandya, K. V. Joshi, N. R. Modi and S. K. Menon, Sens. Actuators, B, 2012, 168, 54–61 CrossRef CAS PubMed.
- V. N. Mehta and S. K. Kailasa, RSC Adv., 2015, 5, 4245–4255 RSC.
- D. Maity, R. Gupta, R. Gunupuru, D. N. Srivastava and P. Paul, Sens. Actuators, B, 2014, 191, 757–764 CrossRef CAS PubMed.
- P. C. Lee and D. Meisel, J. Phys. Chem., 1982, 86, 3391–3395 CrossRef CAS.
- Y. H. Su, S. H. Chang, L. G. Teoh, W. H. Chu and S. L. Tu, J. Phys. Chem. C, 2009, 113, 3923–3928 CAS.
- B. Imene, Z. Cui, X. Zhang, B. Gan, Y. Yin, Y. Tian, H. Deng and H. Li, Sens. Actuators, B, 2014, 199, 161–167 CrossRef CAS PubMed.
- X. Shi, H. Wang, T. Han, X. Feng, B. Tong, J. Shi, J. Zhi and Y. Dong, J. Mater. Chem., 2012, 22, 19296–19302 RSC.
- S. Y. Lin, Y. T. Tsai, C. C. Chen, C. M. Lin and C. H. Chen, J. Phys. Chem. B, 2004, 108, 2134–2139 CrossRef CAS.
- D. Maity, A. Kumar, R. Gunupuru and P. Paul, Colloids Surf., A, 2014, 455, 122–128 CrossRef CAS PubMed.
- S. P. Huang, K. J. Franz, E. H. Arnold, J. Devenyi and R. H. Fish, Polyhedron, 1996, 15, 4241–4254 CrossRef CAS.
- S. K. Ghosh and T. Pal, Chem. Rev., 2007, 107, 4797–4862 CrossRef CAS PubMed.
- Y. Xue, H. Zhao, Z. Wu, X. Li, Y. He and Z. Yuan, Analyst, 2011, 136, 3725–3730 RSC.
Footnote |
| † Electronic supplementary information (ESI) available. See DOI: 10.1039/c5ra00003c |
| This journal is © The Royal Society of Chemistry 2015 |

