Efficient removal of Cd(II) and Cu(II) from aqueous solution by magnesium chloride-modified Lentinula edodes
Han Xie†
,
Qiqi Zhao†,
Zhiren Zhou,
Yumeng Wu,
Haochuan Wang and
Heng Xu
Key Laboratory of Bio-resources and Eco-environment (Ministry of Education), College of Life Sciences, Sichuan University, Chengdu, Sichuan 610064, China. E-mail: xuheng64@sina.com; Fax: +86 28 85418262; Tel: +86 28 85414644
First published on 23rd March 2015
Abstract
To enhance metal biosorption capacity, magnesium chloride-modified Lentinula edodes (MMLE) was prepared by treating L. edodes with a mixture of NaOH, ethanol and MgCl2. In this study, MMLE was successfully applied to remove Cd(II) and Cu(II) from aqueous solution with high biosorption capacities of 51.64 ± 0.65 and 59.03 ± 0.64 mg g−1, respectively, which were higher than many other biosorbents. After pretreatment, the surface of spent L. edodes changed significantly and exposed more metal binding sites. When the initial concentration of heavy metal was 50 mg L−1 and the biosorbent dosage was 5 g L−1, the maximum uptake of Cu(II) and Cd(II) by MMLE at pH 5.0 and 25 °C was more than one order of magnitude higher than that of raw biomass. The equilibrium biosorption data of Cd(II) and Cu(II) could be well described by the Langmuir isotherm model. The experimental data obtained from the biosorption process was successfully correlated with a pseudo-second-order kinetics model. The thermodynamic parameters determined indicated that the biosorption process was endothermic and spontaneous. Both physisorption and chemisorption were involved in the biosorption of Cd(II) and Cu(II) onto the surface of MMLE through electrostatic interaction, ion exchange and complex formation. After three biosorption–desorption cycles, the biosorption and recovery efficiency of heavy metals from real industrial wastewater reached about 90% and 80%, respectively. The results show that MMLE could be an effective alternative biosorbent for the removal of heavy metals from real industrial wastewater.
1. Introduction
Heavy metals from many industries, such as the fertilizer, mining, pesticide, battery and paper industries are being introduced to natural water.1,2 Unlike organic pollutants, heavy metals are non-biodegradable and can accumulate in living tissues leading to hazardous effects.3–5 Heavy metal ions, such as Cu(II) and Cd(II), usually present in industrial effluents pose a serious threat to human health.6,7 Cu(II) is an essential trace element for the human body, but excessive ingestion of Cu(II) can cause several physiological and health problems, or even death.8,9 According to the Environmental Protection Agency (EPA), exceeding 1.3 mg L−1 of Cu(II) in drinking water is unacceptable.8 In addition, many deadly effects from the toxicity of Cd(II) have been observed, including renal dysfunction, hypertension, hepatic injury and lung damage.10,11 The World Health Organization has recommended 0.003 mg L−1 as the maximum concentration of Cd(II) in drinking water.12 The removal of heavy metal ions from polluted water system is therefore extremely important for the health of living species.Conventional techniques applied for the removal of metals from wastewater include chemical precipitation, ion exchange, evaporation recovery, reverse osmosis, electro-dialysis and ultrafiltration.1,8,13 Nevertheless, the application of such processes is often limited because of their economic constraints, low efficiency and production of secondary sludge.2,14 Lower cost adsorbents for large-scale use in water treatment, such as activated carbon derived from waste tyre rubber,15 modified corn stalks16 and sugar beet tailing,17 are all emerging as attractive biomaterials for removing heavy metal ions from wastewater. The major reasons why biosorption is superior to other techniques are its low cost, high efficiency and the reusability of the biomaterial.1
Micro-fungi cell walls abound in functional groups that are capable of binding the metals by adsorption, ion exchange, micro-precipitation, complexation or chelation.18,19 As has previously been reported, many kinds of fungi, such as Agaricus macrosporus,20 Lactarius scrobiculatus,21 Neurospora crassa22 and Aspergillus niger23 have been successfully applied as biosorbents for the removal of heavy metals from aqueous solution. Lentinula edodes (L. edodes), one of the most common edible mushrooms in the world, is cheap and easy to obtain in China.4,24 Spent L. edodes is the waste from the mushroom product of L. edodes, has no commercial value and will be an environmental burden during its decay.25 The combination of lignin, hemicellulose, cellulose and chitin in this byproduct of L. edodes means that it contains many functional groups, which are conducive to the biosorption of heavy metals.3,26 It is, therefore, an eco-friendly and inexpensive source of readily available sorbent. Nevertheless, some organic substances might be released into aqueous solution if agricultural by-products or waste were directly applied as adsorbents.27 Surface modification by pretreatment of biomass could decrease the leaching of organic compounds and enhance the biosorption capacity of the biomass for metals.28
Treating the biomass with alkaline and organic solvents would remove lipids and proteins from the biomass surface and expose more metal binding sites.8 Our previous study proved that ammonium citrate-modified L. edodes could remove Pb(II) efficiently.28 Heat treatment could cause denaturation of proteins, thus generating more active sites for metal ions.29 In addition, alkaline-earth metals also have a strong influence on metal biosorption capacity. However, until now there have ben few reports on using magnesium chloride-modified biomass for heavy metal removal.
The aim of the present study was to study the feasibility of magnesium chloride-modified L. edodes (MMLE) as a novel biosorbent for the efficient removal of Cd(II) and Cu(II) from aqueous solution. The biosorption capacity of MMLE was determined by studying the equilibrium biosorption isotherms of Cd(II) and Cu(II) in batch experiments. Energy Dispersive Spectrometer (EDS), Scanning Electron Microscope (SEM) and Fourier Transform Infrared Spectrometry (FTIR) were employed to analyze the surface properties of MMLE. The effect of biomass dosage, pH, contact time, initial metal concentration and temperature on removal efficiency of Cd(II) and Cu(II) were investigated. The kinetic models and thermodynamic parameters related to the biosorption process in batch experiments were also studied. Five cycles of biosorption and desorption were conducted to test the reusability of MMLE. This work also used real industrial wastewater, in order to better simulate the possible future application of the biosorbent for removal of heavy metals in industrial processes.
2. Experimental section
2.1. Materials and chemicals
Fresh spent L. edodes, was obtained from a mushroom production base in the suburbs of Chengdu, Sichuan Province, China. It was rinsed repeatedly with deionized water, dried in an oven overnight at 50 °C, and then ground with a pulverizing mill (Joyoung, JYLC012) to obtain raw biomass.All the chemical reagents used in the present work were of analytical grade (Kelong Chemical Reagent Factory, Chengdu, China). Stock solutions of Cd(II) and Cu(II) were prepared separately as 1.0 g L−1 by dissolving Cd(NO3)2·4H2O and Cu(NO3)2·3H2O in deionized water, and then diluted to the proper concentration.
2.2. Preparation of MMLE
20 g of powdered raw biomass was agitated for 24 h in 400 mL of mixed solution (200 mL of ethanol, 100 mL of 0.5 mol L−1 NaOH and 100 mL of 1 mol L−1 MgCl2) at 150 rpm and 25 °C. The resulting biomass was then filtered from the solution, washed with deionized water several times until its pH was 7, and oven dried at 40 °C for 24 h. The treated biomass was then ground with a mortar and pestle. After being ground, the treated biomass was sieved through 100/200-mesh and used for the following experiments.2.3. Characterization of adsorbent
The main functional groups presented on the surface of raw and modified biomass were analyzed by FTIR (NEXUS-650, America). The dry fungus biomass (about 1 mg) was powered, encapsulated in 100 mg KBr and pressed into translucent disks. The spectra for both raw and modified biomass were collected in transmission and corrected for background spectra. The morphological surface features of raw and modified biomass were investigated by SEM (JSM-5900LV, Japan). The composition of modified biomass after adsorption of heavy metals was analyzed by EDS (Genesis Apollo X/XL, America) in conjunction with SEM.The pH at the point of zero charge (pHpzc) of the MMLE, at which the charge of the positive surface sites is equal to that of the negative ones, was measured by mass titration, as described in our previous study.30 The surface is positively charged when the pH of the solution is below pHpzc of MMLE, while the surface is negatively charged when the pH of the solution is above the pHpzc.
2.4. Batch adsorption studies
In order to investigate the factors that have a greater influence on the sorption process, all the batch experiments were conducted in 250 mL flasks with 100 mL of 50 mg L−1 Cd(II) or Cu(II) solution in a constant temperature incubator shaker (SUKUN, SKY-211B) at 150 rpm.The effect of pH (from 2.0 to 6.0, biosorbent dosage: 5 g L−1, contact time: 120 min, temperature: 25 °C), biosorbent dosage (from 1 g L−1 to 6 g L−1, contact time: 120 min, pH: 5.0, temperature: 25 °C) and contact time (from 5 min to 400 min, biomass dosage: 5 g L−1, pH: 5.0, temperature: 25 °C) on biosorption efficiency were studied by varying one parameter and keeping the others constant. After biosorption, the solution was filtered through nylon membrane filters (0.45 μm) and the concentration of Cd(II) and Cu(II) in the filtrate was determined by flame atomic adsorption spectrometry (AAS) (VARIAN, SpectrAA-220Fs). Moreover, a control group with no biomass in 100 mL Cd(II) or Cu(II) solution and a control group with only biosorbent in deionized water were run in parallel with the experiment groups, to assess if there was any adsorption on the conical flask walls or any leaching of Cd(II) and Cu(II) from the biosorbent.
The biosorption isotherms were investigated by varying the initial concentration of heavy metal ions from 20 to 600 mg L−1 at pH 5.0 with a known biosorbent dosage (5 g L−1) at three different temperatures, 15 °C, 25 °C and 35 °C.
For kinetic studies, experiments were carried out with 100 mL of 50 mg L−1 of Cd(II) or Cu(II) solution and a known biosorbent dosage (5 g L−1), maintained at a pH 5.0 and temperature of 25 °C at different time of 0–400 min. A certain amount of solution was withdrawn and filtered, and the concentration of Mg(II), Cd(II) and Cu(II) in the filtrate was analyzed by AAS at certain time intervals.
The biosorption efficiency and biosorption capacity (qe) of MMLE for Cd(II) and Cu(II) were calculated using the following eqn (1) and (2):
 | (1) |
 | (2) |
The pH of the metal solution was adjusted with HNO3 (0.1 mol L−1) or NaOH (0.1 mol L−1) at the beginning of the experiment and not controlled afterward and the pH value was determined using a pH meter (Model pHS-25).
2.5. Desorption and reusability tests
To determine the reusability of the biosorbent, desorption and regeneration experiments were also performed. The metal ion-loaded biosorbent was filtered and the concentration of metal in the filtrate was analyzed. The biosorbent (biosorbent dosage 5 g L−1) was then transferred to another 250 mL flask containing 100 mL of 0.1 mol L−1 HNO3 solution at 25 °C in a constant temperature incubator shaker with a speed of 150 rpm for 2 h. It was filtered again to obtain filtrate, and the amount of desorbed metal ions was measured. The biosorbent was washed with distilled water to remove the excess acid solution and reused for another biosorption cycle. These successive sorption–desorption cycles were carried out five times.To examine the reusability of MMLE, experiments using industrial effluents were performed in parallel with the repeated sorption–desorption process. The industrial effluent was obtained from a metal manufacturing factory in the suburbs of Chengdu, Sichuan, China. The physico-chemical characteristics of the industrial wastewater were analyzed according to the methods described in our previous study,31 and the concentration of heavy metal was measured by AAS. 100 mL industrial effluent was treated with MMLE under optimal batch experiment conditions.
2.6. Statistical analysis
All the experiments were performed in triplicate, and the data reported in this study refers to the average values of all three measurements. All statistical analysis was conducted using Social Sciences (SPSS) 19.0 software, and error bars denoting the standard deviation were supplied in figures wherever possible. Microsoft Excel 2007 was also applied for data processing, and the linear regression method was employed to examine the models’ parameters.3. Results and discussion
3.1. Characterization of raw and modified L. edodes
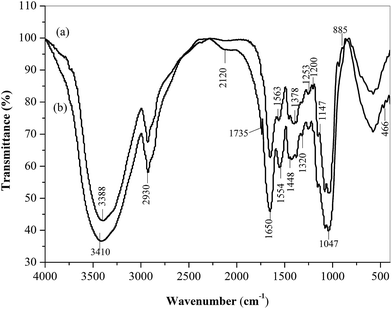
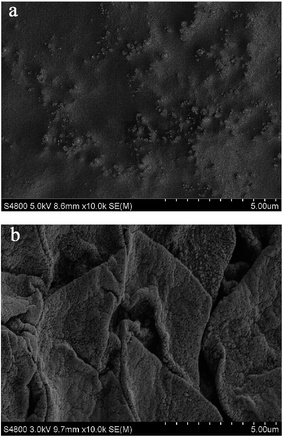
![[thin space (1/6-em)]](https://www.rsc.org/images/entities/char_2009.gif) 000×) were taken before and after pretreatment. The SEM micrographs of raw and modified biomass are shown in Fig. 2. The raw biomass was characterized by a rough and homogeneous surface (Fig. 2a). After modification, the presence of pores and cracks made the surface of MMLE more rough and irregular (Fig. 2b). The polarity of ethanol and the alkaline hydrolysis of starch, proteins and sugars occurring under alkaline conditions would destroy the cell wall structure of the biomass, and then make the surface of MMLE more porous and irregular.8 After being treated with generous amounts of Mg(II), the binding sites on the biomass surface would be activated by the interaction between organic functional groups and the magnesium ions, and then the formation of stable metal complexes results in more binding sites for the heavy metal ions. In addition, this may also contribute to the irregular structure in the morphology.
000×) were taken before and after pretreatment. The SEM micrographs of raw and modified biomass are shown in Fig. 2. The raw biomass was characterized by a rough and homogeneous surface (Fig. 2a). After modification, the presence of pores and cracks made the surface of MMLE more rough and irregular (Fig. 2b). The polarity of ethanol and the alkaline hydrolysis of starch, proteins and sugars occurring under alkaline conditions would destroy the cell wall structure of the biomass, and then make the surface of MMLE more porous and irregular.8 After being treated with generous amounts of Mg(II), the binding sites on the biomass surface would be activated by the interaction between organic functional groups and the magnesium ions, and then the formation of stable metal complexes results in more binding sites for the heavy metal ions. In addition, this may also contribute to the irregular structure in the morphology.
3.2. Effect of pH on metal biosorption
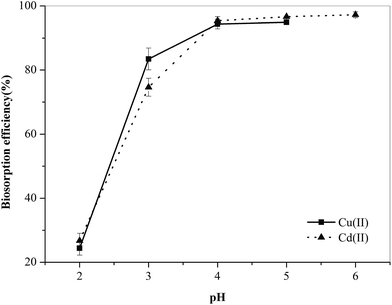
pH has been identified as one of the most important parameters that significantly influence the uptake of heavy metals. It has been reported that Cu(II) and Cd(II) precipitate in the forms of metal hydroxides when the pH values of their aqueous solutions exceed 5.3 and 8.3, respectively.33 To investigate the dependence of heavy metal biosorption efficiency on pH, experiments on the biosorption of Cu(II) and Cd(II) were conducted over pH ranges of 2.0–5.0 and 2.0–6.0, respectively. The pH could have an effect on the speciation and solubility of the metal ion(s) in solution and protonation of the functional groups at the biomass surface. As shown in Fig. 3, the biosorption efficiency of Cu(II) and Cd(II) increased as the pH rose from 2.0 to 5.0. In addition, the pHpzc value of MMLE in this study was found to be 5.32. At lower pH values, the biomass surface became more positively charged and the hydrogen ions could compete with metal ions for binding sites, leading to lower metal ions adsorption efficiency. However, the more negatively charged surface of the biomass at relatively higher pH values caused electrostatic interactions between metallic ions and active sites.34 In addition, the competing effect of hydrogen ions could decrease at high pH values,4,35 which was also conducive to higher biosorption efficiency. Ionic forms were the dominate species for Cu(II) and Cd(II) under acidic conditions. Moreover, the maximum biosorption for metal ions was achieved at pH 5.0. For these reasons, further adsorption experiments were performed at pH 5.0. The significant influence of pH on the biosorption of Cu(II) and Cd(II) by MMLE confirmed that both physisorption and chemisorption were involved in the biosorption process through electrostatic interactions and ion exchange.3.3. Effect of biosorbent dosage
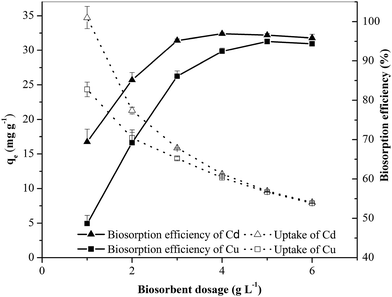
The dosage of MMLE is also an important factor, as it determines the number of active sites accessible to metal ions, and hence the uptake of heavy metals by MMLE for a given initial concentration of solution. As illustrated in Fig. 4, the uptake of heavy metal ions by MMLE dropped significantly with an increase in biosorbent dosage and the maximum uptake of heavy metal ions occurred at the biosorbent dosage of 1 g L−1. The ratio of metal to biosorbent decreased as the biosorbent dosage increased. Moreover, partial aggregation of biosorbent may occur at high biosorbent concentrations, which causes a decrease in the mean surface area of MMLE and then leads to a reduction in biosorption capacity.8 However, the removal efficiency of Cd(II) and Cu(II) increased as the dosage of biosorbent was increased over the range 1–5 g L−1. This result can be explained by the fact that the vacant adsorption sites for metal ions and ratio of biosorbent to metal increased with increasing biosorbent dosage.3 The resistance to mass transfer of heavy metal from bulk liquid to the surface of the solid became very important at high biosorbent dosage. The removal efficiency thus reached a saturation level at high biosorbent dosage and did not improve when the biomass content exceeded 5 g L−1. Similar results were also recorded by other researchers.26,36 Considering the fact that the difference in the removal efficiency of Cu(II) was 47.78% for the initial concentration of 50 mg L−1 when biosorbent dosage increased from 1 g L−1 to 5 g L−1, a biosorbent dosage of 5 g L−1 was used for further biosorption experiments.3.4. Effect of contact time
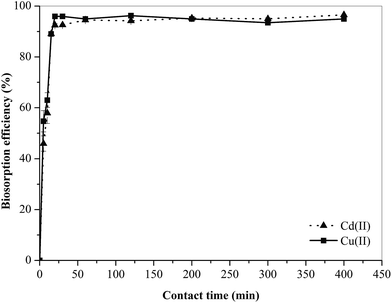
The dependence of removal efficiency of Cd(II) and Cu(II) by MMLE on contact time at an initial heavy metal concentration of 50 mg L−1 is shown in Fig. 5. The biosorption efficiency of Cd(II) and Cu(II) by MMLE rose rapidly in the initial stages and the biosorption rate then gradually slowed down with the progress of biosorption until an equilibrium was reached at approximately 120 min. At equilibrium, 96.25 ± 0.13% and 94.23 ± 0.28% of Cd(II) and Cu(II) were removed from aqueous solution by MMLE, respectively. The fast uptake in the initial stages can be attributed to the creation of more active sites on the surface of MMLE by treating the raw L. edodes with a mixture of NaOH, ethanol and MgCl2.20,35 Moreover, the organic compounds binding with metal ions at the cell walls might leach into solution resulting in desorption of metal.28 A time of 120 min was hence chosen as the optimal contact time for further biosorption experiments.3.5. Biosorption isotherms
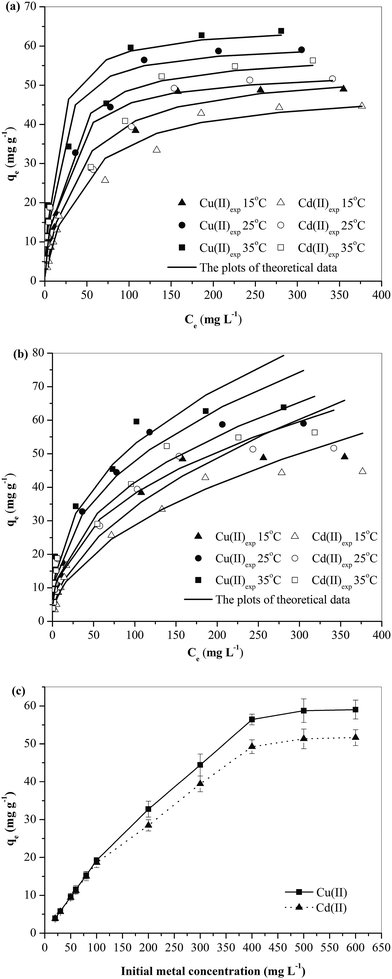
Two common isotherm models, the Langmuir model and the Freundlich model, were used in this study to explore the biosorption mechanism and predict the biosorption capacity of MMLE. The optimal operating conditions measured from the batch experiments for the three parameters were found to be: biosorbent dosage 5 g L−1, contact time 120 min and pH 5.0 for both Cd(II) and Cu(II). The experimental equilibrium data for the biosorption of Cd(II) and Cu(II) were obtained at optimal conditions and three different temperatures (15 °C, 25 °C and 35 °C). The biosorption isotherms of Cd(II) and Cu(II) on MMLE at different temperatures are presented in Fig. 6.The Langmuir isotherm model37 supposes that monolayer adsorption occurs at a homogeneous surface without interaction between the adsorbed molecules. The linear form of this model is expressed as eqn (3):
 | (3) |
The Freundlich isotherm model38 assumes that multilayer adsorption occurs at a heterogeneous surfaces with interaction between the adsorbed molecules. The linear form of model can be express by the following eqn (4):
 | (4) |
![[thin space (1/6-em)]](https://www.rsc.org/images/entities/char_2009.gif) qe versus ln
qe versus ln![[thin space (1/6-em)]](https://www.rsc.org/images/entities/char_2009.gif) Ce, respectively.
Ce, respectively.
The biosorption constants and correlation coefficients of the two isotherm models are listed in Table 1. The biosorption isotherm of Cd(II) and Cu(II) on MMLE was well described by Langmuir isotherm, as the R2 values (0.9826–0.9956) of the Langmuir model are higher than the R2 values (0.9424–0.9675) of the Freundlich model. This result can also be confirmed in Fig. 6. This means that the monolayer biosorption of Cd(II) and Cu(II) takes place on a homogeneous surface of MMLE. The value of 1/N calculated by the Freundlich model is lower than 1 at different temperatures, indicating the biosorption process is favorable.28 The biosorption capacity of Cd(II) and Cu(II) increased as the temperature increased from 15 °C to 35 °C, so the biosorption of Cd(II) and Cu(II) by MMLE is endothermic, which is in accordance with thermodynamics.
| Isotherm models | Parameters | 15 °C | 25 °C | 35 °C | |||
|---|---|---|---|---|---|---|---|
| Cu(II) | Cd(II) | Cu(II) | Cd(II) | Cu(II) | Cd(II) | ||
| a Notes: mean ± SD of three independent experiments. | |||||||
| Langmuir | qm (mg g−1) | 54.64 | 49.50 | 60.97 | 54.05 | 65.36 | 58.48 |
| b × 102 (L mg−1) | 27.68 | 24.13 | 77.69 | 52.04 | 86.98 | 50.32 | |
| R2 | 0.9956 | 0.9906 | 0.9928 | 0.9877 | 0.9910 | 0.9826 | |
| Freundlich | KF × 10−1 (mg1−1/n L1/n g−1) | 0.3153 | 0.2925 | 0.7605 | 0.5847 | 0.8699 | 0.6112 |
| 1/N (L mg−1) | 0.5178 | 0.4980 | 0.3998 | 0.4075 | 0.3920 | 0.4158 | |
| R2 | 0.9470 | 0.9479 | 0.9533 | 0.9424 | 0.9675 | 0.9441 | |
| qm(exp.) (mg g−1) | 49.03 ± 0.61 | 44.64 ± 0.50 | 59.03 ± 0.64 | 51.64 ± 0.65 | 63.83 ± 0.43 | 56.32 ± 0.81 | |
As shown in Fig. 6c, the uptake of Cu(II) and Cd(II) increased with an increase in the initial concentration of heavy metals. At low metal concentrations, despite high availability of various active sites of MMLE, the number of metal ions binding with the active sites on the surface of MMLE was lower than those binding at higher initial concentration of metal ion. The higher initial concentration of heavy metals could also drive the heavy metal to be adsorbed onto the surface of MMLE, and thus cause an increase in biosorption capacity of MMLE.4 The initial concentration of heavy metals therefore showed a strong influence on the biosorption capacity of MMLE for Cd(II) and Cu(II).
The uptake of Cd(II) and Cu(II) at 25 °C by MMLE are 51.64 ± 0.65 and 59.03 ± 0.64 mg g−1, respectively, which is superior to many biosorbents used in other studies (Table 2). When the initial concentration of heavy metal was 50 mg L−1 with a biosorbent dosage of 5 g L−1, the maximum uptake of Cu(II) and Cd(II) by raw biomass (L. edodes) at pH 5.0 and 25 °C was only 4.73 ± 0.22 and 3.38 ± 0.16 mg g−1, respectively. The quantity of Cu(II) and Cd(II) adsorbed on MMLE is more than one order of magnitude higher than that of raw biomass. The irregular and porous surface of MMLE contributed to an increase in the specific surface area, thus increased the biosorption capacity of the biosorbent. Furthermore, cleaning of the biomass surface by magnesium ions, which might be easily replaced with Cu(II) and Cd(II) ions during biosorption, was also conducive to an increase in biosorption capacity.39
| Metal | pH | Temperature (°C) | qm (mg g−1) | Biomass |
|---|---|---|---|---|
| a LE: L. edodes used in this study.b MMLE: magnesium chloride-modified L. edodes used in this study. | ||||
| Cu(II) | 5.0 | 25 | 4.73 | LEa |
| 5.0 | 25 | 15.27 | Modified orange peel40 | |
| 5.0 | 25 | 28.70 | Aspergillus niger (pretreated)51 | |
| 8.0 | 20 | 34.48 | Solanum lycopersicum13 | |
| 5.0 | 25 | 58.82 | Chlorella vulgaris algal cells52 | |
| 5.0 | 25 | 59.03 | MMLEb | |
| 6.0 | 25 | 248.15 | Phanerochaete chrysosporium53 | |
| Cd(II) | 5.0 | 25 | 3.38 | LEa |
| 6.0 | 25 | 6.45 | Immobilized L. edodes4 | |
| 6.0 | 21 | 2.08 | Agaricus bisporus54 | |
| 5.0 | 25 | 13.70 | Modified orange peel40 | |
| 5.0 | 25 | 51.64 | MMLEb | |
| 6.5 | 25 | 625.00 | Byproduct of L. edodes3 | |
| 6.95 | 25 | 833.33 | Spent mushroom compost26 | |
The electro-negativity of heavy metal ions can affect the biosorption ability of MMLE and a high electro-negative value would be conducive to metal ions being attracted onto the biomass surfaces.26,29 The electro-negative values of Mg(II), Cu(II) and Cd(II) are 1.31, 1.90 and 1.69, respectively. Cu(II) and Cd(II) hence have a higher affinity than Mg(II), and Mg(II) can be easily replaced by Cu(II) and Cd(II). In addition, the biosorption capacity for Cu(II) was higher than that for Cd(II), which confirmed that MMLE showed a high affinity to Cu(II). A similar result was also observed in a recent report on the biosorption of heavy metals using chemically modified orange peel.40
3.6. Biosorption thermodynamics
To determine whether the biosorption process is spontaneous or not, thermodynamic considerations were applied in this study. The Gibbs free energy change, ΔG°, is often considered as an indication of the spontaneity of a chemical reaction.41 The change in Gibbs free energy (ΔG°), enthalpy (ΔH°), entropy (ΔS°) can be calculated from the following eqn (5):13
ΔG° = −RT![[thin space (1/6-em)]](https://www.rsc.org/images/entities/char_2009.gif) ln ln![[thin space (1/6-em)]](https://www.rsc.org/images/entities/char_2009.gif) KD, ΔG° = ΔH° − TΔS°, ln KD, ΔG° = ΔH° − TΔS°, ln![[thin space (1/6-em)]](https://www.rsc.org/images/entities/char_2009.gif) KD = (ΔS°/R) − (ΔH°/RT) KD = (ΔS°/R) − (ΔH°/RT)
| (5) |
![[thin space (1/6-em)]](https://www.rsc.org/images/entities/char_2009.gif) KD versus 1/T.
KD versus 1/T.
The thermodynamic parameters for the biosorption of Cu(II) and Cd(II) by MMLE are summarized in Table 3. The positive values of enthalpy change reflect the endothermic nature of the biosorption process. This might be because Cu(II) and Cd(II) were completely solvated in water and thus breaking of the hydration sheath was required for them to achieve biosorption, and this ion dehydration process requires high energy. High temperature was therefore conducive to this dehydration process. In addition, Cu(II) and Cd(II) may be desolvated at higher temperature, which favors the biosorption of heavy metal ions. A similar observation and explanation were found during the removal of Cd(II) from solution by a novel adsorbent prepared from orange peel and Fe2O3 nanoparticles.11
| T (°C) | ΔG° (kJ mol−1) | ΔH° (kJ mol−1) | ΔS° (J K−1 mol−1) | |||
|---|---|---|---|---|---|---|
| Cd | Cu | Cd | Cu | Cd | Cu | |
| 15 | −8.93 | −8.59 | 9.93 | 25.76 | 65.44 | 119.22 |
| 25 | −9.58 | −9.79 | ||||
| 35 | −10.26 | −10.98 | ||||
The negative values of Gibbs free energy change (ΔG°) indicate that the biosorption of Cu(II) and Cd(II) by MMLE was feasible and spontaneous under the experimental conditions, and that MMLE showed a good affinity for the metal ions at 25 °C. Due to the increase in entropy during the biosorption process, the disorder at the biomass/solution interface would increase, thus increasing the mobility of Cu(II) and Cd(II) and demonstrating that MMLE is capable of removing metal ions from wastewater efficiently.42
3.7. Biosorption kinetics
To investigate the biosorption kinetic patterns of Cd(II) and Cu(II) on MMLE, three popular models were applied in this study. The linear forms of the pseudo-first-order model43 (eqn (6)), the pseudo-second-order model44 (eqn (7)) and intra-particle diffusion model45 (eqn (8)) can be described as follows:
ln(qe − qt) = ln![[thin space (1/6-em)]](https://www.rsc.org/images/entities/char_2009.gif) qe − k1t qe − k1t
| (6) |
 | (7) |
| qt = kidt1/2 + C | (8) |
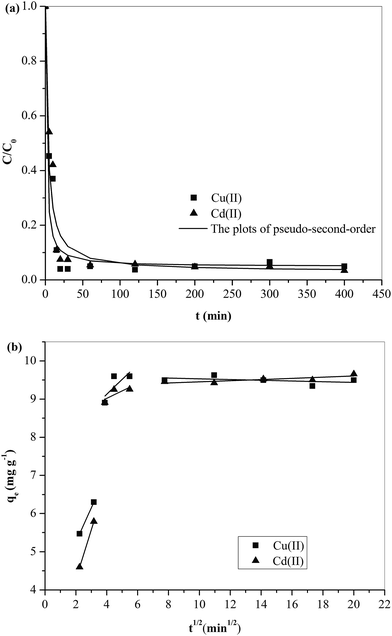
All the parameters of the three biosorption kinetic models are given in Table 4. The correlation coefficient values (R2) for the pseudo-first-order kinetic model were relatively lower compared with the pseudo-second-order kinetic model, and its theoretical values (qe1,cal) were significantly different from the experimental data. These results demonstrate that the biosorption system did not follow the pseudo-first-order kinetic model. However, the experimental values were close to the theoretical data calculated for the pseudo-second-order kinetic model (qe2,cal), suggesting that the pseudo-second-order kinetic model was suitable for characterizing the sorption of Cd(II) and Cu(II), which is confirmed by Fig. 7a. The pseudo-second-order kinetic model predicts that chemisorption may be the rate-limiting step for the biosorption process.46 Similar results have been reported by Bayramoğlu and Arıca.29
| Kinetic models | Parameters | Cu(II) | Cd(II) |
|---|---|---|---|
| a Notes: mean ± SD of three independent experiments. | |||
| Pseudo-first-order | qe(cal.) (mg g−1) | 1.17 | 1.64 |
| k1 (min−1) | 2.76 × 10⁻² | 2.34 × 10⁻² | |
| R2 | 0.323 | 0.666 | |
| Pseudo-second-order | qe(cal.) (mg g−1) | 9.51 | 9.69 |
| k2 (g mg−1 min−1) | 7.96 × 10⁻² | 3.29 × 10⁻² | |
| R2 | 0.999 | 0.999 | |
| Intra-particle diffusion | kid (mg g−1 min−1/2) | 3.86 × 10⁻¹ | 1.95 × 10⁻¹ |
| R2 | 0.616 | 0.634 | |
| C | 7.59 | 8.24 | |
| qe(exp.) (mg g−1) | 9.63 ± 0.13 | 9.43 ± 0.11 | |
The pseudo-second-order model is based on the assumption that the rate of metal uptake is proportional to the square of the unoccupied sites at the biomass surface.47 The dependence of biosorption on pH, biomass dosage and initial metal concentration agree well with this behavior. Consequently, the increased number of active sites for metal ions after pretreatment would be conducive to the removal of metal ions from aqueous solution by MMLE.
The intra-particle diffusion model was employed to identify the rate-controlling step of the biosorption process. Fig. 7b represents the relationship of qt and t1/2. The three separate linear regions of the biosorption of Cd(II) and Cu(II) onto MMLE suggest that there are multiple stages in the biosorption process. The biosorption begins by external mass transfer, which is then followed by intra-particle diffusion, and finally reaches the equilibrium plateau due to the lower concentration of heavy metal ions in solution.48 The same behavior was observed by Benaïssa and Elouchdi49 for the biosorption of Cu by drying bed activated sludge. The parameters of the second region are listed in Table 4. It was found that the straight lines of these three parts did not pass through the origin, suggesting that intra-particle diffusion is not the sole rate-controlling step, and that physisorption and chemisorption might also be involved in the biosorption process simultaneously by means of electrostatic interaction, ion exchange and complexation between metal ions and functional groups.50
In addition, the SEM image and EDS spectrum of MMLE after biosorption of Cd(II) and Cu(II) are shown in Fig. 8. Both the more irregular surface of MMLE after biosorption and the presence of Cd and Cu demonstrate that the Cd(II) and Cu(II) are successfully adsorbed onto the biomass surface. The content of Mg(II) (0.1 mM) desorbed from biomass surface to the solution is lower than that of Cd(II) (0.2 mM) and Cu(II) (4 mM) adsorbed onto the biomass surface, indicating that Cd(II) and Cu(II) may be adsorbed by MMLE through electrostatic interaction, ion exchange and metal complex formation.
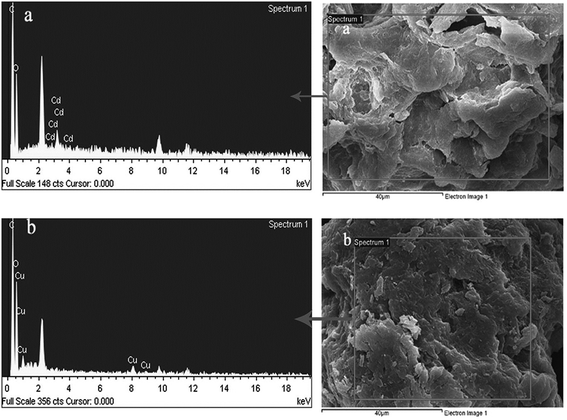 | ||
| Fig. 8 EDS diagrams of MMLE after the adsorption of Cd(II) (a) and Cu(II) (b) and SEM images corresponding to the samples depicted in the EDS diagrams. | ||
We thus predict that physisorption and chemisorption contribute significantly to the biosorption of metal ions onto the external surface of MMLE, while intra-particle diffusion might dominate the migration of heavy metal ions from the exterior to the interior of the biosorbent.
3.8. Desorption efficiency and reusability
The reusability of the biosorbent is also an important factor to consider in making the biosorption process more economical. It was found in a previous study that 0.1 mol L−1 HNO3 has little influence on the structure and metal sorption ability of biomass.31 Moreover, 98% of the adsorbed Cd(II) was desorbed from the adsorbent in the desorption experiments performed with Cd(II) loaded adsorbent in 0.1 mol L−1 HNO3.11 To investigate the reusability of MMLE, MMLE was subjected to consecutive cycles of biosorption and desorption. As illustrated in Table 5, this procedure was conducted five times and the biosorption capacity for Cd(II) and Cu(II) decreased with an increasing number of cycles of biosorption and desorption. The reduction of biosorption efficiency of MMLE can be explained by the fact that some of the heavy metal ions can react with the functional groups on the biomass and thus would be desorbed incompletely.26| Metal ions | Cycle | Initial metal (mg L−1) | Biosorption (%) | Desorption (%) |
|---|---|---|---|---|
| Cd(II) | 1 | 50 | 94.53 | 96.81 |
| 2 | 50 | 94.48 | 94.27 | |
| 3 | 50 | 92.74 | 93.83 | |
| 4 | 50 | 91.88 | 90.14 | |
| 5 | 50 | 90.19 | 87.03 | |
| Cu(II) | 1 | 50 | 96.25 | 95.98 |
| 2 | 50 | 95.68 | 93.16 | |
| 3 | 50 | 95.12 | 92.04 | |
| 4 | 50 | 93.68 | 90.87 | |
| 5 | 50 | 91.93 | 88.72 |
The characteristics and the contents of heavy metal ions in industrial effluent after consecutive cycles of sorption and desorption are presented in Table 6. In water samples from industrial effluent, biosorption and recovery efficiency (%) were approximately 90% and 80% in the first three cycles of biosorption and desorption, respectively. After further reaction cycles, the recovery efficiency of some metal ions decreased rapidly and was about 70% after five reaction cycles. Moreover, there were significant differences in the uptake of different metal ions. In this multi-metal system, Cu(II) could also be removed from wastewater more efficiently in comparison to Cd(II), and MMLE shown a higher affinity for Cu(II). This biosorption behavior is similar to that observed in single metal biosorption studies. MMLE showed good reusability in the batch experiments for treating industrial effluent containing heavy metals. The concentrations of Cu(II) and Zn(II) in effluent also decreased to lower than maximum permissible concentration regulated by the National Standards of PRC (GB 21900-2008), even after three cycles of biosorption and desorption. MMLE can therefore be employed for removing metal ions from wastewater.
| Quality parameter (mg L−1) | Initial effluent (mg L−1) | Amount after biosorption (mg L−1) | Amount desorbed with 0.1 M HNO3 (mg L−1) | Maximum permissible content (mg L−1) | ||||||||
|---|---|---|---|---|---|---|---|---|---|---|---|---|
| Cycle 1 | Cycle 2 | Cycle 3 | Cycle 4 | Cycle 5 | Cycle 1 | Cycle 2 | Cycle 3 | Cycle 4 | Cycle 5 | |||
| a Notes: COD, chemical oxygen demand; BOD, biological oxygen demand; ND, not detected. | ||||||||||||
| COD | 1052 | 342 | 358 | 379 | 382 | 417 | ND | ND | ND | ND | ND | 500 |
| BOD | 683 | 123 | 126 | 139 | 161 | 158 | ND | ND | ND | ND | ND | 300 |
| Phosphate | 1.34 | 0.84 | 0.88 | 0.80 | 0.92 | 1.04 | ND | ND | ND | ND | ND | 1.0 |
| Nitrate | 19.7 | 10.7 | 11.3 | 13.9 | 13.8 | 14.2 | ND | ND | ND | ND | ND | 20 |
| Pb(II) | 38.64 | 0.18 | 0.15 | 0.24 | 0.28 | 0.39 | 35.82 | 34.97 | 34.56 | 33.76 | 31.75 | 0.2 |
| Cd(II) | 3.01 | 0.04 | 0.08 | 0.09 | 0.11 | 0.14 | 2.79 | 2.68 | 2.62 | 2.52 | 2.35 | 0.05 |
| Cu(II) | 4.48 | 0.39 | 0.48 | 0.43 | 0.52 | 0.66 | 3.86 | 3.73 | 3.55 | 3.30 | 3.24 | 0.5 |
| Zn(II) | 35.58 | 1.29 | 1.23 | 1.36 | 1.54 | 1.53 | 31.60 | 30.86 | 30.11 | 27.95 | 27.58 | 1.5 |
4. Conclusions
In this study, MMLE prepared by treating L. edodes with a mixture of NaOH, ethanol and MgCl2, was successfully employed for the removal of Cd(II) and Cu(II) ions from aqueous solution. Its biosorption capacity was enhanced significantly compared to raw L. edodes. MMLE exhibited best performance in Cd(II) and Cu(II) uptake with a maximum biosorption capacity of 51.64 ± 0.65 and 59.03 ± 0.64 mg g−1, respectively. The biosorption capacity of MMLE for Cd(II) and Cu(II) increased with increasing pH of solution, initial metal concentration and temperature, but the biosorption capacity dropped off significantly with increasing biosorbent dosage. The monolayer biosorption of Cd(II) and Cu(II) occurs on the homogeneous surface of MMLE and this biosorption process is endothermic and spontaneous. The biosorption of metal ions onto the external surface of MMLE was dominated by physisorption and chemisorption, while intra-particle diffusion might be the main mechanism for the migration of heavy metal ions from the exterior to the interior of the biosorbent. MMLE showed good reusability in the batch experiments for treating industrial effluent containing heavy metals, especially for Cu(II) and Zn(II). These results confirm that MMLE, as a natural, abundant and low-cost biomass, is a promising biosorbent for the removal of heavy metal ions from industrial effluent.Acknowledgements
This study was financially supported by the Science and Technology Supportive Project of Sichuan Province, China (no. 2013SZ0062), Science and Technology Supportive Project of Chengdu (no. 12DXYB087JH-005) and NSFC (no. J1103518). The authors wish to thank Professor Guanglei Cheng and Dong Yu from the Sichuan University for their technical assistance.Notes and references
- D. Sud, G. Mahajan and M. P. Kaur, Bioresour. Technol., 2008, 99, 6017–6027 CrossRef CAS PubMed.
- T. A. H. Nguyen, H. H. Ngo, W. S. Guo, J. Zhang, S. Liang, Q. Y. Yue, Q. Li and T. V. Nguyen, Bioresour. Technol., 2013, 148, 574–585 CrossRef CAS PubMed.
- G. Chen, G. Zeng, L. Tang, C. Du, X. Jiang, G. Huang, H. Liu and G. Shen, Bioresour. Technol., 2008, 99, 7034–7040 CrossRef CAS PubMed.
- P. Ma and D. Zhang, Front. Environ. Sci. Eng., 2012, 6, 498–508 CrossRef CAS PubMed.
- V. K. Gupta and T. A. Saleh, Environ. Sci. Pollut. Res., 2013, 20, 2828–2843 CrossRef CAS PubMed.
- N. Feng, X. Guo, S. Liang, Y. Zhu and J. Liu, J. Hazard. Mater., 2011, 185, 49–54 CrossRef CAS PubMed.
- V. K. Gupta, S. Agarwal and T. A. Saleh, Water Res., 2011, 45, 2207–2212 CrossRef CAS PubMed.
- H. N. Bhatti, R. Khalid and M. A. Hanif, Chem. Eng. J., 2009, 148, 434–443 CrossRef CAS PubMed.
- F. Fu and Q. Wang, J. Environ. Manage., 2011, 92, 407–418 CrossRef CAS PubMed.
- T. G. Kazi, N. Jalbani, N. Kazi, M. K. Jamali, M. B. Arain, H. I. Afridi, A. Kandhro and Z. Pirzado, Renal Failure, 2008, 30, 737–745 CrossRef CAS PubMed.
- V. K. Gupta and A. Nayak, Chem. Eng. J., 2012, 180, 81–90 CrossRef CAS PubMed.
- W. H. Organization, Guidelines for drinking-water quality: First addendum to volume 1, Recommendations, World Health Organization, 2006 Search PubMed.
- A. Ş. Yargıç, R. Z. Yarbay Şahin, N. Özbay and E. Önal, J. Clean. Prod., 2015, 88, 152–159 CrossRef PubMed.
- S. S. Ahluwalia and D. Goyal, Eng. Life Sci., 2005, 5, 158–162 CrossRef CAS.
- T. A. Saleh and V. K. Gupta, Adv. Colloid Interface Sci., 2014, 211, 93–101 CrossRef CAS PubMed.
- S. Chen, Q. Yue, B. Gao, Q. Li and X. Xu, Chem. Eng. J., 2011, 168, 909–917 CrossRef CAS PubMed.
- X. Dong, L. Q. Ma and Y. Li, J. Hazard. Mater., 2011, 190, 909–915 CrossRef CAS PubMed.
- A. Chergui, R. Kerbachi and G.-A. Junter, Chem. Eng. J., 2009, 147, 150–160 CrossRef CAS PubMed.
- A. Kapoor and T. Viraraghavan, Bioresour. Technol., 1997, 61, 221–227 CrossRef CAS.
- M. Melgar, J. Alonso and M. García, Sci. Total Environ., 2007, 385, 12–19 CrossRef CAS PubMed.
- R. A. Anayurt, A. Sari and M. Tuzen, Chem. Eng. J., 2009, 151, 255–261 CrossRef CAS PubMed.
- I. Kiran, T. Akar and S. Tunali, Process Biochem., 2005, 40, 3550–3558 CrossRef CAS PubMed.
- M. Mukhopadhyay, Colloids Surf., A, 2008, 329, 95–99 CrossRef CAS PubMed.
- R. Chang, Nutr. Rev., 1996, 54, S91–S93 CrossRef CAS PubMed.
- H. Huang, G. Cheng, L. Chen, X. Zhu and H. Xu, Water, Air, Soil Pollut., 2009, 203, 53–63 CrossRef CAS.
- G.-q. Chen, G.-m. Zeng, X. Tu, G.-h. Huang and Y.-n. Chen, J. Environ. Sci., 2005, 17, 756–760 CAS.
- M. K. Mondal, J. Environ. Manage., 2009, 90, 3266–3271 CrossRef CAS PubMed.
- Y. Liu, Q. Zhao, G. Cheng and H. Xu, Chem. Eng. J., 2011, 173, 792–800 CrossRef CAS PubMed.
- G. Bayramoğlu and M. Y. Arıca, Chem. Eng. J., 2008, 143, 133–140 CrossRef PubMed.
- D.-Y. Lei, B. Li, Q. Wang, B. Wu, L. Ma and H. Xu, Desalin. Water Treat., 2014, 52, 1–12 CrossRef.
- Y. Long, D. Lei, J. Ni, Z. Ren, C. Chen and H. Xu, Bioresour. Technol., 2014, 152, 457–463 CrossRef CAS PubMed.
- G.-Q. Chen, G.-M. Zeng, X. Tu, C.-G. Niu, G.-H. Huang and W. Jiang, J. Hazard. Mater., 2006, 135, 249–255 CrossRef CAS PubMed.
- J. P. Chen and L. Yang, Ind. Eng. Chem. Res., 2005, 44, 9931–9942 CrossRef CAS.
- A. Stafiej and K. Pyrzynska, Sep. Purif. Technol., 2007, 58, 49–52 CrossRef CAS PubMed.
- V. K. Gupta, I. Ali, T. A. Saleh, M. Siddiqui and S. Agarwal, Environ. Sci. Pollut. Res., 2013, 20, 1261–1268 CrossRef CAS PubMed.
- V. K. Gupta, S. Agarwal and T. A. Saleh, J. Hazard. Mater., 2011, 185, 17–23 CrossRef CAS PubMed.
- I. Langmuir, J. Am. Chem. Soc., 1918, 40, 1361–1403 CrossRef CAS.
- H. Freundlich, Z. Phys. Chem., 1906, 40, 1361–1368 Search PubMed.
- D. Park, Y.-S. Yun and J. M. Park, Chemosphere, 2005, 60, 1356–1364 CrossRef CAS PubMed.
- M. R. Lasheen, N. S. Ammar and H. S. Ibrahim, Solid State Sci., 2012, 14, 202–210 CrossRef CAS PubMed.
- Y. Onal, C. Akmil-Basar and C. Sarici-Ozdemir, J. Hazard. Mater., 2007, 146, 194–203 CrossRef CAS PubMed.
- A. Hassan, A. Abdel-Mohsen and H. Elhadidy, Int. J. Biol. Macromol., 2014, 68, 125–130 CrossRef CAS PubMed.
- S. Lagergren, K. Sven. Vetenskapsakad. Handl., 1898, 24, 1–39 Search PubMed.
- Y.-S. Ho and G. McKay, Process Biochem., 1999, 34, 451–465 CrossRef CAS.
- W. Weber and J. Morris, J. Sanit. Eng. Div., Am. Soc. Civ. Eng., 1963, 89, 31–60 Search PubMed.
- L. Ma, Y. Peng, B. Wu, D. Lei and H. Xu, Chem. Eng. J., 2013, 225, 59–67 CrossRef CAS PubMed.
- H. N. Bhatti, R. Khalid and M. A. Hanif, Chem. Eng. J., 2009, 148, 434–443 CrossRef CAS PubMed.
- S. Yang, M. Gao and Z. Luo, Chem. Eng. J., 2014, 256, 39–50 CrossRef CAS PubMed.
- H. Benaïssa and M. Elouchdi, J. Hazard. Mater., 2011, 194, 69–78 CrossRef PubMed.
- Y.-r. Cao, Z. Liu, G.-l. Cheng, X.-b. Jing and H. Xu, Chem. Eng. J., 2010, 164, 183–195 CrossRef CAS PubMed.
- A. Y. Dursun, Biochem. Eng. J., 2006, 28, 187–195 CrossRef CAS PubMed.
- F. A. A. Al-Rub, M. H. El-Naas, I. Ashour and M. Al-Marzouqi, Process Biochem., 2006, 41, 457–464 CrossRef CAS PubMed.
- C. Sing and J. Yu, Water Res., 1998, 32, 2746–2752 CrossRef CAS.
- T. Mathialagan, T. Viraraghavan and D. R. Cullimore, Water Qual. Res. J. Can., 2003, 38, 499–514 CAS.
Footnote |
| † The first two authors contributed equally to this paper. |
| This journal is © The Royal Society of Chemistry 2015 |

