DOI:
10.1039/C4RA17319H
(Paper)
RSC Adv., 2015,
5, 25337-25347
Removal of Rhodamine B from wastewater by modified Volvariella volvacea: batch and column study
Received
31st December 2014
, Accepted 24th February 2015
First published on 24th February 2015
Abstract
This study investigated the biosorption of Rhodamine B (a carcinogenic dye) onto Volvariella volvacea in batch and bed column experiments. Hexadecyltrimethylammonium bromide-modified V. volvacea (HMV) showed the best performance in removing Rhodamine B, with a biosorption capacity of 33.51 mg g−1. Langmuir isotherm and pseudo-second order kinetic models described the experimental data obtained from the batch mode well. The initial concentration, flow rate, and bed height significantly influenced the dye removal in the continuous column process. Bohart–Adams, Thomas and Yoon–Nelson models were successfully fitted with breakthrough curves obtained under varying experimental conditions. The applicability of HMV was tested using simulated industrial wastewater, and the results confirmed that several dyes and other contaminants could be effectively removed by HMV. V. volvacea is an efficient and economical biosorbent for the removal of dye from wastewater.
1. Introduction
Many industries, such as the paper and pulp, cosmetics, paint and pigments, plastics, leather tanning and textile industries give rise to a large amount of coloured effluent and substantial quantity of cations and anions.1 According to statistics, 1 ton of dye production could generate about 744 tons of wastewater, and an average of about 20% dye lose in the process of dyeing and printing, half of which is discharged into the environment.2 Besides dyes, such effluents contain a great many other contaminants, for instance, acids or alkalis, salts, dissolved and suspended solids, and other compounds that are highly toxic.3 The dyes adsorb and reflect sunlight entering the water.4,5 The dye components are barely degraded by physical or chemical methods and degradation has become extremely difficult with the frequent replacement of textile dyes with modern dyes that are resistant to chemical, photochemical, and biological degradation.6 Rhodamine B (RB), a synthetically prepared carcinogenic xanthine dye is widely used in paper printing, pot-metal glass, textile dyeing, making fireworks and crackers, the leather and paint industries, and also for cell fluorescence staining in the laboratory.7 It brings about serious pollution and great damage when it is let out into the environment and consumed by human beings and animals. It eventually causes irritation to the skin, eyes and respiratory tract, because of its carcinogenicity, reproductive and developmental toxicity, neurotoxicity and chronic toxicity.8,9 Therefore, the treatment of dye-contaminated effluents is of significant environmental and commercial importance.10
A series of chemical, physical and biological measures for the removal of dyes from effluents have been developed, such as decolourisation, chemical coagulation, chemical oxidation, the electrolytic process, ion-exchange membrane separation, and aerobic or anaerobic microbial degradation.11 Among these removal technologies, adsorption is thought to be the most popular physicochemical method, due to its ease of operation and the comparatively low cost of its application. Low cost materials, such as brown macroalgae,12 straw,13 bentonites,14 clays15 and mushrooms,16 were reported to have been utilized as biosorbents for the efficient removal of dyes from aqueous solutions.
Adsorption columns with continuous flow operations are commonly used for gas and liquid pollution control.17 Thus, fixed-bed adsorption systems can be applied to deal with effluent and can create room for the treatment of large volumes of effluent fluid with a lesser requirement for monitoring; moreover, they are simple to operate and can be easily scaled up.18,19 A survey of the latest literature shows that diverse fungal organisms are capable of decolorizing a wide range of dyes and much work has been performed on species of fungi for the removal of different dyes from wastewater.20 The edible straw mushroom, Volvariella volvacea, is one of the most extensively cultivated mushrooms in China, ranking second or third in terms of annual edible mushroom industrial production worldwide.21 Furthermore, V. volvacea was first used to remove dyes in a fixed-bed column.
The objective of the present study is to research the potential of modified V. volvacea for RB removal in batch and continuous fixed-bed systems. The surface characterization of raw and hexadecyltrimethylammonium bromide-modified V. volvacea (HMV) was performed using Scanning Electron Microscopy (SEM) and Fourier Transform Infrared (FTIR) spectroscopy. The operational parameters, such as adsorbent dosage, pH, and initial concentration, were investigated. Adsorption isotherm models and kinetics models were studied in a batch experiment. The effects of initial dye concentration, flow rate, and bed height on the biosorption capacity were investigated in a fixed-bed column. Three models, the Bohart–Adams, Thomas, and Yoon–Nelson models, were applied to analyze the breakthrough curves. The applicability of the adsorbent for treating RB contaminated wastewater, in a fixed-bed column, was examined by using simulated industrial wastewater.
2. Materials and methods
2.1 Adsorbate
Rhodamine B (C.I. = 45![[thin space (1/6-em)]](https://www.rsc.org/images/entities/char_2009.gif) 170) was selected as the representative cationic dye. All reagents used in this study were of analytical grade and purchased from KeLong, Chemical Reagent Factory, Chengdu, China. A stock solution of RB (1000 mg L−1) was prepared by dissolving appropriate quantity of Rhodamine B in ultrapure water and the required initial concentrations (50, 100, 150 mg L−1) were obtained when needed by suitably diluting the stock solution with deionized water. Before mixing the adsorbent, the pH values were adjusted using HCl (0.1, 1 M) or NaOH (0.1, 1 M) and measured using a pH meter.
170) was selected as the representative cationic dye. All reagents used in this study were of analytical grade and purchased from KeLong, Chemical Reagent Factory, Chengdu, China. A stock solution of RB (1000 mg L−1) was prepared by dissolving appropriate quantity of Rhodamine B in ultrapure water and the required initial concentrations (50, 100, 150 mg L−1) were obtained when needed by suitably diluting the stock solution with deionized water. Before mixing the adsorbent, the pH values were adjusted using HCl (0.1, 1 M) or NaOH (0.1, 1 M) and measured using a pH meter.
Simulated industrial wastewater (SIW) containing various constituents was prepared in the laboratory, which were completely mixed with an appropriate amount of tap water. The SIW composition was as follows: Malachite green (MG, 50 mg L−1), RB (50 mg L−1), Neutral red (NR, 50 mg L−1), Crystal violet (CV, 50 mg L−1), NaH2PO4 (0.3 mmol L−1), NaCl (0.5 mmol L−1), NaSO4 (0.2 mmol L−1) and NaHCO3 (0.4 mmol L−1).
2.2 Adsorbent
Fresh V. volvacea was obtained from a nearby mushroom production site of Chengdu, China. It was then washed thoroughly with distilled water and dried at 323 ± 1 K for 3 days in an oven drier. The oven-dried sorbent was ground to a fine powder with a pulverizing mill (Joyoung, JYLC012), sieved to the desired mesh size (40–60 mesh) and then stored in a plastic bottle for further use.
2.3 Pretreatment of the adsorbent
2.3.1 Methylation of amines. The modification of amino functional groups was performed by shaking 1 g of the dried biomass in an Erlenmeyer flask containing 20 mL of pure formaldehyde (HCHO) and 40 mL of formic acid (HCOOH) for 12 h with an agitation speed of 145 rpm at 30 °C. This treatment resulted in the methylation of amines. The general scheme for this reaction is:| |
 | (1) |
After this reaction, the modified biomass was washed several times with ultrapure water and dried at 323 ± 1 K for 2 days.
2.3.2 Hexadecyltrimethylammonium bromide treatment. Hexadecyltrimethylammonium bromide (HDTMABr) (0.24 g) was dissolved in 50 mL deionized water and 1 g of powdered raw biosorbent was added and agitated with a magnetic stirrer for 12 h at 145 rpm. Following the mixing period, the resulting biomass was centrifuged at 3000 rpm for 5 min, washed, centrifuged, dried, ground, and sieved following the abovementioned methods for the later experiments.
2.3.3 Sodium chloride treatment. Fifty milliliters of 1000 mg L−1 NaCl was added to 1 g of crushed mealy biomass and the reaction mixture was shaken in a shaker incubator (SUKUN, SKY211B) for 12 h with an agitation speed of 145 rpm at 30 °C.
2.3.4 Sulfuric acid treatment. The modification experiment was carried out in a 150 mL stoppered three-neck round-bottom flask containing 50 mL of 0.05 M H2SO4 and 1 g of adsorbent. The flask was placed in a shaker and shaken at 145 rpm at 30 °C for 12 h.
2.4 Characterization of the adsorbent
The surface morphological features of the unprocessed and modified biosorbents were observed using Scanning Electron Microscopy (SEM) (JSM-5900LV, Japan). Fourier Transform Infrared (FTIR) spectroscopy (NEXUS-650, America) was used to analyse the predominant functional groups on the adsorbent surface. The pH at the point of zero charge (pHPZC) of the raw biomass, namely the pH value required to give zero net surface charge, was determined using mass titration.11
2.5 Batch experiments
A series of experiments were conducted in 250 mL Borosil conical flasks containing 50 mL of dye solution. A weighed amount of HDTMABr-modified V. volvacea (HMV) was added to the RB solutions. The mixtures were shaken using a constant temperature shaker (SUKUN, SKY-211B) at 145 rpm for 12 h. The effects of pH (2.0–6.0), contact time (0–330 min), initial dye concentration (50–250 mg L−1), sorbent dose (1–5 g L−1), and adsorption temperature (20, 30, 40 °C) were evaluated in order to find out the optimum conditions for dye biosorption. All adsorption experiments were conducted in duplicate, and control experiments were also performed without the addition of the adsorbent to confirm that the adsorption of the dye by the Erlenmeyer flasks was trivial. After biosorption, the supernatant of the dye solution was separated by centrifuge (Thermo) at 3000 rpm for 5 min, and then the filtrate was analyzed for the residual RB concentration using UV-vis spectroscopy at the maximum absorption wavelength (λmax = 553 nm) of RB.
2.6 Fixed-bed column studies
Fixed-bed biosorption studies were conducted to evaluate the dynamic behavior of RB removal on HMV in a glass column with an internal diameter of 1.5 cm and length of 10 cm. HMV with a designed height was packed in the glass column between two supporting layers of glass wool. A layer of glass beads was placed at the top to provide a consistent inlet flow.22 All column studies were performed by pumping dye solution in a down-flow mode using a constant flow pump at 30 °C and an optimum pH of 5. The impact of the HMV dosage (0.5, 1 and 1.5 g), flow rate (0.5, 2 and 3.5 mL min−1) and different initial RB concentrations (50, 100, 150 mg L−1) in the dye solutions on the biosorption process in a fixed-bed column was investigated at the same time.
2.7 Treatment of simulated industrial wastewater in a fixed-bed column
The applicability of the fixed-bed column in treating industrial wastewater was tested through simulating industrial wastewater. The simulated industrial wastewater adjusted to pH 5.0 was treated in the column packed with HMV at an optimum bed height and flow rate until the biosorbent was saturated. The treated samples collected from the exit were analyzed for the concentrations of Malachite green, Rhodamine B, Neutral red and Crystal violet.
2.8 Fixed-bed column biosorption process analysis
Several experimental parameters, which were calculated for the fixed-bed dye sorption process, are of critical importance in the continuous column. The fixed-bed capacity, qc (mg), is equal to the area under the plot from the integral of adsorbed concentrations expressed as Cad (Cad = C0 − Ct) mg L−1 for a given time t (min) and is calculated as follows:17| |
 | (2) |
where Q and A are the effluent flow rate (mL min−1) and the area under the breakthrough curve, respectively, and t is the total flow time (min).
The total dye removal (R%) can be calculated from the ratio of the fixed-bed capacity (qc) to the quantity of the dye sent to the column (m) as:
| |
 | (3) |
The equilibrium uptake, q, the weight of RB adsorbed per unit of dry adsorbent weight can be evaluated using:23,24
| |
 | (4) |
where
X (g) is the mass of the total biosorbent in the column.
2.9 Kinetic models of fixed-bed column adsorption
Three different models have been tested for the breakthrough curves in the present study: the Bohart–Adams, Thomas, and Yoon–Nelson models. The Bohart–Adams model, which is based on the surface reaction theory, is one of the most common equations used to describe the initial part of breakthrough curves.25 This model assumes that equilibrium is not instantaneous and that the isotherm is rectangular in shape. The Thomas model26 has frequently been applied to describe the column performance and predict the breakthrough curve of the sorption process in a packed bed reactor. Yoon–Nelson established a model to depict the breakthrough behavior of adsorbates on adsorbents, so the kinetic model stands on the precondition that the rate of decrease in the probability of the sorption of each adsorbate molecule is proportional to the probability of adsorbate.22 All the abovementioned kinetic models are represented in Table 1.
Table 1 Model equations used for the prediction of the breakthrough curve
| Model |
Equation |
Symbols representation |
| Bohart–Adams |
 |
Where Ct, C0, kBA, N0, v and Z are the effluent concentration, influent concentration, kinetic constant (L mg−1 h−1), saturation concentration (mg L−1), linear flow velocity (cm h−1) and bed height (cm), respectively. |
| Thomas |
 |
Where kT, q0 and F are the rate constant (L mg−1 h−1), adsorption capacity (mg g−1) and flow rate (L h−1), respectively. |
| Yoon–Nelson |
 |
Where kY is the rate constant (h−1) and τ is the time required for 50% adsorbate breakthrough (h). |
3. Results and discussion
3.1 Effect of modification
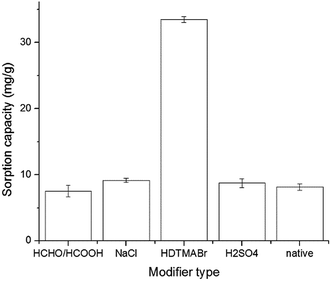
Both native and modified V. volvacea were used to remove hazardous pollutants from wastewater. Fig. 1 shows the uptake of RB by native and modified V. volvacea. The biosorption capacity of the native biosorbent for RB was 8.17 mg g−1 dry biomass. The sorption capacities of the acid, NaCl and HDTMABr pretreated biomass were increased about 1.07-, 1.12- and 4.1-fold compared to that of the control group, respectively; whereas a 1.08-fold decrease in the adsorption capacity of the formaldehyde and formic acid treated adsorbent was observed.
 |
| | Fig. 1 The effect of various modifiers on RB adsorption. | |
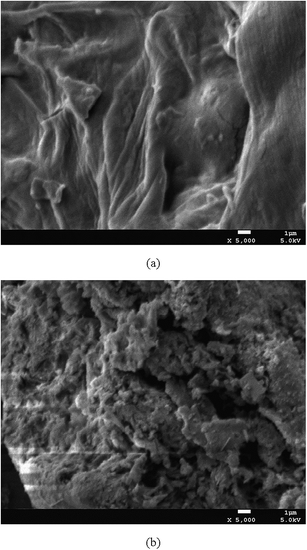
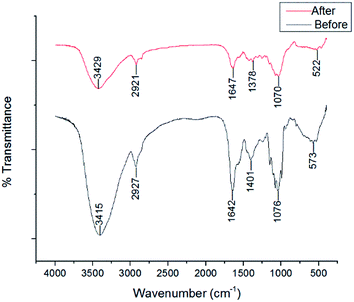
HDTMABr-modified V. volvacea (HMV) showed the best performance, with a biosorption capacity of 33.51 mg g−1. The surface of HMV was characterized by irregular and porous features after modification with HDTMABr (Fig. 2); moreover, the number of functional groups on the mushroom surface was increased via the denaturation or dissolution of biopolymers (Fig. 3), thus enhancing the biosorption capacity.14 The higher adsorption efficiency of NaCl-modified biomass could be due to the dissociation and the increased swelling of some components. For sulfuric acid, acid treatment changes the regular pattern of the adsorbent structure, which is accompanied by partial distortion, as H+ ions replace some of the exchangeable cations on the adsorbent surface.15 On the other hand, the formaldehyde and formic acid treated biomass showed the lowest biosorption capacity, against with the result of an increase in dye adsorption,12 which could account for the disadvantage of the methylation of amino functional groups bonded onto biomass surfaces.
 |
| | Fig. 2 The morphological structure of V. volvacea powder before (a) and after (b) modification. | |
 |
| | Fig. 3 The FTIR spectra of V. volvacea powder before and after modification. | |
3.2 Surface characterization of the adsorbent
The morphological structures of the raw and HDTMABr modified biosorbents presented in Fig. 2 revealed by SEM (at a magnification of 5000×) showed that the fungal biomass was characterized by an irregular and porous surface. The porous surface structure of the biosorbent should be the reason for an increase in its specific surface area. In addition, these irregularities and pores decrease the mass transfer resistance and facilitate the diffusion of dye molecules, thus enhancing the biosorption efficiency.16
The FTIR spectra of unmodified V. volvacea and HMV are shown in Fig. 3. The peak at 3429 cm−1 represents –NH stretching vibrations overlapping with those of –OH;27 the peak at 2921 cm−1 corresponds to stretching of the C–H bonds of the methyl and methylene groups;10 The peak at 1647 cm−1 represents –NH2 groups;22 The peaks at 1378 and 1070 cm−1 correspond to C–H bending (–CH3) and C–OH stretching vibrations, respectively.25 The band at 522 cm−1 represents C–N–C scissoring that is only found in protein structures.10
3.3 Effect of the biosorbent dose on the biosorption of RB
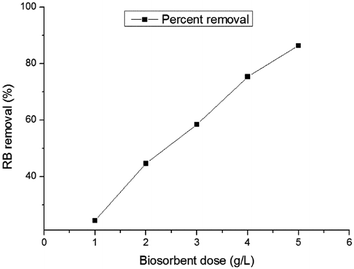
The effects of the adsorbent dose were tested by using different quantities of sorbent and these results are presented in Fig. 4. They show that the percentage biosorption yield increased with an increase in the adsorbent amount. At the equilibrium time of 5 h, the removal percentage increased from 24.47% to 86.33% when the biomass concentration was increased from 1 to 5 g L−1. The increase in RB removal with the biomass dose may be due to an increase in the surface area of the biosorbent and the availability of more possible biosorption sites. A similar observation was previously reported by other researchers.28 A further increase in the biomass concentration over 5 g L−1 did not bring about a significant improvement in biosorption at the adsorption equilibrium, due to the saturation of the adsorbent surface area with dye molecules. Therefore, the optimum biosorbent concentration was selected as 5 g L−1 for economic considerations.
 |
| | Fig. 4 Effect of the biosorbent dosage on the biosorption of RB on HMV (temperature = 30 °C, C0 = 100 mg L−1, shaking speed = 145 rpm). | |
3.4 Effect of the solution pH on RB biosorption
The effect of the initial solution pH on the percent removal of RB by HMV under equilibrium conditions was studied at six pH values between 2–8 for the initial dye concentration of 100 mg L−1 at 30 °C. As shown in Fig. 5, the adsorption percentage increased from 55.2 to 68.68%, when the initial solution pH increased from 2 to 5, and decreased from 68.68 to 41.87% in the pH range of 5 to 8. The optimum initial solution pH was 5.0 and it was used in the following studies.
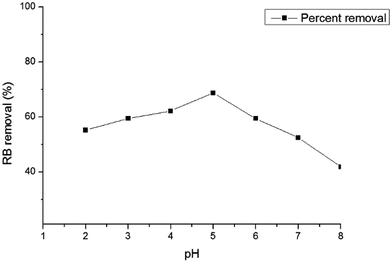 |
| | Fig. 5 Effect of solution pH on the biosorption of RB on HMV (temperature = 30 °C, C0 = 100 mg L−1, shaking speed = 145 rpm). | |
RB, an aromatic amino acid, changes its basicity or acidity with a change in pH. Below pH 4.2, the RB molecules are positively charged and the carboxylic group is neutral; while, at a higher pH, i.e. above 4.2, the RB has a net negative charge.3 In addition, the point of zero charge, pHPZC, of the adsorbent was around 6.28. When the solution pH was below the pHPZC, the surface of HMV was charged positively. On the other hand, when the pH was above the pHPZC, the surface was negatively charged.11 Therefore, when the pH was higher than 4.2 but below 6.28, the surface of HMV was positively charged, while the RB ions contained negative charges, hence the high electrostatic attraction led to higher RB biosorption.
3.5 Effect of contact time
The contact time was assessed as an important parameter affecting the adsorption capacity of an adsorbent. Fig. 6 presents the effect of contact time on the removal of RB dyes by HMV for various initial dye concentrations. The results showed that the adsorption capacity of the biosorbent at different initial concentrations increased rapidly at the beginning of the biosorption process and, thereafter, the adsorption rate decreased gradually, until after some time the biosorption reached equilibrium. The rapid adsorption of dye at the start may be attributed to the instantaneous utilization of the most readily available active sites on the surface of the biosorbent.29 After a period of contact time, the biosorption began to slow down due to the saturation of the available binding sites on the adsorbent surface.30 Furthermore, an increase in the initial dye concentration led to an increase in the biosorption uptake of dye, and so was the equilibrium time. This is because a higher initial concentration increased the number of collisions between dye molecules and the biosorbent and enhanced the driving force between the solution and solid phases.31
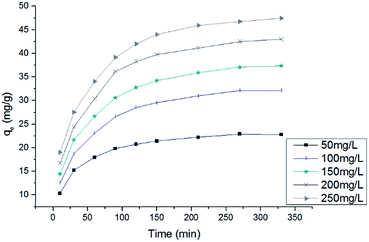 |
| | Fig. 6 Effect of the contact time on the biosorption of RB on HMV (temperature = 30 °C, C0: 50–250 mg L−1, shaking speed = 145 rpm). | |
3.6 Effect of the initial concentration on RB biosorption
Profiles for the RB uptake by HMV at different initial concentrations are shown in Fig. 7. The biosorption capacity of the modified adsorbent increased from 24.2 to 46.87 mg g−1 with increasing initial concentrations of dye in the biosorption medium, although the removal percentage decreased from 96.8 to 37.5%. The reduction in the removal percentage may be attributed to the abundant active sites on HMV, which outstripped the few molecules of adsorbate in low concentrations, and the limited active sites that were saturated with the superfluous adsorbate molecules at higher concentrations.32 The concentration difference provides the driving force required to conquer the resistance to the mass transfer of RB between the liquid phase and the solid phase, and thus greatly enhances the interactions between the dye molecules and biosorbent, which may account for the improvement in the adsorption capacity.13
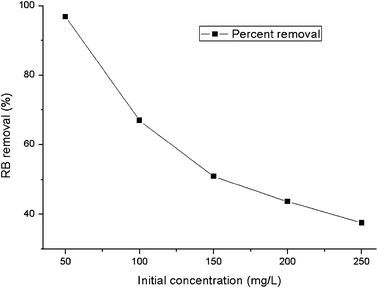 |
| | Fig. 7 The effect of the initial concentration on the biosorption of RB on HMV (temperature = 30 °C, shaking speed = 145 rpm). | |
3.7 Biosorption isotherms
Adsorption isotherms provide momentous information that reveals the equilibrium relationship between the adsorbate concentration in the liquid phase and the solid phase at a constant temperature. Three isotherm models, Langmuir, Freundlich and Temkin equations, were chosen to describe the equilibrium characteristics of this biosorption study (Table 2). The results are presented in Table 3 and isotherm plots for RB adsorption on HMV at 30 °C are shown in Fig. 8. As seen from Table 3, the regression coefficients (R2) of the Langmuir model were more than 0.99 under specific conditions, which were higher than the R2 values of the Freundlich model (0.9745–0.986) and Temkin model (0.9174–0.9295). Moreover, it can be seen from Fig. 8 that the experimental data fitted the Langmuir isotherm better than the other two isotherms. This indicates that the Langmuir model was more suitable for describing the process of sorption by HMV in the present study, indicating that the monolayer adsorption of RB occurred on a heterogeneous adsorbent surface. It can also be seen from Table 3 that the maximum monolayer biosorption capacity (qm) values of HMV for RB were 61.35 mg g−1, 68.49 mg g−1 and 94.34 mg g−1 at 20 °C, 30 °C and 40 °C, respectively. Moreover, the value of kL was in the range of 0–1, which confirms the favorable uptake of RB.
Table 2 Model equations of the adsorption isotherm studies
| Model |
Equation |
Symbols representation |
| Langmuir |
 |
Where qe and qm are the corresponding adsorption capacity and maximum adsorption capacity (mg g−1), respectively, Ce is the concentration of the RB solution at equilibrium (mg L−1), and kL is the Langmuir constant (L mg−1). |
| Freundlich |
 |
Where kF (L g−1) and n are the Freundlich constants that indicate the adsorption capacity and adsorption intensity, respectively. |
| Temkin |
qe = B![[thin space (1/6-em)]](https://www.rsc.org/images/entities/char_2009.gif) ln(ACe) ln(ACe) |
Where A is the Temkin isotherm energy constant (L g−1) and B is the Temkin constant. |
Table 3 Langmuir, Freundlich and Temkin isotherm model parameters for RB biosorption by HMV
| Isotherms |
Parameters |
293 K |
303 K |
313 K |
| Langmuir |
qm (mg g−1) |
61.35 |
68.49 |
94.34 |
| kL (L mg−1) |
0.00898 |
0.0118 |
0.00815 |
| R2 |
0.9978 |
0.9983 |
0.9907 |
| Freundlich |
kF (L g−1) |
0.862 |
1.226 |
1.132 |
| n |
0.785 |
0.744 |
0.796 |
| R2 |
0.9860 |
0.9781 |
0.9745 |
| Temkin |
A (L g−1) |
0.194 |
0.221 |
0.216 |
| B |
9.293 |
10.529 |
12.554 |
| R2 |
0.9295 |
0.9294 |
0.9174 |
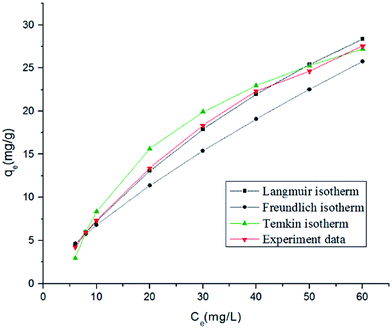 |
| | Fig. 8 Isotherm plots for RB adsorption on HMV at 30 °C. | |
3.8 Kinetics of RB biosorption on HMV
In order to investigate the mechanism and characteristics of the adsorption of RB dye onto HMV, two models (pseudo-first order and pseudo-second order) were used to test the experimental data.
The pseudo-first order equation is generally expressed as follows:33
| |
 | (5) |
The pseudo-second order equation based on adsorption equilibrium capacity could be represented as:29,34
| |
 | (6) |
where
qe and
qt (mg g
−1), are the amounts of dye adsorbed at equilibrium and at any time
t (min) per unit weight of adsorbent, respectively; while
k1 (min
−1) and
k2 (g mg
−1 min
−1), which are calculated from the slopes of log(
qe −
qt)
versus t and
 versus t
, are the rate constants of pseudo-first order and pseudo-second order adsorption (figure not shown), respectively.
The values of the parameters and R2 are shown in Table 4. With a higher R2 value, the pseudo-second order model was better fitted to the biosorption data than the pseudo-first order model. Moreover, its calculated adsorption capacity closely fitted the experimental data. Therefore, the present adsorption system follows a predominantly pseudo-second order kinetics model. A similar result for the treatment of dye effluent has also been reported in other work.35,36
Table 4 Kinetic model parameters for RB biosorption by HMV at 30 °C
| C0 (mg L−1) |
qe,exp (mg g−1) |
Pseudo-first order model |
Pseudo-second order model |
| k1 (min−1) |
qe1,cal (mg g−1) |
R2 |
k2 (g mg−1 min−1) |
qe2,cal (mg g−1) |
R2 |
| 50 |
24.20 |
0.0010 |
13.56 |
0.9745 |
0.0085 |
19.24 |
0.9999 |
| 100 |
33.51 |
0.0046 |
21.82 |
0.9741 |
0.0059 |
25.64 |
0.9999 |
| 150 |
38.17 |
0.0058 |
26.98 |
0.9392 |
0.0019 |
32.67 |
0.9993 |
| 200 |
43.61 |
0.0067 |
35.01 |
0.9856 |
0.00049 |
43.64 |
0.9922 |
| 250 |
46.87 |
0.0066 |
39.19 |
0.9903 |
0.00031 |
44.89 |
0.9992 |
3.9 Thermodynamics of biosorption
Thermodynamic parameters relating to the adsorption process, the free energy change (ΔG0, kJ mol−1), enthalpy change (ΔH0, kJ mol−1) and entropy change (ΔS0, kJ mol−1), were calculated using the following equations:| |
ΔG0 = −RT![[thin space (1/6-em)]](https://www.rsc.org/images/entities/char_2009.gif) ln ln![[thin space (1/6-em)]](https://www.rsc.org/images/entities/char_2009.gif) K0 K0
| (7) |
where R is the universal gas constant (8.314 J K−1 mol−1), T the absolute temperature (K) and K0 the distribution coefficient expressed as K0 = Ce(adsorbent)/Ce(solution). The values of the thermodynamic parameters are shown in Table 5. The values of the free energy change (ΔG0) were negative, indicating the feasibility and spontaneous nature of the adsorption process. The positive value of ΔS0 for HMV indicates the increased randomness at the solid/solution interface during the adsorption of RB onto the active sites of the biosorbent,34 suggesting the good affinity of the dye towards the adsorbent and that significant changes occur in the internal structure of the biosorbents due to the biosorption.10 Furthermore, the positive ΔH0 value confirmed that the biosorption of RB dye by HMV is an endothermic process.
Table 5 Thermodynamic properties of RB biosorption on HMV
| Biosorbent |
ΔH (kJ mol−1) |
ΔS (kJ mol−1) |
ΔG (kJ mol−1) |
| 293 K |
303 K |
313 K |
| HMV |
19.74 |
0.069 |
−0.46 |
−1.20 |
−1.84 |
3.10 Fixed-bed adsorption column study
3.10.1 Effect of the initial concentration. The effect of the concentration of the initial influent stream at 2 mL min−1, at a constant bed height of 4 cm, was evaluated at the concentrations of 50, 100 and 150 mg L−1. Table 6 summarizes the values of the experimental breakthrough parameters. The results are presented in Fig. 9. It can be seen from Table 6 that the breakthrough time and exhaustion time were inversely proportional to the influent RB dye concentration. In addition, at lower initial RB dye concentrations the breakthrough curves were lengthened, while at higher concentrations the shorter length of the breakthrough curves signifies a lesser dye solution treatment capability. This could be explained by the fact that, at the lower concentration, the smaller mass transfer caused the treatment of a higher volume of RB solution during the adsorption process.18 Moreover, the results demonstrated that the biosorption capacity increased with the solute concentration, with the concentrations of 50, 100 and 150 mg L−1 corresponding to biosorption capacities of 18.41, 21.42 and 28.09 mg g−1, respectively. This trend indicates that the higher influent concentration could saturate the biosorbent more quickly. A similar trend has been reported for the biosorption of Drimarine Black CL-B dye by using peanut husk.30
Table 6 Parameters obtained from the breakthrough curves of the fixed-bed column for RB adsorptiona
| F (mL min−1) |
H (cm) |
C0 (mg L−1) |
tb (min) |
qb (mg g−1) |
ts (min) |
qs (mg g−1) |
| Notation definitions: F, flow rate; H, bed height; tb and ts are the times at the breakthrough and saturation points, respectively; qb and qs are the adsorption capacities at the breakthrough and saturation times, respectively. |
| 2 |
4 |
100 |
54 |
8.08 |
160 |
21.39 |
| 2 |
4 |
50 |
85 |
8.08 |
282 |
18.27 |
| 2 |
4 |
150 |
40 |
11.83 |
145 |
27.94 |
| 2 |
2 |
100 |
11 |
3.61 |
106 |
23.86 |
| 2 |
6 |
100 |
72 |
7.98 |
175 |
16.93 |
| 3.5 |
4 |
100 |
31 |
5.80 |
160 |
19.15 |
| 0.5 |
4 |
100 |
83 |
16.15 |
195 |
27.87 |
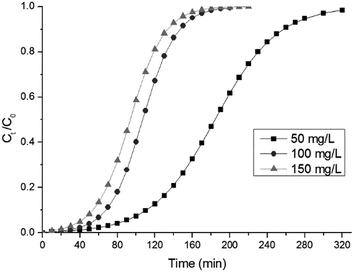 |
| | Fig. 9 The effect of the initial RB concentration on the breakthrough curves (flow rate: 2.0 mL min−1, bed height: 4.0 cm, pH 5). | |
3.10.2 Effect of the influent flow rate. Flow rate plays a significant role in the determination of the contact time of the adsorbate with the adsorbent in the continuous treatment of industrial wastewater. The effect of different flow rates (0.5, 2, 3.5 mL min−1) on the biosorption of RB dye in the column using HMV at a constant bed height (4 cm) and an inlet RB concentration of 100 mg L−1 was investigated. The breakthrough curves at varying flow rates, illustrated in Fig. 10, indicate that the saturation time and breakthrough time decrease significantly at higher flow rates. This might be due to the enhancement in the amount of dye adsorbed per unit bed height (mass transfer zone) at a higher flow rate, which causes a reduction in the time needed to saturate.37 In this study, the biosorption capacity of RB dye decreased with an increase in the flow rate of the influent stream; this might be due to the brief residence time of dye molecules in the column at a high flow rate, which prevents equilibrium from being reached.27
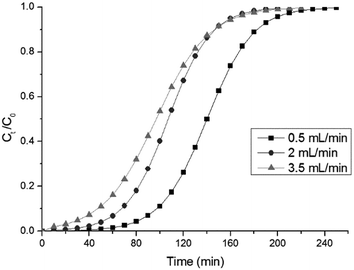 |
| | Fig. 10 The effect of the flow rate on the breakthrough curves (initial RB concentration: 100 mg L−1, bed height: 4.0 cm, pH 5). | |
3.10.3 Effect of the bed height. The effect of varying the height of the bed, filled with modified sorbent, from 2 to 6 cm was investigated at a constant flow rate and inlet RB concentrations of 2 mL min−1 and 100 mg L−1. The breakthrough profiles for RB biosorption at three different bed heights are presented in Fig. 11. It was found that the breakthrough times were 11, 54, and 72 min with bed heights of 2, 4 and 6 cm, and the complete bed exhaustion times were 106, 160, and 175 min, respectively. This may be explained by the increase in the amount of biosorbent in the column, which translates to an increase in the number of binding sites.38 In this study, the sorption capacity was slightly decreased with an increase in bed height. This result is in disagreement with the conclusions of other researchers, who found a positive correlation between the adsorption capacity and bed height.18 They attributed the improvement of the sorption capacity to the sufficient contact time between dye molecules and the available adsorbent. The volume of treated effluent increased at a higher bed height, because of the longer residence period that the additional biosorbent provided for the dye molecules.
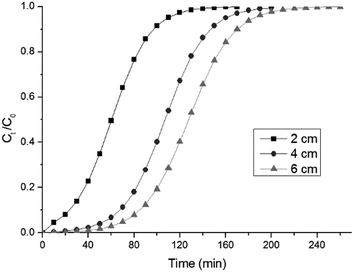 |
| | Fig. 11 The effect of the bed height on the breakthrough curves (flow rate: 2.0 mL min−1, initial RB concentration: 100 mg L−1, pH 5). | |
3.11 Modeling of the breakthrough curves
The Bohart–Adams adsorption model was used for the description of the initial part of the breakthrough curves for the RB biosorption, and the respective values of N0, and kBA were calculated and summarized in Table 7, coupled with the correlation coefficients (R2). The values of the correlation coefficients were found to be above 0.9738 under all conditions. It can be seen from the Table 7 that the saturation concentration (N0) of the fixed-bed increased with increasing initial RB concentration, but decreased with increasing bed height and flow rate. In addition, the value of the kinetic constant (kBA) decreased with increasing initial RB concentration and bed height; however, it increased with increasing flow rate. These results indicate that the overall system kinetics were dominated by external mass transfer in the initial part of the sorption process in the fixed-bed.39 Therefore, the bed height should be higher while the flow rate should be lower to achieve better saturation concentration (N0) and lower kinetic constant (kBA) values for the column.
Table 7 Bohart–Adams, Thomas and Yoon–Nelson model parameters of RB adsorption by the HMV-packed columna
| Conditions |
Bohart–Adams |
Thomas |
Yoon–Nelson |
| F |
H |
C0 |
kBA |
N0 |
R2 |
kT |
q0 |
R2 |
kY |
t |
R2 |
| Units: F: mL min−1; H: cm; C0: mg L−1; kBA: L mg−1 h−1; N0: mg L−1; kT: L mg−1 h−1; q0: mg g−1; kY: h−1; τ: h. |
| 2 |
4 |
100 |
0.0255 |
2573.56 |
0.9817 |
0.0334 |
21.42 |
0.9928 |
3.288 |
1.51 |
0.9928 |
| 2 |
4 |
50 |
0.0365 |
2217.06 |
0.9898 |
0.0361 |
18.41 |
0.9928 |
1.804 |
3.37 |
0.9928 |
| 2 |
4 |
150 |
0.0173 |
4518.29 |
0.9779 |
0.0221 |
28.09 |
0.9917 |
3.314 |
1.02 |
0.9917 |
| 2 |
2 |
100 |
0.0277 |
3743.38 |
0.9738 |
0.0361 |
24.12 |
0.9916 |
4.020 |
0.85 |
0.9916 |
| 2 |
6 |
100 |
0.0249 |
2573.56 |
0.9897 |
0.0311 |
17.01 |
0.9954 |
3.041 |
2.11 |
0.9954 |
| 3.5 |
4 |
100 |
0.0372 |
2762.03 |
0.9763 |
0.0469 |
19.35 |
0.9924 |
4.689 |
0.92 |
0.9924 |
| 0.5 |
4 |
100 |
0.0100 |
4099.32 |
0.9913 |
0.0078 |
28.00 |
0.9974 |
1.166 |
5.98 |
0.9974 |
The Thomas and Yoon–Nelson models were fitted quite well to the breakthrough curves (R2 > 0.9916) obtained from the adsorption of RB dye by the HMV-packed column under various experimental conditions. The Thomas rate constant, kT, was higher at a higher flow rate of dye solution passing through the column, with a shorter bed height and lower initial dye concentration. The maximum solid phase concentration (q0) increased significantly with an increase in the inlet RB dye concentration, and the opposite trend was seen in the cases of bed height and flow rate. Usually, the rate constant (kY) of the Yoon–Nelson model increases with an increase in the inlet dye concentration and a higher flow rate, yet it is reduced with an increase in bed height. However, the value of τ, the time required for 50% breakthrough, increased with an increase in bed height; and it decreased with an increase in both the inlet dye concentration and flow rate. A similar result was reported for the adsorption of Reactive Black by granular activated carbon.19
3.12 Applicability of the column in treating simulated industrial wastewater
Since the ultimate purpose of this dye adsorption technology is the removal of dye molecules from the effluents that often contain several dye molecules, anions and cations simultaneously, adsorption experiments were conducted with simulated industrial wastewater. The Thomas model was applied to analyze the experimental data of the dye removal from simulated industrial wastewater, and the values of characteristic parameters are listed in Table 8. The correlation coefficient (R2) values were found to be lower than that in the single solute system. The results showed that the removal of NR molecules from wastewater in the presence of other dye molecules (RB, CV, MG) in a multi-dye system would take precedence. Nonetheless, for the column packed with modified biosorbent treated with simulated industrial wastewater, the removal of each type of dye molecule was completely affected, the individual adsorption capacity (q0) of the bed was much lower than that with the single solution system, while the total adsorption capacity was 41.52 mg g−1, which was significantly increased. This may be explained by the presence of several active sites that selectively adsorbed other dye molecules once the adsorbent reached saturation of one kind of dye in the multi-dye system; as a result, the overall adsorption capacity is higher than that in the single-dye system. However, some researchers presented different results.18,40 The present study demonstrates that the HMV-packed column is capable of removing multiple dyes from industrial wastewater.
Table 8 Thomas model parameters for simulated industrial wastewater treatment by the HMV-packed column at a flow rate of 2 mL min−1
| Adsorbate |
kT (L mg−1 h−1) |
q0 (mg g−1) |
R2 |
| NR |
0.0900 |
11.65 |
0.9675 |
| CV |
0.0492 |
8.21 |
0.9758 |
| MG |
0.0647 |
10.29 |
0.9537 |
| RB |
0.0507 |
11.37 |
0.9878 |
4. Conclusions
HDTMABr modified V. volvacea was successfully prepared and showed the best performance in removing RB, with a biosorption capacity of 33.51 mg g−1. SEM and FTIR have been used to perform the surface characterization of V. volvacea. Biosorption activities were primarily on the monolayer surface with high adsorbate–adsorbent interaction, as exhibited by the isotherm model studies, which indicated that the Langmuir and Freundlich models fitted the experimental data the most closely. The RB adsorption performance of the column packed with HMV was found to be significantly dependent on the influent dye concentration, flow rate, and bed height. Bohart–Adams, Thomas and Yoon–Nelson models were applied to analyze the column experimental data, which successfully predicted the breakthrough curves acquired under different experimental conditions. V. volvacea could be used as an efficient and economical adsorbent for the removal of several dyes and some metal ions from industrial wastewater.
Acknowledgements
This study was financially supported by the Science and Technology Supportive Project of Sichuan Province, China (no. 2013SZ0062), Science and Technology Supportive Project of Chengdu (no. 12DXYB087JH-005) and NSFC (no. J1103518). The authors wish to thank Professor Guanglei Cheng and Dong Yu from Sichuan University for their technical assistance.
References
- J. Anandkumar and B. Mandal, Adsorption of chromium(VI) and Rhodamine B by surface modified tannery waste: kinetic, mechanistic and thermodynamic studies, J. Hazard. Mater., 2011, 186(2–3), 1088–1096 CrossRef CAS PubMed
 .
. - E. Y. Ozmen, S. Erdemir, M. Yilmaz and M. Bahadir, Removal of carcinogenic direct azo dyes from aqueous solutions using calix[n]arene derivatives, Clean: Soil, Air, Water, 2007, 35(6), 612–616 CrossRef CAS
 .
. - N. S. Maurya, A. K. Mittal, P. Cornel and E. Rother, Biosorption of dyes using dead macro fungi: effect of dye structure, ionic strength and pH, Bioresour. Technol., 2006, 97(3), 512–521 CrossRef CAS PubMed
 .
. - Y. Z. Fu and T. Viraraghavan, Dye biosorption sites in Aspergillus niger, Bioresour. Technol., 2002, 82(2), 139–145 CrossRef CAS
 .
. - T. O’Mahony, E. Guibal and J. M. Tobin, Reactive dye biosorption by Rhizopus arrhizus biomass, Enzyme Microb. Technol., 2002, 31(4), 456–463 CrossRef
 .
. - S. W. Won, S. B. Choi, B. W. Chung, D. Park, J. M. Park and Y. S. Yun, Biosorptive decolorization of reactive orange 16 using the waste biomass of Corynebacterium glutamicum, Ind. Eng. Chem. Res., 2004, 43(24), 7865–7869 CrossRef CAS
 .
. - S. K. Das, P. Ghosh, I. Ghosh and A. K. Guha, Adsorption of Rhodamine B on Rhizopus oryzae: role of functional groups and cell wall components, Colloids Surf., B, 2008, 65(1), 30–34 CrossRef CAS PubMed
 .
. - B. S. Inbaraj, J. T. Chien, G. H. Ho, J. Yang and B. H. Chen, Equilibrium and kinetic studies on sorption of basic dyes by a natural biopolymer poly(gamma-glutamic acid), Biochem. Eng. J., 2006, 31(3), 204–215 CrossRef CAS PubMed
 .
. - K. Kadirvelu, C. Karthika, N. Vennilamani and S. Pattabhi, Activated carbon from industrial solid waste as an adsorbent for the removal of Rhodamine-B from aqueous solution: kinetic and equilibrium studies, Chemosphere, 2005, 60(8), 1009–1017 CrossRef CAS PubMed
 .
. - S. T. Akar, A. Gorgulu, Z. Kaynak, B. Anilan and T. Akar, Biosorption of Reactive Blue 49 dye under batch and continuous mode using a mixed biosorbent of macro-fungus Agaricus bisporus and Thuja orientalis cones, Chem. Eng. J., 2009, 148(1), 26–34 CrossRef CAS PubMed
 .
. - D.-Y. Lei, B. Li, Q. Wang, B. Wu, L. Ma and H. Xu, Removal of Neutral red from aqueous solution using Pleurotus ostreatus nanoparticles by response surface methodology, Desalin. Water Treat., 2014, 1–12 CrossRef
 .
. - M. Kousha, E. Daneshvar, M. S. Sohrabi, M. Jokar and A. Bhatnagar, Adsorption of acid orange II dye by raw and chemically modified brown macroalga Stoechospermum marginatum, Chem. Eng. J., 2012, 192, 67–76 CrossRef CAS PubMed
 .
. - W. Zhang, H. Li, X. Kan, L. Dong, H. Yan and Z. Jiang, et al., Adsorption of anionic dyes from aqueous solutions using chemically modified straw, Bioresour. Technol., 2012, 117, 40–47 CrossRef CAS PubMed
 .
. - H. Koyuncu, N. Yildiz, U. Salgin, F. Koroglu and A. Calimli, Adsorption of o-, m- and p-nitrophenols onto organically modified bentonites, J. Hazard. Mater., 2011, 185(2–3), 1332–1339 CrossRef CAS PubMed
 .
. - G. K. Sarma, S. SenGupta and K. G. Bhattacharyya, Methylene Blue Adsorption on Natural and Modified Clays, Sep. Sci. Technol., 2011, 46(10), 1602–1614 CrossRef CAS
 .
. - M. Y. Arica and G. Bayramoglu, Biosorption of Reactive Red-120 dye from aqueous solution by native and modified fungus biomass preparations of Lentinus sajor-caju, J. Hazard. Mater., 2007, 149(2), 499–507 CrossRef CAS PubMed
 .
. - M. Auta and B. H. Hameed, Chitosan–clay composite as highly effective and low-cost adsorbent for batch and fixed-bed adsorption of methylene blue, Chem. Eng. J., 2014, 237, 352–361 CrossRef CAS PubMed
 .
. - A. Singh, D. Kumar and J. P. Gaur, Continuous metal removal
from solutionand industrial effluents using Spirogyra biomass-packed column reactor, Water Res., 2012, 46(3), 779–788 CrossRef CAS PubMed
 .
. - K. Yaghmaeian, G. Moussavi and A. Alahabadi, Removal of amoxicillin from contaminated water using NH4Cl-activated carbon: continuous flow fixed-bed adsorption and catalytic ozonation regeneration, Chem. Eng. J., 2014, 236, 538–544 CrossRef CAS PubMed
 .
. - T. A. Nguyen and R.-S. Juang, Treatment of waters and wastewaters containing sulfur dyes: a review, Chem. Eng. J., 2013, 219, 109–117 CrossRef CAS PubMed
 .
. - J. Wang, L. Guo, K. Zhang, Q. Wu and J. Lin, Highly efficient Agrobacterium-mediated transformation of Volvariella volvacea, Bioresour. Technol., 2008, 99(17), 8524–8527 CrossRef CAS PubMed
 .
. - Y. Long, D. Lei, J. Ni, Z. Ren, C. Chen and H. Xu, Packed bed column studies on lead(II) removal from industrial wastewater by modified Agaricus bisporus, Bioresour. Technol., 2014, 152, 457–463 CrossRef CAS PubMed
 .
. - Z. Aksu and F. Gönen, Biosorption of phenol by immobilized activated sludge in a continuous packed bed: prediction of breakthrough curves, Process Biochem., 2004, 39(5), 599–613 CrossRef CAS
 .
. - E. Malkoc, Y. Nuhoglu and Y. Abali, Cr(VI) adsorption by waste acorn of Quercus ithaburensis in fixed beds: prediction of breakthrough curves, Chem. Eng. J., 2006, 119(1), 61–68 CrossRef CAS PubMed
 .
. - C. Quintelas, R. Pereira, E. Kaplan and T. Tavares, Removal of Ni(II) from aqueous solutions by an Arthrobacter viscosus biofilm supported on zeolite: from laboratory to pilot scale, Bioresour. Technol., 2013, 142, 368–374 CrossRef CAS PubMed
 .
. - H. C. Thomas, Chromatography: a problem in kinetics, Ann. N. Y. Acad. Sci., 1948, 49(2), 161–182 CrossRef CAS PubMed
 .
. - D. Charumathi and N. Das, Packed bed column studies for the removal of synthetic dyes from textile wastewater using immobilised dead C. tropicalis, Desalination, 2012, 285, 22–30 CrossRef CAS PubMed
 .
. - X. L. Tian, C. Li, H. J. Yang, Z. X. Ye and H. Xu, Spent mushroom: a new low-cost adsorbent for removal of Congo red from aqueous solutions, Desalin. Water Treat., 2011, 27(1–3), 319–326 CrossRef CAS
 .
. - S. Dawood and T. K. Sen, Removal of anionic dye Congo red from aqueous solution by raw pine and acid-treated pine cone powder as adsorbent: equilibrium, thermodynamic, kinetics, mechanism and process design, Water Res., 2012, 46(6), 1933–1946 CrossRef CAS PubMed
 .
. - S. Sadaf and H. N. Bhatti, Evaluation of peanut husk as a novel, low cost biosorbent for the removal of Indosol Orange RSN dye from aqueous solutions: batch and fixed bed studies, Clean Technol. Environ. Policy, 2013, 16(3), 527–544 CrossRef
 .
. - L. Wang, J. Zhang, R. Zhao, C. Li, Y. Li and C. L. Zhang, Adsorption of basic dyes on activated carbon prepared from Polygonum orientale Linn: equilibrium, kinetic and thermodynamic studies, Desalination, 2010, 254(1–3), 68–74 CrossRef CAS PubMed
 .
. - L. Zhou, J. Jin, Z. Liu, X. Liang and C. Shang, Adsorption of acid dyes from aqueous solutions by the ethylenediamine-modified magnetic chitosan nanoparticles, J. Hazard. Mater., 2011, 185(2–3), 1045–1052 CrossRef CAS PubMed
 .
. - D. K. Mahmoud, M. A. M. Salleh, W. A. W. A. Karim, A. Idris and Z. Z. Abidin, Batch adsorption of basic dye using acid treated kenaf fibre char: equilibrium, kinetic and thermodynamic studies, Chem. Eng. J., 2012, 181–182, 449–457 CrossRef CAS PubMed
 .
. - V. K. Gupta, B. Gupta, A. Rastogi, S. Agarwal and A. Nayak, A comparative investigation on adsorption performances of mesoporous activated carbon prepared from waste rubber tire and activated carbon for a hazardous azo dye–Acid Blue 113, J. Hazard. Mater., 2011, 186(1), 891–901 CrossRef CAS PubMed
 .
. - S. Bouzid, A. Khenifi, K. A. Bennabou, R. Trujillano, M. A. Vicente and Z. Derriche, Removal of Orange II by Phosphonium-Modified Algerian Bentonites, Chem. Eng. Commun., 2015, 202(4), 520–533 CrossRef CAS
 .
. - M. F. Elkady, A. M. Ibrahim and M. M. Abd El-Latif, Assessment of the adsorption kinetics, equilibrium and thermodynamic for the potential removal of reactive red dye using eggshell biocomposite beads, Desalination, 2011, 278(1–3), 412–423 CrossRef CAS PubMed
 .
. - S. Noreen, H. N. Bhatti, S. Nausheen, S. Sadaf and M. Ashfaq, Batch and fixed bed adsorption study for the removal of Drimarine Black CL-B dye from aqueous solution using a lignocellulosic waste: a cost affective adsorbent, Ind. Crops Prod., 2013, 50, 568–579 CrossRef CAS PubMed
 .
. - M. L. G. Vieira, V. M. Esquerdo, L. R. Nobre, G. L. Dotto and L. A. A. Pinto, Glass beads coated with chitosan for the food azo dyes adsorption in a fixed bed column, J. Ind. Eng. Chem., 2014, 20(5), 3387–3393 CrossRef CAS PubMed
 .
. - M. S. Sajab, C. H. Chia, S. Zakaria and M. Sillanpää, Fixed-bed column studies for the removal of cationic and anionic dyes by chemically modified oil palm empty fruit bunch fibers: single- and multi-solute systems, Desalin. Water Treat., 2014, 1–8 CrossRef
 .
. - R. Vimala, D. Charumathi and N. Das, Packed bed column studies on Cd(II) removal from industrial wastewater by macrofungus Pleurotus platypus, Desalination, 2011, 275(1–3), 291–296 CrossRef CAS PubMed
 .
.
|
| This journal is © The Royal Society of Chemistry 2015 |
Click here to see how this site uses Cookies. View our privacy policy here. ![[thin space (1/6-em)]](https://www.rsc.org/images/entities/char_2009.gif) 170) was selected as the representative cationic dye. All reagents used in this study were of analytical grade and purchased from KeLong, Chemical Reagent Factory, Chengdu, China. A stock solution of RB (1000 mg L−1) was prepared by dissolving appropriate quantity of Rhodamine B in ultrapure water and the required initial concentrations (50, 100, 150 mg L−1) were obtained when needed by suitably diluting the stock solution with deionized water. Before mixing the adsorbent, the pH values were adjusted using HCl (0.1, 1 M) or NaOH (0.1, 1 M) and measured using a pH meter.
170) was selected as the representative cationic dye. All reagents used in this study were of analytical grade and purchased from KeLong, Chemical Reagent Factory, Chengdu, China. A stock solution of RB (1000 mg L−1) was prepared by dissolving appropriate quantity of Rhodamine B in ultrapure water and the required initial concentrations (50, 100, 150 mg L−1) were obtained when needed by suitably diluting the stock solution with deionized water. Before mixing the adsorbent, the pH values were adjusted using HCl (0.1, 1 M) or NaOH (0.1, 1 M) and measured using a pH meter.


 versus t, are the rate constants of pseudo-first order and pseudo-second order adsorption (figure not shown), respectively.
![[thin space (1/6-em)]](https://www.rsc.org/images/entities/char_2009.gif) ln
ln![[thin space (1/6-em)]](https://www.rsc.org/images/entities/char_2009.gif) K0
K0
.
.
.
.
.
.
.
.
.
.
.
.
.
.
.
.
.
.
.
.
.
.
.
.
.
.
.
.
.
.
.
.
.
.
.
.
.
.
.
.


