A novel approach to size separation of gold nanoparticles by capillary electrophoresis–evaporative light scattering detection

Mohamed Bouriab, Rachid Salghib, Manuel Algarrac, Mohammed Zougaghde and Angel Ríos*ad
aDepartment of Analytical Chemistry and Food Technology, University of Castilla–La Mancha, Av. Camilo José Cela 10, E-13004, Ciudad Real, Spain. E-mail: angel.rios@uclm.es
bLaboratoire d'Ingénieries des Procédés de l'Energie et de l'Environnement, ENSA, B.P. 1136, Agadir, Morocco
cDepartamento de Química Inorgánica, Facultad de Ciencias, Universidad de Málaga, Campus de Teatinos s/n, 29071 Málaga, Spain
dRegional Institute for Applied Chemistry Research, IRICA, Av. Camilo José Cela 10, E-13004, Ciudad Real, Spain
eCastilla-La Mancha Science and Technology Park, E-02006, Albacete, Spain

Received 17th January 2015 , Accepted 28th January 2015

First published on 28th January 2015


Abstract

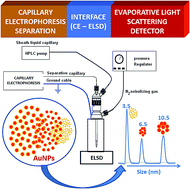
A simple and rapid methodology to separate and characterize gold nanoparticles (AuNPs) in aqueous medium by capillary electrophoresis–evaporative light scattering detection (CE–ELSD) is presented. First, a controlled synthesis procedure to obtain water-soluble AuNPs, by varying the trisodium citrate concentration was described. These free AuNPs were separated by capillary zone electrophoresis (CZE) based on the differences in the charge-to-mass ratio of the AuNPs–citrate in a mixed buffer of ammonium acetate (20 mM), containing tris(hydroxymethyl)-aminomethane (Tris, 20 mM) and 3-(cyclohexylamino)-1-propanesulfonic acid (CAPS; 10 mM) at pH 8.5. Under optimal working conditions, three small different-sized AuNPs were successfully separated whose average sizes were 3.5, 6.5 and 10.5 nm. The average diameter was lower than 1.2 nm for all of them (calculated by high-resolution transmission electron microscopy, TEM). Thus, this CE-based method was able to separate AuNPs that differ by only 3 nm in diameter. It can be a valuable methodology for the rapid and cost-effective characterization of other nanomaterials in the future in aqueous solutions.

1 Introduction

Nanoparticles (NPs) have a significant impact in science, medicine, and electronics. The physical and chemical properties of NPs are directly related to their intrinsic compositions, apparent sizes, and specific surface structures. Therefore, the design, synthesis, characterization, and applications of nanostructures are critical aspects for the emerging field of nanomaterials (NMs).1 The size characterization and/or separation of NPs are one of the important trend topics nowadays, as their physical and chemical properties depend on their sizes.2 In general, scientists rely almost exclusively on electron microscopy (EM)3 and dynamic light scattering (DLS),4 to characterize the size distributions of solution-grown NPs, such as gold NPs (AuNPs). Nevertheless, EM is an expensive and time-consuming technique, which does not involve any separation process, and DLS is often impractical and provides low signal-to-noise (S/N) ratios. Additionally, DLS cannot separate the contributions of the various NP sizes in the population from the total correlation function.5,6

In recent years, hyphenated techniques were also employed for this purpose. This is the case of inductively coupled plasma-mass spectrometry (ICP-MS),7 but this application field is still in its beginning regarding the common whole actual applications of ICP-MS.8 Field flow fractionation (FFF) have also been used for NPs separation coupled to ICP-MS as a detector.9 However, the separation power of this mild size-fractionating technique has been so far limited and, especially, NPs below 10 nm diameters might be not accessible.8

Chromatographic methods, such as size exclusion chromatography (SEC)10 have been proved its usefulness for characterizing the size of AuNPs. Although separation of AuNPs ranging, from 5 to 79 nm, has successfully been performed using SEC,10 it has generally been accompanied by irreversible adsorption of the particles onto the stationary phase.5 Despite of the referred methods for size separation and characterization, additional tools for specific applications are still required.6

Capillary electrophoresis (CE) is one of the most powerful current separation techniques, which has been progressed among a large group of high-resolution separation modes over the past two decades. In terms of simplicity, resolution, and economy, CE can outstrip to HPLC, because its ability to use small volumes of sample and reagents, low mass detection limits, and easy miniaturization.11 This technique is not only limited to the separation of small molecules, but it has been successfully employed to characterize nanometer sized spherical AuNPs, obtaining good results.2,3,5,12

Exploiting the whole advantages of this equipment in order to improve the ability of NPs separation and detection, our group recently designed a new system, consisting in a CE–ELSD customized coupling.13 Afterwards, it was successfully applied for the determination of amino acids in natural samples after a clean-up treatment by carbon nanotubes.14 This system is characterized by its simplicity and accessibility, because of the commercial availability of both equipments and the simple performing and handling of the customized interface. Thanks to its versatility and the quasi-universality, ELSD can be considered as a reliable, economic, and versatile mode of detection, and an attractive alternative to other CE detection systems (e.g., UV-Vis, fluorescence, electrochemical detection, or even MS detection), particularly those in which derivatization is needed. The basic principle of this detector is to create droplets thanks to the nebulizing gas and to evaporate them, obtaining suspended particles, which are posteriorly detected. The advantages of the coupled CE–ELSD system were also demonstrated through the separation of un-derivatized carbohydrates.13

In this work, it is presented the results on the use of CE–ELSD coupled system13 as an alternative and powerful tool for separation and characterization of AuNPs. The proposed approach is based on a prior preparation of different sizes of AuNPs followed by their CZE separation and detection by ELSD. To the best of our knowledge, is the first time of reporting the use of ELSD and CE in the separation and the detection of NPs.

2 Results and discussion

Characterization of synthesized AuNPs

It is well known that the appearance of the absorption spectrum can mirror the presence of different AuNPs.16 Absorbance measurements were made over the wavelength range 300–900 nm. Fig. 1 illustrates the spectra of AuNPs prepared under different conditions in the visible wavelength region.
image file: c4ra17217e-f1.tif
Fig. 1 Absorption spectra of synthesized AuNPs at different concentrations of citrate: (a) 5.8 mM, (b) 4.6 mM, and (c) 3.2 mM.

The characterized absorption band (520 nm) of the three sizes of AuNPs seems to be different, which appears to be logic due to the difference of absorbance surfaces of AuNPs and their solution color. Transmission electron microscopy (TEM) measurement was also performed on the prepared AuNPs, and at least 300 particles were randomly selected to characterize the size distribution of the AuNPs. Fig. 2 shows the TEM images and their corresponding size distribution of the prepared AuNPs. As it can be seen, the size of AuNPs decreased with increasing concentration of citrate from 3.2 to 5.8 mM, obtaining good quality of AuNPs, with average sizes of 10.5 ± 1.19, 6.5 ± 0.96 and 3.5 ± 0.73, respectively. The hydrodynamic diameters were measured in a Zetasizer Nano ZS instrument at the same increasing concentration orders. The corresponding values were 13.5 ± 0.02 nm, 8.6 ± 0.04 nm and 4.3 ± 0.03 nm, respectively. Their corresponding experimental zeta potential values (ζ) afforded negative charges of −29.18 ± 1.46 mV, −24.75 ± 3.61 mV, and −13.07 ± 1.01 mV, respectively.


image file: c4ra17217e-f2.tif
Fig. 2 TEM images and size distributions of AuNPs with average diameters of (A) 10.5 ± 1.19 nm, at 3.2 mM citrate concentration; (B) 6.5 ± 0.96 nm, at 4.6 mM citrate concentration and (C) 3.5 ± 0.73 nm, at 5.8 mM citrate concentration.

Separation and detection performance

AuNPs are commonly capped with a stabilizing and protective capping agent that prevents them from getting in contact with each other. The one commonly used is citrate, which acts as a capping agent imparting a negative charge to AuNPs, which in turn repulses adjacent NPs through mutual electrostatic repulsion and prevents them from agglomerating. This occurs as a result of the negative surface charge of the citrate layer.17,18 In order to achieve size separation of AuNPs with appropriate resolution, the influence of several parameters was investigated in order to identify the key variables that affect sensitivity and separation efficiency of CE–ELSD. For this purpose, a mixture of 3.5, 6.5 and 10.5 nm of AuNPs was used.

Separation of AuNPs

In the literature, most of reported works dealing with CE separation of AuNPs, used additives such as micelle-forming surfactants (e.g. sodium dodecyl sulfate, SDS) to achieve good separation.2 Based on the reported works of AuNPs separation by CE, the most common used buffers in capillary separation were a mixture of SDS and CAPS,2,19 Tris12 or a mixture of Tris and NH4Ac.20 The same conditions reported in these works were tested for the CE–ELSD method. Firstly, in this case the use of micelles as a covering layer to enhance separation efficiency was not possible because the generation an important noise in ELSD detector, and hence negatively affecting to the resolution. The effect of different buffers on the separation of three studied sizes of AuNPs was studied. On the other hand, a mixture of 20 mM Tris and NH4Ac at pH 8 was used in the running electrolyte (Fig. 3a), and the results shown that a better separation performance, between two of the three different sizes of NPs took place by adding the CAPS, to NH4Ac and Tris buffer (Fig. 3b).
image file: c4ra17217e-f3.tif
Fig. 3 Electropherograms of three different sizes of AuNPs by the proposed CE–ELSD method using (a) 20 mM Tris and NH4Ac as buffer at pH 8; (b) 20 mM Tris, NH4Ac and 10 mM CAPs as buffer at pH 8. Other CE–ELSD conditions are detailed in Table 1.

This fact can be explained because the increase of the ionic strength by adding a slightly strong electrolyte, producing a remarkably decrease the electrostatic repulsion, as well as the thickness of the electrical double layer of colloidal NPs. As a result, the balance of electrostatic repulsive potential and the van der Waals attractive potential is broken and the AuNPs could reach a close distance in which assembly becomes more favorable. Holding the negative charge on their surface promotes the repulsion to the wall of the capillary, and hence, prevents their interaction or adsorption. As discussed above, the high size of AuNPs hold much higher assembly potential than that of the lower size,16 which promotes the separation between both sizes. The separation of AuNPs can be attributed to the charge-to-mass ratio. Due to the negatively charge of AuNPs, the small AuNPs is moving upstream against the EOF, and the other size is moving at higher velocity upstream against the EOF because of their highly charged surface, which explain the time of retention order between the big and the small AuNPs, thus eluting behind the other. The mixture NH4Ac, Tris and CAPS was used to study the influence produced by the buffer concentration and the pH value have on the separation of AuNPs.

The effect of pH on the EOF in the running electrolyte and, therefore, on electrophoretic migration and resolution of the three different sizes was studied. The pH was varied between 8.0 and 11.0 using the mixture as the running electrolyte solution at 20 mM ionic strength. AuNPs migrated to the cathode, from the small size to the big size; increasing migration times (see Fig. 4a–c).


image file: c4ra17217e-f4.tif
Fig. 4 Electropherograms of AuNPs by the proposed CE–ELSD method (a) AuNPs with average diameter of 3.5 ± 0.73 nm; (b) AuNPs with average diameter of 6.5 ± 0.96 nm; (c) AuNPs with average of diameter 10.5 ± 1.19 nm; and (d) three separated AuNPs sizes. CE–ELSD conditions are detailed in Table 1.

From the pH-dependence of the apparent mobility of the studied AuNPs, a pH value of 8.5 resulted as the optimum for the separation. This pH produced a good resolution for the separation of AuNPs at 3.5 and 6.5 nm sizes, whereas the peak corresponding to the 10.5 nm AuNPs was not totally resolved. The effect of the concentration of CAPS, NH4Ac and Tris on the separation was examined in the range of 5–50 mM in order to improve the resolution of the three peaks, by fixing constant the concentration of two compounds at 20 mM and varying third one. The concentration of Tris showed a limited effect on the separation efficiency. As the concentration of NH4Ac decreased in the range of 20–100 mM, the resolution of the two AuNPs species increased, but the migration time and electric current also decreased. When the concentration of NH4Ac decreased to 5 mM, the separation efficiency was reduced. Regarding to CAPS, when the concentration was increased above 5 mM, the resolution and separation efficiency decrease, but when the concentration value exceeded 10 mM, the separation efficiency was reduced. Then, better resolution and low baseline noise were obtained when a mixture 20 mM NH4Ac–Tris and 10 mM of CAPS buffer at pH 8.5 was used (Fig. 4d).

The applied voltage for the separation was another important factor. Attempt was made to optimize the separation by using different applied voltages, ranging from 10 to 30 kV under the optimum conditions previously reported. The separation voltage directly determines the migration time, and it affects to the resolution. The migration time decreased when voltage increased. Based on the experiments, 10 kV was selected as the optimum voltage to accomplish a good compromise between the migration time and the separation efficiency. Probably due to Joule effect and the heating of the capillary, not very reproducible results were obtained at a higher potential than 10 kV. Moreover, capillary temperature was also set at 20 °C and a good separation of AuNPs was performed. Hydrodynamic injection was chosen because it gives more reproducible results than electrokinetic injection.14 Time and pressure of injection were also optimized. A range from 5 to 200 s was tested and it was observed that sensitivity increased with increasing time of injection. However, more than 100 s resulted in no separation. Consequently, 100 s of injection time was selected as the optimum value. Moreover, injection pressure was studied by ranging from 2.94 to 4.9 kPa. Better sensitivities were obtained for all the AuNPs, when 4.9 kPa was selected as the injection pressure value.

Detection conditions

The choice of parameters affecting to the sheath liquids was also an important factor for the appropriate work of the CE–ELSD interface. Three kinds of volatile salts (5 mM of each) of formic acid, ammonium formate, and ammonium acetate, were dissolved in 50% (v/v) methanol–water, respectively, and each sheath liquid was investigated. When a 5 mM ammonium acetate solution was used, the highest sensitivities were obtained for the different AuNPs sizes. Therefore, this solution was selected as the volatile salt in the sheath liquid. The effect of flow rate of the selected sheath liquid was investigated over the range 4–10 μL min−1. To avoid dilution problems in the CE–ELSD interface, and then to enhance sensitivity, the possibility of decreasing the flow rate of the sheath liquid was studied. However, flow rates lower than 5 μL min−1 resulted in current instability and increasing the peak widths, that negatively affected the separation. Based on these experiments, a 10 μL min−1 value was selected as sheath liquid flow rate, in order to accomplish a good rely between sensitivity and the separation efficiency. The final results indicates that 5 mM ammonium acetate in 50% (v/v) methanol–water at 10 μL min−1 flow rate was the optimum conditions of the sheath liquid used for AuNPs analysis by CE–ELSD.

For the ELSD, under fixed electrophoretic conditions, nebulizing gas flow rate (pressure) and evaporating temperature are the major instrumental available adjustments for maximizing detector response efficiency. In conventional ELSD system coupled to capillary liquid chromatography, ca. 350 kPa is a gas pressure that could be used while still enabling proper nebulizer operation. When used with CE no peak resolutions were obtained, and hence it was necessary to optimize the nebulizer pressure. Nebulizer pressure, ranged between 0.69 to 6.89 kPa, was tested in term of resolution and sensitivity. A nebulizer pressure value of 2.07 kPa was chosen as a compromise between sensitivity and peak resolutions for the AuNPs.

According to the theories of nebulization and light scattering, the intensity of light-scattering mainly depends on the size of the particle in the drift tube that passes through the detector and this depends on the size of the aerosol formed in the nebulization process.13,14 Very high temperatures decrease the signal of the analytes because smaller particles could enter to the detector. Temperatures ranging from 50 °C to 80 °C were tested by comparing peak area values. A drift tube temperature at 65 °C was selected as optimal due to a complete evaporation and an acceptable baseline noise. Moreover, photomultiplier gain of the ELSD was also tested in a range from 1 to 12. Separation of analytes was not affected by varying the gain, but signal of all analytes increased as photomultiplier gain value was higher. Thus, photomultiplier gain was set at a value of 9. Under established optimal conditions, standard mixture of AuNPs was injected into the CE–ELSD system.

3 Experimental

Chemicals and materials

All chemicals were of analytical reagent grade and water from a Milli-Q purification system (Millipore, Bedford, MA, USA) was used in all cases. Hydrogen tetrachloroaurate tetrahydrate (HAuCl4 4H2O, 99%), tri-sodium citrate dehydrate (C6H5Na3O72H20; ≥99%), ammonium acetate (NH4Ac), tris-(hydroxymethyl)-aminomethane (Tris) and 3-(cyclohexylamino)-1-propanesulfonic acid (CAPS) were supplied from (Sigma Aldrich, Spain). Sodium hydroxide was obtained from Panreac (Barcelona, Spain).

Instrumentation

UV-Vis spectra were obtained on a Secoman UVI Light XS 2 spectrophotometer equipped with a LabPower V3-50 for absorbance data acquisition. Optical measurements were performed using 10 mm quartz cell at room temperature. Transmission electron microscopic (TEM) characterization was performed on a Tecnai G2 F20 (Philips, Holland) at 200 kV. The samples for TEM were obtained by drying sample droplets from water dispersion onto a 300-mesh Cu grid coated with a lacey carbon film, which was then allowed to dry prior to imaging. The size and zeta potential (ζ) of CDs were determined using a Zetasizer Nano ZS (Malvern Instruments, U.K.) equipped with a 4 mW HeNe laser operating at λ = 633 nm. Size measurements were recorded with dynamic light scattering (DLS), at 25 °C in a polystyrene cell (ZEN0040) at a scattering angle of 173 °C and were average of three tests. The ζ measurements were also performed at 25 °C in polycarbonate folded capillary cells, incorporated with gold plated electrodes (DTS1061) and deionized H2O was the dispersion medium. Both, size and ζ were automatically obtained by the software, using the Stokes–Einstein and the Henry equation, involving the Smoluchowski approximation. Electrophoretic analyses were performed on an Agilent Model G1600AX (Palo Alto, CA, USA) CE instrument equipped with a diode array detector. The make-up flow of sheath liquid was delivered by an Agilent 1100 isocratic pump, which was operated at a 1[thin space (1/6-em)]:[thin space (1/6-em)]100 split ratio. The uncoated fused silica capillaries used were supplied by Beckman (Fullerton, CA). An Agilent 1200 Series evaporative light-scattering detector equipped with a new interface described below and additional pressure regulator (0.5–10 psi) (Ingenieria Analítica, Spain) for coupling CE instrument was used. CE–ELSD Instrument was configured and controlled by using a Rev.B.04.01-481 of 3D-CE/MSD ChemStation software version (Agilent Technologies).

Synthesis of AuNPs

All the glassware used in the procedures were soaked and cleaned in a bath of freshly prepared aqua regia, rinsed thoroughly in pure water, and dried in air prior to use. Citrate-capped AuNPs, with average size of 10.5 ± 1.19 nm, were synthesized following the modified method pioneered by Turkevich et al.15 in which a 50 mL solution containing 1 mM of HAuCl4 was prepared and heated under reflux. At the boiling point, 5 mL of 35 mM trisodium citrate was added to the this solution under vigorous stirring and the mixture was heated under reflux for an additional 30 min, during which the color of the solution changed to deep red indicating the formation of gold nanoparticles. The solution was set aside to cool to room temperature and stored at 4 °C for further utilization. To prepare the AuNPs with diameters of 6.5 ± 0.96 and 3.5 ± 0.73, 7.5 and 10 mL of 35 mM trisodium citrate were used, respectively.

Description of CE–ELSD interface and the experimental conditions

CE–ELSD interface was described in a previous work by our group,13 where the coupling of commercially available CE and ELSD equipments was reported for the first time. The developed interface is based on a triple-tube design sprayer, which achieves the closing of the electrical circuit for the electrophoretic separation, as well as accommodating the flow requirements for an efficient formation of the electrospray, among other advantages.13,14 Parameters affecting the separation and the detection of AuNPs have been studied and optimized. Separations were carried out on fused-silica capillaries with 50 μm i.d. × 100 cm total length. Prior to use, capillary was daily conditioned by washing with freshly prepared 0.1 M NaOH (30 min) followed by deionized water (20 min) and fresh running electrolyte (20 min). Between each injection, the capillary was reconditioned prior to each sample introduction by rinsing with background electrolyte for 5 min. The aqueous background electrolytes used for the separation of AuNPs was a mixture of 20 mM NH4Ac, 20 mM Tris and 10 mM CAPS at pH 8.5. AuNPs were introduced into the capillary by positive pressure at 4.9 kPa for 100 s. The applied voltage was set at 10 kV, with an initial ramping of desired voltage in 0.2 min, and the capillary temperatures were maintained at 20 °C. The coaxial sheath liquid consisted of 10 mM ammonium acetate–metOH (v/v) mixture flowing at a flow-rate of 1 mL min−1. The sheath liquid flowing into the ELSD system was delivered through a splitter set working at 1[thin space (1/6-em)]:[thin space (1/6-em)]100 ratio, thus resulting in a 10 μL min−1 flow-rate into the sprayer. For CE–ELSD interface, the outlet or exit tip of the capillary was inserted into the interface or sprayer triple tube assembly and allowed to protrude approximately 1 mm outside the sprayer. A 10 mm portion of the polyimide coating of the outlet end of the capillary was removed, using heat to ensure a stable spray. Nitrogen was used as the nebulization gas and controlled by and additional regulator pressure. The ELSD photomultiplier was set at gain 9 with a nebulizing pressure of 2.07 kPa, and an evaporator tube temperature of 70 °C. The length of the nebulizer chamber was 12 cm and diameter of 2.5 cm (Table 1).
Table 1 Optimized operating conditions for the separation of AuNPs by CE–ELSD
Parameters Optimal conditions
Buffer composition Mixture of 20 mM NH4Ac, 20 mM Tris and 10 mM CAPS
pH of buffer 8.5
Separation voltage 10 kV
Capillary dimension 50 μm i.d. × 100 cm
Capillary temperatures 20 °C
Injection time 100 s
Injection pressure 4.9 kPa
Sheath liquid composition 10 mM NH4Ac/metOH (v/v)
Flow rate of sheath liquid 10 μL min−1
Nebulizer pressure 2.07 kPa
Drift tube temperature 70 °C
Photomultiplier gain 9


4 Conclusions

CE–ELSD coupling system showed to be a mature methodology to separate and characterize different sizes of AuNPs. CE–ELSD shows to be an useful methodology to detect and size-characterize even small amounts of NPs. This fact is explained for two reasons: (1) NPs separation capability of the CE technique; and (2) the ELSD detection principle, which is based on the particle size. This hyphenated instrumental system was arranged, and successfully used, for the separation and characterization of AuNPs sizes, that differ in only 3 nm in diameter. The determined sizes of the separated NPs, which were based on online CE and ELSD measurements, were in the range of 3.5–10.5 nm without the use of any surfactant agent. This novel strategy of using CE–ELSD for analyzing the sizes of NPs can be advantageous expanded to the characterization of nanomaterials in the future. Additionally, it can be seen as a standard methodology to be implemented into routine comprehensive approaches for the analysis and characterization of NPs structure. This feature can be exploited to optimize synthesis of structured NPs, and to confirm the presence of the functionalizing agents at the nano-dispersed NPs. An additional advantage of using CE–ELSD to characterize NPs size is that the results are obtained in aqueous/liquid media, in contrast to the use of image techniques requiring the sample to be in a solid state. Therefore, the information obtained by CE–ELSD is more real to the present state of NPs in the used media for analytical purposes, as well as in the present state existing in biological samples. This fact may be also important for the toxicological studies of NPs in living systems (humans, animals and plants).

Acknowledgements

Financial support from the Spanish Ministry of Economy and Competitiveness (CTQ2013-48411-P) and Junta Comunidades Castilla-La Mancha (Project PEIC-2014-001-P) are gratefully acknowledged. The support given through an “INCRECYT” research contract to M. Zougagh is also acknowledged.

Notes and references

  1. C. S. Wu, C. Y. Lee, J. K. Chen, S. W. Kuo, S. K. Fan, C. C. Cheng, F. C. Chang and F. H. Ko, Int. J. Electrochem. Sci., 2012, 7(5), 4133–4142 CAS.
  2. F. K. Liu, Y. Lin and C. H. Wu, Anal. Chim. Acta, 2005, 528, 249–254 CrossRef CAS PubMed.
  3. H. Yazid, R. Adnan, S. A. Hamid and M. A. Farrukh, Turk. J. Chem., 2010, 34, 639–650 CAS.
  4. B. N. Khlebtsov and N. G. Khlebtsov, Colloid J., 2011, 73, 118–127 CrossRef CAS.
  5. F. K. Liu, Anal. Chim. Acta, 2011, 694, 167–173 CrossRef CAS PubMed.
  6. M. Valcárcel, B. M. Simonet and S. Cárdenas, Anal. Bioanal. Chem., 2008, 39, 1881–1887 CrossRef PubMed.
  7. B. Fernandez, J. M. Costa, R. Pereiro and A. Sanz-Medel, Anal. Bioanal. Chem., 2010, 396, 15–29 CrossRef CAS PubMed.
  8. A. Helfrich and J. Bettmer, Int. J. Mass Spectrom., 2011, 307, 92–98 CrossRef CAS PubMed.
  9. S. Dubascoux, I. Le Hecho, M. Hassellov, F. Von Der Kammer, M. Potin-Gautier and G. Lespes, J. Anal. At. Spectrom., 2010, 25(5), 613–623 RSC.
  10. F. K. Liu, Chromatographia, 2007, 66(1–2), 791–796 CAS.
  11. M. J. Lerma-García, M. Zougagh and A. Ríos, Curr. Anal. Chem., 2014, 10(2), 184–196 CrossRef.
  12. W. M. Hwang, C. Y. Lee, D. W. Boo and J. G. Choi, Bull. Korean Chem. Soc., 2003, 24(5), 684–686 CrossRef CAS.
  13. M. Bouri, R. Ralghi, M. Zougagh and A. Ríos, Anal. Chem., 2013, 85, 4858–4862 CrossRef CAS PubMed.
  14. M. Bouri, R. Salghi, M. Zougagh and A. Ríos, Electrophoresis, 2012, 34, 2623–2631 CrossRef PubMed.
  15. J. Turkevich, P. C. Stevenson and J. Hillier, Discuss. Faraday Soc., 1951, 11, 55 RSC.
  16. Z. Guo, X. Fan, L. Xu, X. Lu, C. Gu, Z. Bian, N. Gu, J. Zhang and D. Yang, Chem. Commun., 2011, 47, 4180–4182 RSC.
  17. S. H. Brewer, W. R. Glomm, M. C. Johnson, M. K. Knag and S. Franzen, Langmuir, 2005, 21, 9303–9307 CrossRef CAS PubMed.
  18. A. Sugunan, C. Thanachayanont, J. Dutta and J. G. Hilborn, Sci. Technol. Adv. Mater., 2005, 6, 335–340 CrossRef CAS PubMed.
  19. F. K. Liu, J. Chromatogr. A, 2007, 1167, 231–235 CrossRef CAS PubMed.
  20. J. M. Liu, Y. Li, X. P. Jiang and J. Yan, J. Proteome Res., 2010, 9, 3545–3550 CrossRef CAS PubMed.

This journal is © The Royal Society of Chemistry 2015
Click here to see how this site uses Cookies. View our privacy policy here.