 Open Access Article
Creative Commons Attribution 3.0 Unported Licence
A new approach for the improved interpretation of capacitance measurements for materials utilised in energy storage
Dimitrios K.
Kampouris
a,
Xiaobo
Ji
b,
Edward P.
Randviir
a and
Craig E.
Banks
*a
aFaculty of Science and Engineering, School of Chemistry and the Environment, Division of Chemistry and Environmental Science, Manchester Metropolitan University, Chester Street, Manchester M1 5GD, UK. E-mail: c.banks@mmu.ac.uk; Web: http://www.craigbanksresearch.com Fax: +44 (0)1612476831; Tel: +44 (0)1612471196
bKey Laboratory of Resources Chemistry of Nonferrous Metals, Ministry of Education, College of Chemistry and Chemical Engineering, Central South University, Changsha, 410083, China
First published on 23rd January 2015
Abstract
A simple galvanostatic circuit methodology is reported allowing the capacitance of an electrochemical electrolytic capacitor to be accurately measured, without recourse to expensive instrumentation. The method avoids problems found in current electrochemical impedance spectroscopy analysis, which give rise to profiles that may result in false or inaccurate derivation of the electrolytic capacitance. The advantages of this approach are that the circuit is easy and cheap to fabricate. The system is linear, regardless of the texture of the electrode and the type of electrolyte, and the measurement is direct so that no presumable equivalent circuit model is required. Such work is highly important for those developing new materials in energy storage, as it allows the reliable measurement of capacitance to be achieved without the need for expensive or complex instrumentation. This paper also highlights that users are more informed through checking capacitances using a variety of techniques, though such a circuit could in theory eliminate the need for affirmation of values utilising other electrochemical methods/techniques.
Introduction
As a result of the ever-increasing energy needs of modern society, and escalating environmental concerns, it has become imperative to discover new and innovative energy systems, because it is evident that conventional technologies, such as batteries, offer inept solutions for new market applications.1,2 Electrochemical supercapacitors are passive and static electrical energy storage devices, utilized in applications such as memory backup systems, portable electronics, and high power devices such as hybrid/electric vehicles, where rapid charging and discharging is of fundamental importance.3 They are relied upon to store energy, while offering transient, but extremely high, powers, beyond those accessible by a typical battery and are important for next generation energy storage devices, delivered over a short period of time.4Capacitance is a measurement of the stored charge ratio between two conducting bodies, separated by a dielectric material, resulting in the formation of an electrostatic field once a potential is applied. All capacitors incur various losses, such as resistance in the conducting bodies or leads, current leakage, and dielectric absorption. Such parameters have a significant impact upon the power factor of a capacitor.5 Theoretically, an ideal capacitor would demonstrate a power factor of zero; however the losses listed above result in power factors of realistic capacitors to be more than zero. The average power factor of a high quality capacitor would be 2–3%.
As pointed out by Autolab®, the capacitance and Equivalent Series Resistance (ESR) of a supercapacitor can be determined by obtaining its charge/discharge cycle. These parameters can be measured using chronopotentiometry, Cyclic Voltammetry (CV), or with Electrochemical Impedance Spectroscopy (EIS). The latter has become a powerful tool for electrochemists, because it is capable of characterising the electrical properties of materials and their interfaces.6 Though EIS is a non-intrusive and highly sensitive technique, it necessitates basic but vital precautions, which are often overlooked, to obtain error-free data. Despite this, EIS is still used to determine the capacitance of supercapacitors.7–10
EIS measurements involve the imposing of an electric potential with a specific frequency at a working electrode. The potential consists of two components: a time-independent Direct Current (DC) potential; and a periodically oscillating potential with a small amplitude, which is typically less than 10 mV.11–13 Such a potential results in the production of a measurable current. Electrochemical impedance is defined as the ratio between the amplitudes of the oscillating potential (between the working and reference electrodes) and the oscillating current, and is measured as a potential drop over a precision resistor, in series with the cell. The cell properties, electronic device characteristics, or design restrictions, may have a significant influence on the potential and current measurements, which affects the accuracy of EIS measurements.
Such an inaccuracy remains the source of controversy14 where EIS is concerned. For example, Lufrano et al. observed that the capacitance of carbon composite Electronic Double Layer Capacitors (EDLC), measured in H2SO4 using EIS, were greatly reduced compared to capacitances measured using galvanostatic charge/discharge.15 Many hypotheses have been proposed to explain this observation,16–24 but there is still no clear or definitive explanation that accounts for the observed discrepancies. It is noteworthy that some texts believe capacitance measurements using EIS to be erroneous by approximately 20%.25,26
Herein, we highlight the nature of these limitations and report a novel yet simplistic circuit, that offers a huge benefit by overcoming non-linear capacitative discharge and thus making capacitance measurements using EIS more accurate. The overall cost of construction of the circuit (<£5) is insignificant in comparison to the advantages tendered.
Experimental
All chemicals used were of analytical grade and were used as-received without any further purification and were obtained from Sigma-Aldrich (UK). All solutions were prepared with deionised water of resistivity of no less than 18.2 MΩ cm.Voltammetric measurements were conducted using a μ-Autolab III (ECO0Chemie, Netherlands) potentiostat. All measurements were conducted using a three-electrode configuration, comprising of a screen-printed carbon electrode on a flexible substrate, consisting of a carbon working electrode (9 mm diameter), a carbon counter, and an on-board Ag/AgCl pseudo-reference electrode. Connectors for the efficient connection of the screen-printed electrodes were purchased commercially from Kanichi Research Services.
The electrical circuit consists of a 500 μF electrolytic capacitor, situated between the two electrodes. Precision resistors (in the order of kΩ) are placed between the counter and reference contacts, and the working connection and its corresponding electrode.
Theory
In Electrochemical Impedance Spectroscopy (EIS) experiments, the electric potential, ψ, imposed at the electrode is a harmonic function of time, t. This produces a harmonic current density, J, providing the amplitude of the harmonic potential is small (typically 10 mV). The complex electrochemical impedance, Z, is expressed in terms of the phase angle, ϕ, and the imaginary component, i:11,27–29 | (1) |
| REIS = Z′ | (2) |
 | (3) |
The resistance and capacitance for a given frequency are retrieved from the in/out phase components of the measured electrochemical impedance.11,27–29 The phase angle often used in calculations is defined as the phase shift by which the current is ahead of the potential.
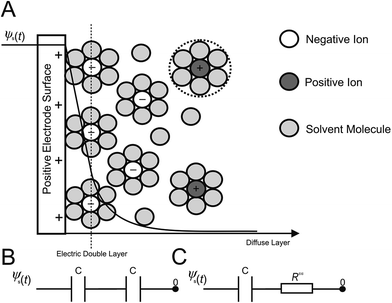
In terms of the measuring of capacitance utilizing EIS, eqn (2) is commonly applied, in conjunction with an experimental model of the electrical double layer (Fig. 1A). Such double layers, formed at the electrode|electrolyte interface, involve a simple RC circuit consisting of a resistor and capacitor in series, or for the case of the double layer coupled with diffusion layer capacitance, Fig. 1B is a more accurate representation.
In RC circuits, the capacitance is assumed to be either constant, or dependent only upon frequency.27 However, computational studies have established that the specific capacitance also varies harmonically.26 Consequently, the assumptions used for the equivalent RC circuits in EIS experimentation are invalid when representing the charging dynamics of the electrical double layers at high frequencies, instilling an integral limitation to RC circuits and EIS analysis. Thus, more complex RC circuits,5,31,32 or transmission line models,5,33–37 have also been developed through the introduction of additional circuit elements to represent double layers. Experimental EIS data is then fitted to these models in order to retrieve the resistance and capacitance values. These models are not without flaw; it is possible for two diverse models to produce the same impedance response. Furthermore, the resulting impedance expression gives little or no direct information about the physical meaning of the elements that constitute the models.
Previous studies have illustrated that RC circuits can accurately represent the linearized model when both the potential and the electrolyte concentration are low.34–40 Consequently, EIS measurements appear to be inadequate for the determination of the double layer capacitances for ‘real’ applications, where both concentrations and DC potentials are typically high, such as those found at electrochemical capacitors developed for energy storage applications.14,23,24,32 In dilute electrolyte environments, EIS simulations overestimate the electric double layer capacitance, while the converse is found for concentrated electrolyte solutions. This substantiates existing experimental observations, which report discrepancies between EIS measurements14–18,23,24,31–33 and other techniques such as CV and galvanostatic charge/discharge. It has been well documented that for large direct current potentials (conditions typical to the energy storage mechanisms of EDLCs), the series RC circuit used in EIS to model the electric double layer (Fig. 1C) is not valid. Consequently, more dependable and consistent techniques such as CV or galvanostatic charge/discharge should be favoured in defining the double layer capacitance.14,23,24,32 Herein, we discuss the physical considerations and model extraction parameters, which may have a significant impact on EIS experiments.
Linearity of electrochemical systems
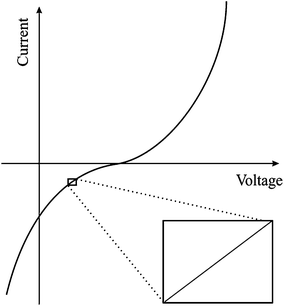
Within a typical potentiostatic measurement, the input is the potential and the output is the current; however doubling the potential doesn't necessarily double the current, thus making such systems non-linear. However, if a small enough segment of the current versus voltage curve is taken under consideration, it can appear to be linear as shown in Fig. 2. As mentioned previously, EIS applies a small Alternating Current (AC) signal to the cell, producing a system that appears to be pseudo-linear, but still large enough to measure a response. Linear dependence of capacitance upon voltage is an approximation which improves the modelling precision by 10% compared to constant capacitance approximation.41 This small-range applied potential does unfortunately make some EIS experiments erroneous, because probing such a small area doesn't give a clear picture of surface phenomena. However, it is the best model to use in the case of EIS.Steady state systems
EIS analysis takes time (often hours). The system must be at a steady state throughout the time required to measure the EIS spectrum; a common cause of problems in EIS analysis is drift in the system being measured.6,29 Reaching a steady state can often be difficult to achieve, due to alterations in the system caused by adsorption of solution impurities, production of oxide layers, reaction of products in solution, coating degradation, or even temperature fluctuations.Electric circuit elements
EIS data is commonly analysed by fitting the spectrum to an equivalent circuit model. The elements that comprise these circuits are typical electrical elements such as resistors, capacitors, and inductors. For such models to be practically relevant, the elements in the model should have a basis in the physical electrochemical cell; for example, most models contain a resistor that models the electrolyte resistance. Very few electrochemical cells can be modelled using a single equivalent circuit element to obtain a reasonable fit. Instead, EIS models typically consist of a number of elements in a network.6,29,42–46 However, when capacitors are connected in series, impedance increases, resulting in a decrease in the capacitance. This is caused by the inverse relationship between capacitance and impedance. Circuit models are highly dependent upon the surface characteristics of the electrodes; thus electrodes have to be well characterized and understood prior to investigation.Electrolyte resistance
Resistance offered by the electrolyte solution is often a significant contributor to the impedance of the cell.29 A modern potentiostat compensates for the solution resistance between the counter and reference electrodes. However, the resistance between the reference and working electrodes must be considered when a cell is modelled. The resistance of an ionic solution is dependent of the concentration, type of ions, temperature, and geometry of the area in which the current is transferred. Unfortunately, most electrochemical cells do no contain a uniform current distribution through a definitive electrolyte area. Thus, a major problem in calculating the solution resistance concerns the determination of the current flow path and the geometry of the electrolyte that transmits the current.Charge transfer or polarization resistance
When the potential of an electrode is forced away from its open circuit, the electrode is deemed to be polarized, causing current to flow through electrochemical reactions that occur at the electrode surface. The flow or rate of current transferred is controlled by the kinetics of the reactions, the diffusion of reactants towards or away from the electrode, temperature, and the potential. The resistance of such processes is simply derived by the Ohms law relationship.Diffusion
The impedance due to diffusion is represented by the Warburg element, and is dependent upon the frequency. The electric field due to the frequency affects the diffusion layer and the rate of diffusion, so that at low frequencies, the impedance of the system increases.Constant phase elements
In contrast to a dielectric capacitor, the electric double layer capacitance of porous electrodes is known to depend upon frequency. Capacitors (including double layer) often do not display ideal behaviour; instead, they act like a Constant Phase Element (CPE). The impedance of a capacitor/CPE can be described as:29 | (4) |
Modelling overview
In EIS modelling, the electrical components within the model and their interconnections determine the shape of the model's impedance spectrum. The model's parameters also have a direct impact on the size of each feature within the spectrum. The factors influence the degree to which the fitted/modelled impedance spectrum matches the measured EIS spectrum.6In a physical model, each component that makes up the model is postulated to come from a physical process in the electrochemical cell. Knowledge of the cell's physical characteristics will influence the choice of model applied to a given system. Experienced EIS analysts are able to use the shape of a cell's EIS spectrum to select a model for that cell. Models can also be partially or completely empirical.29 In this case, the circuit components are not assigned to a physical process in the cell; instead the model is a ‘best’ possible match between the model's impedance and the actual measured impedance. This is performed via non-linear least square fitting, but can in some cases yield imperfect agreements with respect to experimental data. There are a plethora of models which can be fitted to a spectrum, which give totally different results for the capacitance values. It is therefore imperative that a model is used in line with an appropriate understanding of the electrode surface characteristics, which are analyte specific.
Simple Randles cell
Since the ideal capacitor rarely/does not actually exist in reality, many models are used to describe the system under investigation. The simple Randles cell is probably the most common cell model, which contains a solution resistance, a double layer capacitor, and a charge transfer (or polarization) resistance. The double layer capacitance and charge transfer resistance are parallel to each other. Although useful in its own right, the simple Randles circuit is the basis for many more complex models. Fig. 3B displays a circuit representation of the electrolytic capacitor where Rleakage defines the leakage resistance, RESR is the equivalent series resistance and LESL is the equivalent series inductance.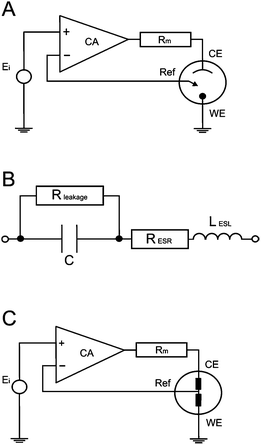 | ||
| Fig. 3 Basic internal schematic of: (A) a potentiostat, (B) electrolytic capacitor with impedance and leakage resistance elements, lastly the new circuit merged into the potentiostat system (C). | ||
EIS spectra of real devices seldom give relevant information about leakage resistance, as its effects are seen at impractical low frequencies. At higher frequencies, the simple model's 0° phase prediction is never actually met. Poor fits of actual capacitors to the Randles model can be a result of electrode porosity, resulting in non-uniform access of electrolyte towards the electrode surfaces, along with the occurrence of Faradaic reactions. Thus, simple resistor and capacitor models are not appropriate.
Galvanostatic DC analysis
A potentiostat applies a voltage between the reference electrode and the working electrode, forcing the working electrode to move to a more electropositive or electronegative region, in order to force the electrochemical reaction of any redox compound present in the solution. The applied voltage is fed through an OPerational Amplifier (OPA), which constantly monitors and ensures that the voltage source is constant between the working and reference electrodes. In the case of changing conductivity (impedance caused by transport phenomena occurring at the electrode surfaces during electrochemical reactions), the voltage values at the working electrode surface fluctuate in comparison to the original value; thus the OPA compensates by feeding the circuit with a correction voltage. The correction voltage is applied through the reference electrode, in order to eliminate the potential difference between the applied and effective voltage, resulting in a current flow, which is measured through a precision resistor (Rm). A simple schematic circuit of a potentiostat is presented in Fig. 3A.5The introduction of an electrode to a solution generates an interface; this interface adds impedance to the circuit. Additionally, the counter, reference and working electrodes each carry their own impedance. Therefore the capacitance measurement of the working electrode is not entirely accurate. The impedance incurred through the necessary use of a counter and reference electrode is eliminated via the use of and electrolyte in the solution. Unfortunately, electrolyte characteristics vary, so this has to be considered when KCl (considered the optimum electrolyte) isn't used. The counter electrode also introduces another electrochemical reaction which is not usually considered when measuring the capacitance of a working electrode.
Results and discussion
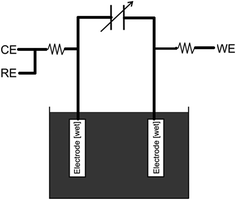
In this paper, we present a new circuit, which tenders an alternative, non-destructive solution to many of the problems discussed previously (see above), along with enhancement to typical galvanostatic analysis of capacitance. The circuit eliminates the interferences and impedance introduced by both the counter and reference electrodes. Precise resistors are introduced in series between: (1) the reference and counter contacts; and (2) the working electrode connection and its corresponding electrode, which limits the rate at which the charge reaches the capacitor. A variable capacitor, exhibiting a similar capacitance to the supercapacitor under investigation, with a known, highly accurate value, is the introduced in series with these connections. This forces the system to become linear upon analysis. Furthermore, it offers improved control over the upper voltage limits, as extreme or elevated voltages may source irreversible electrochemical reactions at the electrode surfaces. Parallel to the variable precision capacitor are two connections where ‘ideally’ two similar working electrodes are connected. The two working electrodes are then placed in the electrolyte solution; a schematic representation and its position within the potentiostatic system are provided in Fig. 4 and 3C, respectively.The total capacitance measured for the circuit (using a DC power supply) is given below:
 | (5) |
 | (6) |
 | (7) |
| CTotal = CKnown + 2CWE; | (8) |
 | (9) |
 | (10) |
| C = CWE/m, | (11) |
 | (12) |
 | (13) |
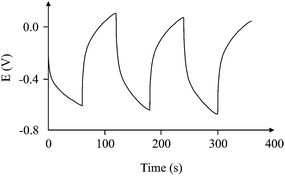
Galvanostatic analysis of a carbon Screen-Printed Electrode (SPE) in 3 M KOH at 0.1 A g−1 without (Fig. 5A) and with (Fig. 5B) the new incorporated circuit, resulted in a capacitance measurement of 1 and 24 F g−1, respectively, for identical electrodes. A noticeable improvement in the linear slope of V versus t is clearly shown, thus permitting a more accurate analysis of the capacitative characteristics to be established. The improvement in data analysis was seen for various electrode systems.
According to Wang and Pilon,26 there are two capacitance forms of a supercapacitor: the differential Cdiff, usually retrieved by EIS; and the integral Cint, which corresponds to the theoretical value. According to the authors, “EIS measures differential capacitance rather than integral capacitance, while CV and galvanostatic methods can measure both differential and integral capacitances. Similar confusion exists in the literature on electrical energy storage devices and may explain discrepancies reported when measuring the capacitances of supercapacitors using EIS, CV, or galvanostatic methods.” The differential and integral capacitances are defined as:
 | (14) |
 | (15) |
It is important to note that for the galvanostatic method, the calculated capacitance values are identical only when the measured electrical potential varies strictly linearly with time. In most published papers on supercapacitors, the values of the integral capacitances are typically published and this occurs for two reasons: (1) the integral capacitance directly represents the total charge storage performance of supercapacitors; and (2) the surface potential is the variable directly measured in the galvanostatic method, not the change in potential with respect to time. The two capacitance values measured by galvanostatic methods would be identical only in the case of a linear plot of the electric potential versus time, which is not very common. Thus, a linear plot of the electric potential versus time would solve one of the biggest issues on supercapacitor characterization; the innovation of the new suggested circuit is exactly that.
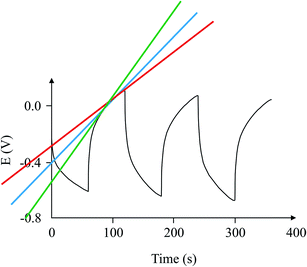
The use of commercially available electronic components, such as non-polarized electrolytic capacitors, has shown a behaviour of an “ideal” capacitor in terms of galvanostatic and voltammetric methods, as shown in Fig. 6. The term “ideal” capacitor refers to the ideal cyclic voltammograms and charge/discharge graphs; i.e. the voltammograms exhibit polarized electrode behaviour, and the charge/discharge graph exhibits a triangle shape. The triangle shape of the charge/discharge cycle gives more accurate results with respect to the calculation of the electrode capacitance, since
 | (16) |
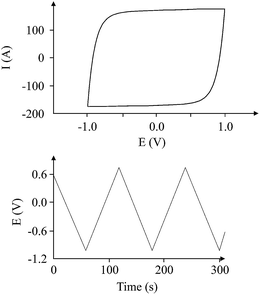 | ||
| Fig. 6 The “ideal” voltammetric (top) and charge/discharge (bottom) graphs for a non-polarized electrolytic capacitor (470 μF; 220 V; 100 μA charging current for galvanostatic charge/discharge). | ||
Fig. 8 shows how different users will calculate the slope of the graph. Each person can give a different slope which cannot be questioned for its decision. This creates an unclear area on the calculation of the capacitance of a capacitor. This common phenomenon faced by every researcher in the field has been overcome by the introduction of the new circuit, which helps improve the interpretation of the results without affecting the true behaviour of the supercapacitor. The ideal behaviour of “ideal” capacitors available commercially led to introducing the circuit, which helps calculate the capacitance with high accuracy and without any doubt as to the interpretation of the results. If the tested capacitor/supercapacitor is connected with one or more ideal capacitors, it is quite possible that the response of the whole circuit could improve, and even approach the behaviour of an ideal capacitor. This is the basis of the approach reported here.
Usually, the capacitance of a supercapacitor has a value in the range of Farads. The capacitance of a normal “ideal” capacitor ranges from sub micro- to hundreds of micro-Farads, which means that compared to the supercapacitor values, they store at least a million times more charge than the “ideal” capacitor. It is clear that, in such a case where said capacitors are connected in series, the behaviour of the supercapacitor will still dominate versus the behaviour of the ideal capacitor, so the response of the total circuit will look more like the response of the supercapacitor itself.
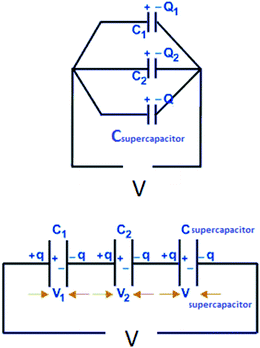
Before continuing to further this approach, it is a good time to explain some basic principles on capacitor connections and the calculation of the total capacitance. A specific example is used, with three capacitors, which illustrates how the circuit could significantly improve the interpretation of the results. In this example, a supercapacitor with a value of 1 F (Csupercapacitor) and two commercially available capacitors with values of 470 μF (C1) and 100 μF (C2) are used. These capacitors are connected in three ways. The first case is where the capacitors are connected in parallel, as shown in Scheme 1. In this case, if CTotal is the capacitance of the equivalent circuit capacitor, then:
| V = V1 = V2 = Vsupercapacitor. | (17) |
The total charge stored in the equivalent circuit case would have been:
| Q = Q1 = Q2 = Qsupercapacitor, | (18) |
| CTotalV = C1V1 + C2V2 + CsupercapacitorVsupercapacitor, | (19) |
| CTotalV = C1V + C2V + CsupercapacitorV, | (20) |
| CTotal = C1 + C2 + Csupercapacitor. | (21) |
In this example, CTotal equates to the sum of the capacitances of the three capacitors; 1![[thin space (1/6-em)]](https://www.rsc.org/images/entities/char_2009.gif) 000
000![[thin space (1/6-em)]](https://www.rsc.org/images/entities/char_2009.gif) 570 μF ≈ 1 F. Therefore the total capacitance of the circuit would have a value close to the value of the supercapacitor. Thus, the problems mentioned previously would still exist! The experimental error for this case was 0.057%, that is, the experimentally observed capacitance using the circuit was 0.057% different, on average, than the theoretical capacitance of 1
570 μF ≈ 1 F. Therefore the total capacitance of the circuit would have a value close to the value of the supercapacitor. Thus, the problems mentioned previously would still exist! The experimental error for this case was 0.057%, that is, the experimentally observed capacitance using the circuit was 0.057% different, on average, than the theoretical capacitance of 1![[thin space (1/6-em)]](https://www.rsc.org/images/entities/char_2009.gif) 000
000![[thin space (1/6-em)]](https://www.rsc.org/images/entities/char_2009.gif) 570 μF.
570 μF.
The second case is where three capacitors are connected in series, as in Scheme 1. In this case:
| V = V1 + V2 + Vsupercapacitor, | (22) |
| Q = Q1 = Q2 = Qsupercapacitor, | (23) |
 | (24) |
 | (25) |
In this example, the total capacitance of the series circuit using eqn (25) equates to 82.45 μF. The equivalent total capacitor in the second case is closer to the capacitance value of the smallest capacitor, C2, and thus the dominant behaviour is that of C2, and the effect of Csupercapacitor is minimized. The experimental error of 17.55% in this case was much higher than in the previous case. It is clear that at low values of capacitance, the circuit's behaviour is affected more by other components of the circuit.
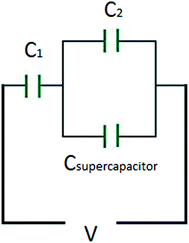
The third case is presented in Scheme 2, where the capacitors are in both series and parallel. In this case, the total circuit is divided into two individual parts: (1) C2 with Csupercapacitor, which is collectively labelled the C2S capacitor; and (2) C2S with C1, which will give CTotal. The C2S contribution is derived from both the C2 and Csupercapacitor elements, which are in parallel, and therefore:
| C2S = C2 + Csupercapacitor. | (26) |
This estimates the capacitance of the C2S element to have a capacitance of 1![[thin space (1/6-em)]](https://www.rsc.org/images/entities/char_2009.gif) 000
000![[thin space (1/6-em)]](https://www.rsc.org/images/entities/char_2009.gif) 001 μF ≈ 1 F. Then, for the total capacitor:
001 μF ≈ 1 F. Then, for the total capacitor:
 | (27) |
Finally, Fig. 9 depicts an example of the types of curves one could expect from a case where this circuit is used and another case where it is not. The graph shows that the calculation of the 1/slope is more accurate when compared with the variable 1/slope values when the capacitor is tested in the usual way.
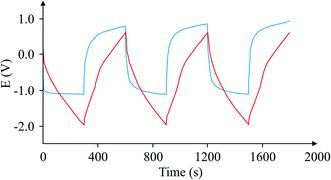 | ||
| Fig. 9 Comparison of charge/discharge cycles for the same capacitor using the proposed circuit (red), and without the circuit (blue). | ||
Conclusions
EIS is typically used for characterising the electrochemical behaviour of energy storage devices. Several authors propose electric models, based on a ‘best fit’ approximation that describes the electric behaviour of a supercapacitor, but the models do not take into account their dynamic behaviour. Consequently, the ‘true’ behaviour of the capacitor is masked. This paper has presented a new galvanostatic circuit that enhances capacitance analysis through improved interpretation of results, by creating a linear slope of V versus t. The direct measurement of capacitance means that there is no model interpretation based on a ‘best fit’. Rapid testing allowed for steady state experimentation, negating the dynamic tendencies of some supercapacitors, while eliminating the impedance sourced from interfaces found at the surface of the counter and reference electrodes, in the case of EIS.This paper has highlighted that users are more informed through checking capacitances using a variety of techniques, though such a circuit could in theory eliminate the need for affirmation of values utilising other electrochemical methods such as cyclic voltammetry. Given the low cost of fabrication (less than £5; all parts are commercially available) it is expected that this will be adapted as a facile and accurate method with which to accurately measure capacitance by those developing new materials for use in supercapacitors.
References
- A. S. Arico, P. Bruce, B. Scrosati, J.-M. Tarascon and W. van Schalkwijk, Nat. Mater., 2005, 4, 366–377 CrossRef CAS PubMed.
- X. Du, C. Wang, M. Chen, Y. Jiao and J. Wang, J. Phys. Chem. C, 2009, 113, 2643–2646 CAS.
- D. A. C. Brownson, D. K. Kampouris and C. E. Banks, J. Power Sources, 2011, 196, 4873–4885 CrossRef CAS.
- C.-C. Hu, K.-H. Chang, M.-C. Lin and Y.-T. Wu, Nano Lett., 2006, 6, 2690–2695 CrossRef CAS PubMed.
- B. E. Conway, Electrochemical supercapacitor: scientific fundamentals and technological applications, Springer, USA, 1999 Search PubMed.
- E. Barsoukov and J. R. Macdonald, Impedance Spectroscopy: Theory, Experiment, and Applications, Wiley, 2nd edn, 2005 Search PubMed.
- B. N. M. Dolah, M. A. R. Othman, M. Deraman, N. H. Basri, R. Farma, I. A. Talib and M. M. Ishak, J. Phys.: Conf. Ser., 2013, 431, 012015 CrossRef.
- M. Arulepp, J. Leis, M. Lätt, F. Miller, K. Rumma, E. Lust and A. F. Burke, J. Power Sources, 2006, 162, 1460–1466 CrossRef CAS.
- W. Wang, S. Guo, I. Lee, K. Ahmed, J. Zhong, Z. Favors, F. Zaera, M. Ozkan and C. S. Ozkan, Sci. Rep., 2014, 4 Search PubMed.
- V. Ganesh, S. Pitchumani and V. Lakshminarayanan, J. Power Sources, 2006, 158, 1523–1532 CrossRef CAS.
- X. Z. Yuan, C. Song, H. Wang and J. Zhang, Electrochemical impedance spectroscopy in PEM fuel cells: fundamentals and applications, Springer, London, UK, 2010 Search PubMed.
- D. Pech, M. Brunet, H. Durou, P. Huang, V. Mochalin, Y. Gogotsi, P.-L. Taberna and P. Simon, Nat. Nanotechnol., 2010, 5, 651–654 CrossRef CAS PubMed.
- H. Itoi, H. Nishihara, T. Kogure and T. Kyotani, J. Am. Chem. Soc., 2011, 133, 1165–1167 CrossRef CAS PubMed.
- A. T. Chidembo, K. I. Ozoemena, B. O. Agboola, V. Gupta, G. G. Wildgoose and R. G. Compton, Energy Environ. Sci., 2010, 3, 228–236 CAS.
- F. Lufrano, P. Staiti and M. Minutoli, J. Power Sources, 2003, 124, 314–320 CrossRef CAS.
- J. Tanguy, J. L. Baudoin, F. Chao and M. Costa, Electrochim. Acta, 1992, 37, 1417–1428 CrossRef CAS.
- X. Ren and P. G. Pickup, J. Electrochem. Soc., 1992, 139, 2097–2105 CrossRef CAS.
- X. Ren and P. G. Pickup, J. Electroanal. Chem., 1994, 372, 289–291 CrossRef CAS.
- I. Rubinstein, E. Sabatani and J. Rishpon, J. Electrochem. Soc., 1987, 134, 3078–3083 CrossRef CAS.
- J. Tanguy, N. Mermilliod and M. Hoclet, J. Electrochem. Soc., 1987, 134, 795–802 CrossRef CAS.
- M. Kalaji and L. M. Peter, J. Chem. Soc., Faraday Trans., 1991, 87, 853–860 RSC.
- J. Bobacka, A. Lewenstam and A. Ivaska, J. Electroanal. Chem., 2000, 489, 17–27 CrossRef CAS.
- A. B. Fuertes, G. Lota, T. A. Centeno and E. Frackowiak, Electrochim. Acta, 2005, 50, 2799–2805 CrossRef CAS.
- W. Xing, S. Z. Qiao, R. G. Ding, F. Li, G. Q. Lu, Z. F. Yan and H. M. Cheng, Carbon, 2006, 44, 216–224 CrossRef CAS.
- E. P. Randviir and C. E. Banks, Anal. Methods, 2013, 5, 1098–1115 RSC.
- H. Wang and L. Pilon, Electrochim. Acta, 2012, 63, 55–63 CrossRef CAS.
- A. J. Bard and L. Faulkner, Electrochemical methods: fundamentals and applications, John Wiley & Sons, 2nd edn, 2001 Search PubMed.
- A. Lasia, in Modern Aspects of Electrochemistry, ed. B. E. Conway, J. O. M. Bockris and R. White, Springer, USA, 2002, vol. 32, ch. 2, pp. 143–248 Search PubMed.
- M. E. Orazem and B. Tribollet, Electrochemical impedance spectroscopy, Wiley, 2008 Search PubMed.
- P. L. Taberna, P. Simon and J. F. Fauvarque, J. Electrochem. Soc., 2003, 150, A292–A300 CrossRef CAS.
- J. P. Zheng, P. C. Goonetilleke, C. M. Pettit and D. Roy, Talanta, 2010, 81, 1045–1055 CrossRef CAS PubMed.
- K. Kierzek, E. Frackowiak, G. Lota, G. Gryglewicz and J. Machnikowski, Electrochim. Acta, 2004, 49, 515–523 CrossRef CAS.
- C. Peng, J. Jin and G. Z. Chen, Electrochim. Acta, 2007, 53, 525–537 CrossRef CAS.
- R. P. Buck, J. Electroanal. Chem. Interfacial Electrochem., 1969, 23, 219–240 CrossRef CAS.
- T. R. Brumlev and R. P. Buck, J. Electroanal. Chem. Interfacial Electrochem., 1981, 126, 73–104 CrossRef.
- R. P. Buck, J. Electroanal. Chem. Interfacial Electrochem., 1986, 210, 1–19 CrossRef CAS.
- M. Z. Bazant, K. Thornton and A. Ajdari, Phys. Rev. E: Stat., Nonlinear, Soft Matter Phys., 2004, 70, 021506 CrossRef PubMed.
- G. C. Barker, J. Electroanal. Chem. Interfacial Electrochem., 1973, 41, 201–211 CrossRef CAS.
- K. T. Chu and M. Z. Bazant, Phys. Rev. E: Stat., Nonlinear, Soft Matter Phys., 2006, 74, 011501 CrossRef PubMed.
- E. J. F. Dickinson and R. G. Compton, J. Electroanal. Chem., 2011, 655, 23–31 CrossRef CAS.
- F. Rafik, H. Gualous, R. Gallay, A. Crausaz and A. Berthon, J. Power Sources, 2007, 165, 928–934 CrossRef CAS.
- G. W. Walter, Corros. Sci., 1986, 26, 681–703 CrossRef CAS.
- F. Mansfeld, Electrochim. Acta, 1990, 35, 1533–1544 CrossRef CAS.
- E. Karden, S. Buller and R. W. De Doncker, Electrochim. Acta, 2002, 47, 2347–2356 CrossRef CAS.
- D. Qu and H. Shi, J. Power Sources, 1998, 74, 99–107 CrossRef CAS.
- A. Burke, J. Power Sources, 2000, 91, 37–50 CrossRef CAS.
- H.-K. Song, Y.-H. Jung, K.-H. Lee and L. H. Dao, Electrochim. Acta, 1999, 44, 3513–3519 CrossRef CAS.
- H.-K. Song, H.-Y. Hwang, K.-H. Lee and L. H. Dao, Electrochim. Acta, 2000, 45, 2241–2257 CrossRef CAS.
- G. J. Brug, A. L. G. van den Eeden, M. Sluyters-Rehbach and J. H. Sluyters, J. Electroanal. Chem. Interfacial Electrochem., 1984, 176, 275–295 CrossRef CAS.
- T. Pajkossy, J. Electroanal. Chem. Interfacial Electrochem., 1991, 300, 1–11 CrossRef CAS.
- T. Pajkossy, J. Electroanal. Chem., 1994, 364, 111–125 CrossRef CAS.
- Z. Kerner and T. Pajkossy, Electrochim. Acta, 2000, 46, 207–211 CrossRef CAS.
- H. Wang and L. Pilon, Electrochim. Acta, 2012, 76, 529–531 CrossRef CAS.
| This journal is © The Royal Society of Chemistry 2015 |

