Study on key step of 1,3-butadiene formation from ethanol on MgO/SiO2
Minhua Zhangab,
Meixiang Gaoab,
Jianyue Chenab and
Yingzhe Yu*ab
aKey Laboratory for Green Chemical Technology of Ministry of Education, Tianjin University R&D Center for Petrochemical Technology, Tianjin 300072, China. E-mail: yzhyu@tju.edu.cn
bCollaborative Innovation Center of Chemical Science and Engineering (Tianjin), Tianjin 300072, China
First published on 17th February 2015
Abstract
The structure and surface properties of the MgO/SiO2 catalyst were studied by both experimental characterization and the simulation method. The adsorption properties of ethanol on different MgO/SiO2 surfaces were researched by the density functional theory method and the result is that ethanol mainly adsorbed on MgO surface. The role of SiO2 in increasing the MgO crystal defects in the MgO/SiO2 has been obtained and the electronic properties of ethanol molecule before and after adsorption on the catalyst surfaces were compared. The initial step of ethanol dehydrogenation and the dehydration to 1,3-butadiene process, which is the dehydrogenation of ethanol to acetaldehyde reaction, on the flat sites, stepped sites and kinked sites was examined through the molecular simulation method. We investigated the preferable surface for the reaction of ethanol dissociation to an ethoxy group and the more active surface for the reaction of dehydrogenation of ethanol to acetaldehyde. The research results suggested that the stepped MgO surface is more active for the reaction of dehydrogenation of ethanol to acetaldehyde.
1 Introduction
1,3-Butadiene (BD) is one of the most essential basic chemicals in the petroleum chemical industry. BD is a by-product of the ethylene process typically isolated from the cracking of naphtha.1 The recent trends in lightening of the feedstock of steam crackers reduce the BD supply and may potentially lead to a shortage in BD production in the coming years.2 An estimated 9.3 million tons of BD were produced worldwide in 2005 (CMAI, 2006). The world capacity grew by 3.5% per year between 1997 and 2002.3 To accommodate this up-coming energy deficit, it is especially crucial to develop alternative technologies for BD production from renewable resources such as bioethanol. Recent research has shifted toward bioethanol production from non-food biomass feedstocks.4–6 Therefore, in the coming number of years, BD production from bioethanol will be the most promising, renewable and sustainable technology among various on-purpose BD production processes.Catalytic BD formation from ethanol is an industrially proven route. From the 1920s to 1960s, ethanol was converted to BD at 400–450 °C using a one-step process or at 300–350 °C according to a two-step process using a Ta2O5/SiO2 catalyst. Additionally, various catalysts have been proposed to perform this reaction.7–11 Among all the catalysts that were suggested to catalyze this reaction, MgO/SiO2 is the most widely studied, and Makshina et al.12 also report that MgO/SiO2 is the most promising catalyst in the reaction to transform ethanol to BD. However, the mechanism of the high MgO/SiO2 activity achieved and the roles that SiO2 play in the catalysis of MgO/SiO2 are today open for debate. The reaction mechanism suggested by Lebedev et al.,13 which is discussed in ref. 14, may be represented as follows:
| (1) CH3CH2OH → CH3CHO + H2↑ |
| (2) 2CH3CHO → CH3CHOHCH2CHO |
(3) CH3CHOHCH2CHO → CH3–CH![[double bond, length as m-dash]](https://www.rsc.org/images/entities/char_e001.gif) CH–CHO + H2O CH–CHO + H2O |
(4) CH3–CH![[double bond, length as m-dash]](https://www.rsc.org/images/entities/char_e001.gif) CH–CHO + CH3CH2OH → CH3CH CH–CHO + CH3CH2OH → CH3CH![[double bond, length as m-dash]](https://www.rsc.org/images/entities/char_e001.gif) CHCH2OH + CH3CHO CHCH2OH + CH3CHO |
(5) CH3CH![[double bond, length as m-dash]](https://www.rsc.org/images/entities/char_e001.gif) CHCH2OH → CH2 CHCH2OH → CH2![[double bond, length as m-dash]](https://www.rsc.org/images/entities/char_e001.gif) CH–CH CH–CH![[double bond, length as m-dash]](https://www.rsc.org/images/entities/char_e001.gif) CH2 + H2O CH2 + H2O |
In our previous work, we studied the reaction of MgO/SiO2and the mechanism of the catalytic conversion of ethanol to 1,3-butadiene on magnesia–silica acidic–basic bifunctional catalysts,15,16 which agrees with the research by Lebedev et al.13 The research by Branda et al.17 shows that the catalytic activity of the MgO surfaces is attributed to its crystal defects, but no one accounts for the principle of ethanol conversion to BD on a defective MgO structure.
The aim of our present work is to apply a simulation method to study the key steps of BD formation from ethanol on MgO and SiO2, to analyze the roles that SiO2 play in the catalysis and the different characters of the defective surface of MgO, which makes contributions to the research of BD formation on MgO/SiO2 at the molecular level.
2 Experimental and computational methods
2.1 Preparation of the catalysts
The preparation method of wet-kneading was employed. The MgO content of the MgO/SiO2 catalyst, the calcined temperature and favorable reaction conditions have been studied. When the MgO content was 80 wt%, the catalyst had the highest selectivity as listed in Table 1.15,16| MgO content | Xethanol% | SBD% | Sethylene% | Sdiethyl ether% | Sacetic acid% |
|---|---|---|---|---|---|
| 30% | 66.90 | 15.08 | 73.39 | 10.53 | 1.77 |
| 40% | 68.74 | 21.79 | 73.41 | 4.01 | 0.89 |
| 50% | 63.90 | 26.80 | 69.16 | 3.31 | 0.71 |
| 70% | 63.32 | 30.67 | 65.84 | 2.99 | 0.46 |
| 80% | 66.32 | 48.02 | 49.08 | 2.15 | 0.74 |
| 90% | 41.76 | 19.48 | 63.03 | 1.41 | 16.03 |
2.2 Catalyst characterization
The solid structure in MgO, SiO2 and MgO/SiO2 samples were determined by powder X-ray diffraction methods using a D/max-2500 diffractometer and Ni-filtered CuKα radiation. The UV reflectance spectra of powdered samples were measured on a U-3010 UV-Vis DRS spectrophotometer.2.3 Temperature-programmed surface reaction
The temperature-programmed surface reaction experiments were carried out in Auto II 2920 and products were analyzed by an on-line mass spectrometer (Balzers Omnistar MS200). The 100 mg MgO or SiO2 (bought from Aladdin) was fixed in a quartz reactor. Before the experiment, the sample was pretreated in N2 at 500 °C for 2 h at a heating rate of 20 °C min−1 from ambient temperature to 500 °C, and a N2 flow rate of 20 ml min−1. After the catalyst pretreated and the temperature drop to 400 °C, ethanol/He gas was injected to the catalyst surface through a quantitative loop (1 μl). The MS was used to detect all possible products: acetaldehyde, ethylene, and 1-butylene.2.4 Computational methodology
The calculations were performed by the density functional theory program Dmol3 in Materials Studio of Accelrys, in which the physical wave functions are expanded in the terms of numerical basis sets.18,19 To maintain the balance between the efficiency and computation accuracy, a DNP double numerical basis set was used, and special points sampling integration were employed, a 2 × 2 × 1 k-point grid was determined by the Monkhorst–Pack method.20 The core electrons were treated with DFT semi-core pseudopotentials.21 The exchange–correlation energy was calculated using the Rectified-Perdew–Burke–Ernzerhof (RPBE) generalized gradient approximation (GGA).22 The electron density and a self-consistent field tolerance were converged to within 2.0 × 10⁻⁵ eV and 1.0 × 10⁻⁵ Ha per atom, respectively. The geometry optimizations were performed with DFT until the force on each atom was less than 0.004 Ha Å−1.3 Results and discussion
3.1 Characterizations of MgO, SiO2 and MgO/SiO2
3.2 The surface reaction of ethanol on MgO and SiO2
The ion intensity of products against the reaction time on the MgO and SiO2 surface, with ethanol pulse injection, are shown in Fig. 3 and 4. The products are acetaldehyde, ethylene and 1-butene on the MgO surface, while only ethylene is formed from ethanol on the SiO2 surface. Further, we can speculate that the effect of ethanol on MgO: ethylene is formed from ethanol through dehydration; ethanol is dehydrogenated to acetaldehyde; acetaldehyde underwent an aldol-condensation with reduction and dehydration forming 1-butene. Similarly, the process of ethanol on SiO2 is dehydration of ethanol to ethylene. Based on the process of formation of BD from ethanol listed in the literature,2,8,12 the first and key step is dehydrogenation of ethanol to acetaldehyde. Thus, the study of the key step of the formation of BD from ethanol at molecular level is a priority.3.3 Models
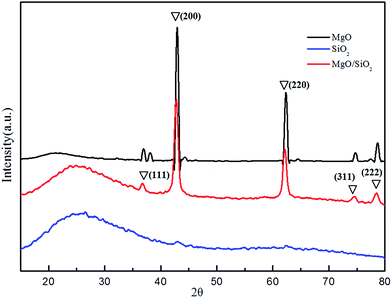
As above, experimental research shows that the MgO and SiO2 still maintain their native morphology in MgO/SiO2 and phases corresponding to MgSiO4 are not detected. Thus, we model MgO and SiO2, respectively. The partial structure of amorphous silica is similar to β-cristobalite; furthermore, the physical properties such as the density, refractive index are found to be close. Thus, we selected β-cristobalite with Fd3m symmetries as the representative model of silica,25,26 as shown in Fig. 5. The lattice constant a = b = c = 7.16 Å agrees satisfactorily with experimental measurements.27 The results of the experiment show that the surface hydroxyls density of amorphous silica is 4.9 OH/100 Å2,28 while that of β-cristobalite (111) is 4.55 OH/100 Å2. The supercell for the (111) surface include a (2 × 2) surface unit cell and 4 atomic layers with a vacuum region of 15 Å, and maintain the other two layers of the slab fixed in the geometry. | ||
| Fig. 5 Crystal models for the SiO2 surface (a). The model for β-cristobalite; (b). The model for β-cristobalite (111) surface. | ||
Avoiding unphysical dipole–dipole interactions between two consecutive slabs, we adopted an asymmetry supercell in which the atoms of the uppermost layer were satisfied by OH and the bottom Si atoms were unsatisfied.
The alkalinity of metal oxide mainly lies in O2−; however, the catalytic activity of MgO surfaces is attributed to their crystal defects.17 Just as the results of coordination characterization, the addition of SiO2 increases the defects of MgO. Thus, the study of reaction species adsorbed on the MgO defects is of great significance. There are three coordination sites of the MgO surface: five-coordinated Mg2+ ion at a terrace (Mg5c and O5c), four-coordinated Mg2+ ion at a step site (Mg4c and O4c), three-coordinated Mg2+ adsorption site at the kink corner (Mg3c and O3c).
In our work, we used the geometry of periclase. The surface energy of MgO (100) is the lowest of; MgO (100), MgO (110), MgO (111)/Mg and MgO (111) by calculations, which agrees with Refson et al.29 Jose A. Rodriguez's work has shown that slabs of 3–4 layers provide a very good representation of the MgO (100) surface.30 Taking the three types of the above defects into consideration, the model employed in this paper is presented in Fig. 6. The geometry optimization of bulk MgO provides us a typical rock-salt structure with a0 = 4.28 Å, which is close to the experiment measurements (4.22 Å).31
3.4 Surface adsorption
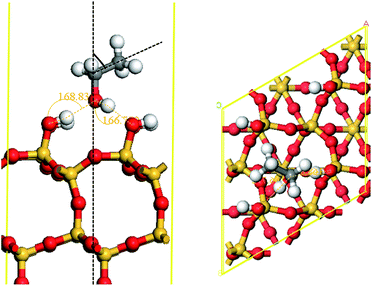
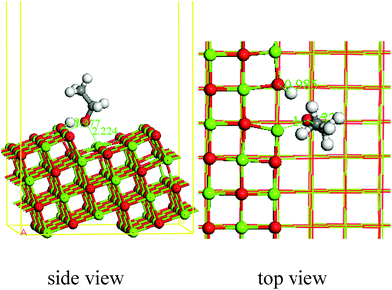
Dissociative adsorption appears when ethanol is adsorbed on the step sites of MgO, and the adsorption energy is 1.92 eV. The bond length of O–H in ethanol is 2.001 Å, which indicates the cleavage of O–H. The fractured H forms an OH on the flat surface of MgO, and the bond length is 0.985 Å. The O–Mg bond is formed between the Mg5c (bond length = 1.977 Å), Mg4c (bond length = 2.221 Å) and ethoxy group.
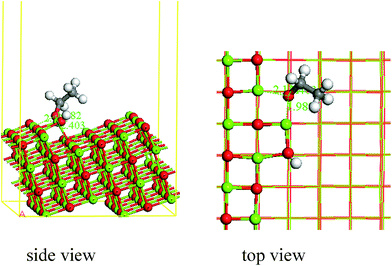
Dissociative adsorption also appears when ethanol is adsorbed on the kink sites of MgO, and the adsorption energy is 3.39 eV. The bond length of O–H in ethanol is 4.630 Å, and the fractured H forms an OH with O3c on the kink surface of MgO (bond length = 0.967 Å). The distance between O in ethanol and Mg5c, Mg3c, Mg4c is 2.403 Å, 1.982 Å, 2.131 Å, respectively. Bond length of O–H forming on kink surface of MgO is the shortest, which illustrates that the interaction between ethanol and the kink surface of MgO is the strongest.
In summary, the above results reveal that ethanol is preferably adsorbed on the defective sites of MgO. However, the adsorption of ethanol on MgO or SiO2 is competitive adsorption, it will produce the by-product of ethylene when ethanol is adsorbed on the SiO2.24
3.5 Surface reaction
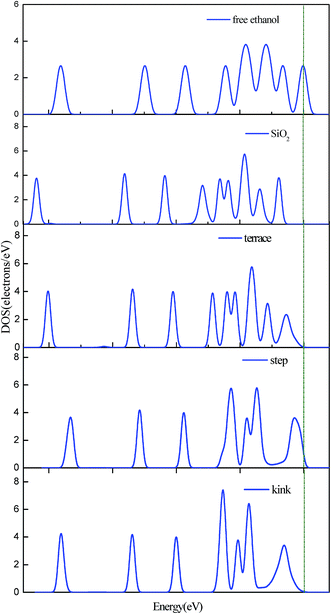
From the above analysis, we can conclude that the reaction of ethanol to ethoxy group on three surfaces show activity increasing from flat < step < kink, which agrees with the PDOS analysis. Branda et al. also draw the conclusion that the adsorption of ethanol on the flat surface is weak and ethanol shows dissociative adsorption on low coordination.17,32
Fig. 13(a) shows the potential energy curve for the ethanol dehydrogenation to the ethoxy group on stepped MgO surface. The C–H bond is elongated to 2.084 Å at the TS from the initial length of 1.113 Å, while it is further elongated to 2.977 Å in the final state. The distance of H in the ethoxy group to O in stepped MgO surface decreases gradually, until finally reaching 0.997 Å. The reaction barrier is 1.30 eV, and the reaction energy is −1.19 eV, indicating an exothermic reaction.
 | ||
| Fig. 13 Potential energy curve for the ethanol dehydrogenation to ethoxy group on stepped and kinked MgO surface. | ||
Fig. 13(b) shows the potential energy curve for the ethanol dehydrogenation to the ethoxy group on kinked MgO surface. The C–H bond is elongated to 1.753 Å at the TS from the initial length of 1.105 Å, while it is further elongated to 1.854 Å in the final state. The distance of H to O, in the ethoxy group on the stepped MgO surface, decreases gradually and finally reaches 0.990 Å. The reaction barrier is 1.42 eV and the reaction energy is −0.33 eV, indicating an exothermic reaction.
4 Conclusions
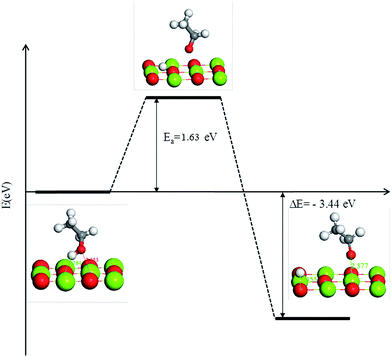
Through the catalysts characteristics and analysis, we have established models of MgO and SiO2 surface structures, especially the three defective structures in MgO. The role of SiO2 in MgO/SiO2 has been recognised, showing that the structural defects of MgO were increased by adding SiO2 in the catalyst, which is in favor for the reaction of dehydrogenation of ethanol to acetaldehyde. It provides theoretical guidance for the improvement of catalyst performance in order to enhance the conversion of ethanol to 1,3-butadiene.The reaction of ethanol dissociation to an ethoxy group was preferable on defective MgO surfaces. The order of adsorption energy of ethanol on three different MgO surfaces is terrace site < step site < kink site. The activation energy for the reaction of ethanol dissociation to an ethoxy group on the flat MgO surface is 1.63 eV, which indicates it is more difficult to react on the flat MgO surface.
The stepped MgO surface is more active for the reaction of dehydrogenation of ethanol to acetaldehyde. The adsorption energy of the ethoxy group on stepped and kinked MgO surface is 1.89 eV and 3.16 eV, respectively. However, the activation energy of dehydrogenation of the ethoxy group to acetaldehyde on stepped MgO surface is 1.30 eV, which is lower than that on the kinked MgO surface (1.42 eV).
Acknowledgements
The authors thank the key laboratory for green chemical technology of ministry of education, for technical assistance.References
- W. White, Butadiene production process overview, Chem.–Biol. Interact., 2007, 166, 10–14 CrossRef CAS PubMed.
- E. V. Makshina, W. Janssens, B. F. Sels and P. A. Jacobs, Catalytic study of the conversion of ethanol into 1,3-butadiene, Catal. Today, 2012, 198, 338–344 CrossRef CAS PubMed.
- Y. Wang and S. J. Liu, Butadiene Production from Ethanol, J. Bioprocess Eng. Biorefinery, 2012, 1, 33–43 CrossRef PubMed.
- K. A. Gray, L. S. Zhao and M. Emptage, Bioethanol, Curr. Opin. Chem. Biol., 2006, 10, 141–146 CrossRef CAS PubMed.
- B. Hahn-Hagerdal, M. Galbe, M. F. Gorwa-Grauslund, G. Liden and G. Zacchi, Bio-ethanol – the fuel of tomorrow from the residues of today, Trends Biotechnol., 2006, 24, 549–556 CrossRef CAS PubMed.
- P. Alvira, E. Tomas-Pejo, M. Ballesteros and M. Negro, Pretreatment technologies for an efficient bioethanol production process based on enzymatic hydrolysis: a review, Bioresour. Technol., 2010, 101, 4851–5486 CrossRef CAS PubMed.
- G. Ezinkwo, V. Tretjakov and R. Talyshinky, Creation of a continuous process for bio-ethanol to butadiene conversion via the use of a process initiator, Catal. Commun., 2014, 43, 207–212 CrossRef CAS PubMed.
- V. L. Sushkevich, I. I. Ivanova, V. V. Ordomsky and E. Taarning, Design of a Metal-Promoted Oxide Catalyst for the Selective Synthesis of Butadiene from Ethanol, ChemSusChem, 2014, 7, 2527–2536 CrossRef CAS PubMed.
- H. J. Chae, T. W. Kim, Y. K. Moon, H. K. Kim, K. E. Jeong, C. U. Kim and S. Y. Jeong, Butadiene production from bioethanol and acetaldehyde over tantalum oxide-supported ordered mesoporous silica catalysts, Appl. Catal., B, 2014, 150, 596–604 CrossRef PubMed.
- B. B. Corson, H. Jones and C. Welling, Butadiene from Ethyl Alcohol: Catalysis in the One-and Two-Stop Processes, Ind. Eng. Chem., 1950, 42, 359–373 CrossRef CAS.
- M. Lewandowski, G. S. Babu, M. Vezzoli, M. D. Jones, R. E. Owen and D. Mattia, Investigations into the conversion of ethanol to 1,3-butadiene using MgO: SiO2 supported catalysts, Catal. Commun., 2014, 49, 25–28 CrossRef CAS PubMed.
- E. V. Makshina, M. Dusselier, W. Janssens, J. Degrève, P. A. Jacobs and B. F. Sels, Review of old chemistry and new catalytic advances in the on-purpose synthesis of butadiene, Chem. Soc. Rev., 2014, 43, 7917–7953 RSC.
- S. V. Lebedev, Y. A. Gorin and S. N. Khutoretzkaya, The mechanism of the catalytic conversion of alcohols into biethylene hydrocarbons, Syntet Kauchuk, 1935, 4, 8–27 CAS.
- H. E. Jones, E. E. Stahly and B. B. Corson, Butadiene from Ethyl Alcohol. Catalysis in the One- and Two-Stop Processes, J. Am. Chem. Soc., 1949, 71, 1822 CrossRef CAS.
- M. X. Gao, Z. Z. Liu, M. H. Zhang and L. Tong, Study on the Mechanism of Butadiene Formation from Ethanol, Catal. Lett., 2014, 144, 2071–2079 CrossRef CAS PubMed.
- L. Tong and Z. Z. Liu, Study on catalytic process of 1,3-butadiene from ethanol on MgO/SiO2 catalyst, Modern Chemical Industry, 2012, 32, 39–42 CAS.
- M. M. Branda, A. H. Rodríguez and P. G. Belelli, Ethanol adsorption on MgO surface with and without defects from a theoretical point of view, Surf. Sci., 2009, 603, 1093–1098 CrossRef CAS PubMed.
- B. Delley, An all-electron numerical method for solving the local density functional for polyatomic molecules, J. Chem. Phys., 1990, 92, 508–517 CrossRef CAS PubMed.
- B. Delley, From molecules to solids with the DMol3 approach, J. Chem. Phys., 2000, 113, 7756–7764 CrossRef CAS PubMed.
- H. J. Monkhorst and J. D. Pack, Special points for Brillouin-zone integrations, Phys. Rev. B: Condens. Matter Mater. Phys., 1976, 13, 5188 CrossRef.
- B. Delley, Hardness conserving semilocal pseudopotentials, Phys. Rev. B: Condens. Matter Mater. Phys., 2002, 66, 155125 CrossRef.
- J. P. Perdew, K. Burke and M. Ernzerhof, Generalized gradient approximation made simple, Phys. Rev. Lett., 1996, 77, 3865 CrossRef CAS.
- S. Coluccia, A. Barton and A. J. Tench, Reactivity of low-coordination sites on the surface of magnesium oxide, J. Chem. Soc., Faraday Trans. 1, 1981, 77, 2203–2207 RSC.
- S. Coluccia, A. J. Tench and R. L. Segall, Surface structure and surface states in magnesium oxide powders, J. Chem. Soc., Faraday Trans. 1, 1979, 75, 1769–1779 RSC.
- D. Jiang and E. A. Carter, First-principles study of the interfacial adhesion between SiO2 and MoSi2, Phys. Rev. B: Condens. Matter Mater. Phys., 2005, 72, 165410 CrossRef.
- D. Ricci and G. Pacchioni, Structure of ultrathin crystalline SiO2 films on Mo (112), Phys. Rev. B: Condens. Matter Mater. Phys., 2004, 69, 161307 CrossRef.
- A. Pelmenschikov, H. Strandh and L. G. Pettersson, Lattice resistance to hydrolysis of Si–O–Si bonds of silicate minerals: ab initio calculations of a single water attack onto the (001) and (111) beta-cristobalite surfaces, J. Phys. Chem. B, 2000, 104, 5779–5783 CrossRef CAS.
- S. Iarlori, D. Ceresoli and M. Bernasconi, Dehydroxylation and silanization of the surfaces of β-cristobalite silica: an ab initio simulation, J. Phys. Chem. B, 2001, 105, 8007–8013 CrossRef CAS.
- K. Refson, R. A. Wogelius, D. G. Fraser, M. C. Payne, M. H. Lee and V. Milman, Water chemisorption and reconstruction of the MgO surface, Phys. Rev. B: Condens. Matter Mater. Phys., 1995, 52, 10823 CrossRef CAS.
- J. A. Rodriguez and A. Maiti, Adsorption and decomposition of H2S on MgO(100), Ni/MgO(100), and ZnO(0001) surface: a first-principles density functional study, J. Phys. Chem. B, 2000, 104, 3630–3638 CrossRef CAS.
- R. W. G. Wyckoff and R. Wyckoff, Crystal Structures, Interscience publishers, New York, 1963, p.102 Search PubMed.
- M. M. Branda, R. M. Ferullo, P. G. Belelli and N. J. Castellani, Methanol Adsorption on Magnesium Oxide Surface with Defects: A DFT Study, Surf. Sci., 2003, 527, 89–99 CrossRef CAS.
| This journal is © The Royal Society of Chemistry 2015 |

