Applications of dynamic electrochemical impedance spectroscopy (DEIS) to evaluate protective coatings formed on AZ31 magnesium alloy

A. Srinivasanab, Kwang Seon Shinb and N. Rajendran*a
aDepartment of Chemistry, College of Engineering Guindy Campus, Anna University, Chennai-600 025, Tamilnadu, India. E-mail: nrajendran@annauniv.edu; Fax: +91-44-22200660; Tel: +91-44-22358659
bMagnesium Technology Innovation Centre, School of Materials Science and Engineering, Seoul National University, 1 Gwanak-ro, Gwanak-gu, Seoul-151-744, Republic of Korea

Received 24th December 2014 , Accepted 10th March 2015

First published on 10th March 2015


Abstract

The present investigation explores the possibility of using dynamic electrochemical impedance spectroscopy (DEIS) to evaluate the corrosion protection of conversion coating produced on an AZ31 alloy in simulated body fluid (SBF). The protection extended by the conversion coating was clearly noticed from an increase in DEIS-impedance and phase angle maximum values.

Development of magnesium (Mg) and its alloys as degradable implant materials is one of the key areas in biomaterials research.1,2 Similar mechanical properties of Mg alloys to those of natural bone are believed to minimize the stress-shielding effect. However, the usage of Mg as a degradable implant material is still limited owing to their highly reactive nature in a body fluid environment. The higher electronegative potential of Mg and its alloys is responsible for the rapid degradation of Mg.3–6

The general cell reactions involved in the Mg dissolution are

 
Mg(s) → Mg2+(aq) + 2e (anodic) (1)
 
2H2O + 2e → 2OH(aq) + H2↑ (cathodic) (2)
 
Mg2+(aq)+ 2OH(aq) → Mg(OH)2 (overall reaction) (3)

The resulting Mg(OH)2 partially covers Mg surface and weakly protect the underneath Mg from aggressive environment containing Cl ions. Therefore, a continuous contact of this environment could accelerate the Mg degradation. The evolution of higher amount of H2 gas due to Mg degradation could isolate the contact of the implant from its environment thereby postpone the bone healing. Hence, it is necessary to control the degradation rate of Mg to facilitate bone healing. Surface modification of Mg materials using chemical conversion coatings is an easy and cost effective method to control their degradation rate.7 Chemical conversion coatings are directly produced on to Mg alloy by immersing in aqueous acidic/basic solutions at ambient/slightly elevated temperature. The formation of corresponding metal salts along with oxides/hydroxides helps in establishing good contact between the substrate and coatings. Several studies are explored on the conversion coated Mg materials for improving their corrosion resistance.8–10 In the present investigation magnesium carbonate conversion coating is produced on to AZ31 Mg at ambient temperature and their protective nature has been evaluated using DEIS. Deliberate conversion of magnesium into magnesium carbonate in bicarbonate solution is tried since the body fluid contains bicarbonate ions. Based on the detailed analysis of available literature, it is confirmed that the usage of DEIS for the evaluation of protective nature of conversion coatings are scandy.11 DEIS was selected to evaluate the protective coatings because the widely used conventional polarization measurement has some discrepancies due to negative differential effect (NDE).12–14 The obtained DEIS responses can be represented in two forms viz., Nyquist and Bode plots which consisting of Magnitude and phase angle plots. In our previous report, we investigated the corrosion behaviour of AZ31 Mg in SBF solution using DEIS-Nyquist response.15 In the present investigation, we have made an attempt to evaluate the protective behaviour of conversion coated AZ31 Mg using DEIS in terms of Bode magnitude and phase angle plots to validate the applicability of DEIS for studying the protective coatings. Bode responses have been emphasised in the present work, because the applied frequency appears in one of the axes, which could give more insight on the dependence of impedance with frequency of the material.

AZ31 Mg alloy (2.83 wt% Al, 0.8 wt% Zn, 0.37 wt% Mn, and balance Mg) was used as substrate material. AZ31 Mg alloys (20 × 15 × 4 mm) were polished up to 2000 # silicon carbide (SiC) emery papers and ultrasonicated in acetone for 15 min, thoroughly washed with double distilled (DD) water, air-dried and used for the chemical conversion coating. The ground samples were immersed in to 50 ml of 5 wt% of NaHCO3 solution taken in a polypropylene tube at 30 °C for 6 h without any agitation (BCTM-5). After 6 h of immersion, the samples were removed from the solution and washed thoroughly with DD water, ultrasonicated until the loosely bound products on the surface were remove and dried using dry air. Surface morphology of the coated samples was observed using JEOL-JSM 6360 scanning electron microscope at an accelerating voltage of 20 kV. Perkin-Elmer spectrometer Spectrum Two was used to obtain attenuated total reflectance infra-red (ATR-IR) spectrum. D8 Advance instrument with Cu Kα source was used for XRD analysis (step height – 0.02°).

DEIS studies were carried out in a conventional three-electrode flat cell as per our previous report.15 A brief about the experimental condition is furnished here. The untreated AZ31 Mg (UT) and BCTM-5 were used as working electrodes (1 cm2). Pt sheet and saturated calomel electrode (SCE) were used as counter and reference electrodes respectively. SBF solution composition reported by Kokubo et al.16 was used as electrolyte. Auto lab PGSTAT 12 Potentiostat/Galvanostat (The Netherlands) has been used for DEIS, the frequency range was from 100 kHz to 0.01 Hz with a sinusoidal perturbation of 10 mV. DEIS studies were carried out with an increment of 30 mV potential in the potential range of −1.65 to −1.20 VSCE. All the potential values mentioned in the present investigation are corresponding to SCE.

Fig. 1a shows the surface morphology of the conversion layer formed onto AZ31 Mg after 6 h of treatment time. The surface was covered with a cracked dry-mud layer and the existence of crack could be attributed to the release of H2 during chemical conversion or the dehydration of the surface layer.17 Fig. 1b and c shows the ATR-IR and XRD pattern of BCTM-5 respectively to confirm the formation of conversion layer. Four major bands appeared around 1490–1380, 1060–1000, 860–865 and 620 cm−1 in ATR-IR are mainly attributed to carbonate (–CO32−) group of MgCO3·3H2O.18,19 The presence of peaks at 22.5°, 24.25°, 32.29°, 34.5°, 57.57° in XRD patterns are attributed to 002, 211, 212, 210, 004 and 314 planes of MgCO3·3H2O.20,21 From the ATR-IR and XRD pattern, the formation of conversion coatings on to AZ31 Mg is confirmed.


image file: c4ra16967k-f1.tif
Fig. 1 (a) SEM surface morphology, (b) ATR-IR spectra and (c) XRD pattern of BCTM-5.

The representation of DEIS results has generally been reported in the form of Nyquist plots.11 Nyquist plot is a complex impedance plot and represented as real impedance component in the X-axis and imaginary impedance component in the Y-axis with applied frequency.22 Though the Nyquist plots provide information about the corrosion behaviour of Mg materials, a direct relationship between the frequency and change in impedance values could not be identified. Therefore, in order to distinguish the change in impedance values with frequency as a function of applied potential, DEIS-Bode plots have been used and emphasised in the present investigation. DEIS-Bode plots viz., magnitude and phase angle plots represent the dependence of impedance (IZI) and phase angle values with the frequency respectively. The change of magnitude and phase angle values with the potential ramp is represented and discussed to explain the UT and BCTM-5 degradation behaviour.

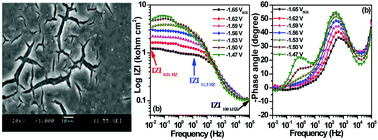
DEIS-Bode magnitude plots of UT and BCTM-5 are given in Fig. 2(a–d). As can be seen from the frequency vs. log IZI plot, the log IZI is found to increase in the high as well as in the low frequency region for both UT and BCTM-5. BCTM-5 (Fig. 2b) exhibited gradual increase in log IZI values, the value is relatively high compared to that of UT and is attributed to the existence of relatively compact conversion layer on the surface and is confirmed from Fig. 1a. Existence of this layer could resist the penetration of aggressive ions and slows down the charge transfer at the coating/substrate interface thereby reduce the Mg(s) → Mg2+(aq) reaction kinetics.15 Whereas in the case of UT (Fig. 2a), the increase of log IZI is attributed to the partial passivation of surface by Mg(OH)2. However, log IZI values significantly reduced as the potential is increased above −1.44 and −1.53 VSCE for BCTM-5 and UT respectively. It is interesting to note that, in the case of BCTM-5, the decrease in log IZI values is shifted to about 0.090 VSCE in positive direction. This shift clearly indicating that, the dissolution of Mg is delayed due to the participation of conversion layer in protecting the substrate. However, when the potential exceeds above −1.41 VSCE, surface film of BCTM-5 rupture due to the attack of aggressive ions in the applied potential and accelerates the Mg dissolution. This phenomenon can be explained based on the existence of micro-cracks in the coatings. The protection extend by the coating could be disturbed since it had micro-cracks. The penetration of aggressive ions would be more in the cracked region thereby accelerate the dissolution rate and clearly distinguished from the decline of IZI values in the positive potentials. Based on obtained results it is understood that, an increase of overall IZI values of BCTM-5 compared to UT can be attributed to the coatings with micro-cracks.


image file: c4ra16967k-f2.tif
Fig. 2 DEIS-Bode magnitude plots of (a & c) UT and (b & d) BCTM-5 as a function of applied potential in SBF solution.

DEIS-Bode phase angle plots of UT and BCTM-5 are given in Fig. 3(a–d) as a function of applied potential. The phase angle plots can be broadly classified in to two regions viz., high and low frequency in the present investigation. The high and low frequency regions provide the relaxation processes at surface layer/electrolyte and substrate/surface layer interfaces respectively.22 An increase in phase angle values in the high frequency region for UT (Fig. 3a and c) and BCTM-5 (Fig. 3b and d) with increased peak area is attributed to the capacitive behaviour. As evidenced from the results, the phase angle values remained increasing up to −1.44 VSCE for BCTM-5. In addition to that, the area under the peak also gradually increased with potential confirming the increase of capacitive behaviour and improvement in corrosion resistance provided by the conversion layer. Similar behaviour is also seen in the case of UT and could be explained based on the formation of surface layer during the application of potential. Furthermore, the phase angle maxima and peak area of BCTM-5 is high compared to that of UT confirming the participation of conversion layer consisting of micro cracks in the protection of substrate surface. The appearance of phase angle peak at low frequency region for BCTM-5 in the potential range between −1.53 to −1.44 VSCE is attributed to the charge transfer between the surface layer and the substrate surface. Similar behaviour was not observed for UT confirming the participation of conversion layer in BCTM-5 and also the uncovered area by the conversion layer could also be oxidized to form Mg(OH)2. Further increase in potential has resulted in a rapid decline of phase angle values at 1000 Hz and remarkable shift in peak position to high frequency confirming the breakdown of the conversion layer.22 The extend of capacitive behaviour could be affected by the micro cracks present in the coatings. Therefore, this could also be one of the reasons for the decline of phase angle values at higher anodic potential. It is also presumed that the decline of phase angle could be shifted to potential that is more anodic if the coatings had less number of micro-cracks. The scattering of the phase values was relatively high in the low frequency region is due to the faster Mg dissolution reaction kinetics at higher potential and rapid formation followed by breakdown of the passive film.


image file: c4ra16967k-f3.tif
Fig. 3 DEIS-Bode phase angle plots of (a & c) UT and (b & d) BCTM-5 as a function of applied potential in SBF solution.

DEIS-Nyquist plots of BCTM-5 are represented in Fig. 4(a–d) in order to compare the results with DEIS-Bode responses. The diameter of the capacitive semi-circles varied significantly as the potential is increased towards positive direction. As can been seen from the plots, the diameter of the high frequency capacitive semi-circle was increased with applied potential. Moreover, the diameter of the BCTM-5 is relatively higher than that of the UT, indicating the reduction of charge transfer by the conversion layer.15 A significant increase in semi-circle diameter was observed in the potential range of −1.53 to −1.44 VSCE is attributed to the presence of conversion layer. An increase in IZI and phase angle maximum in Bode plots are further confirmed the improved corrosion resistance of the coatings compared to UT. The diameter of the high frequency semi-circle disappeared as the potential is increased above −1.44 VSCE in the case of BCTM-5. It shows the breakdown of the surface layer. This could be clearly seen from the rapid decline of IZI value and phase angle values above −1.44 V.


image file: c4ra16967k-f4.tif
Fig. 4 DEIS Nyquist plots of BCTM-5 as a function of applied potential in SBF solution.

log IZI values at three different frequencies viz., IZI100 kHz, IZI11.3 Hz and IZI0.01 Hz were compared in order to clearly distinguish the change in impedance values for UT and BCTM-5 and given in Fig. 5a and b. These three frequencies viz., 100 kHz, 11.3 and 0.01 Hz were selected particularly to attribute electrolyte/surface layer and surface layer/substrate interfaces respectively. A significant increase in IZI11.3 and IZI0.01 Hz was observed for BCTM-5 for the potential up to −1.44 VSCE, which is attributed to the existence of relatively stable conversion layer. This is also further confirmed from the increase of maximum phase angle values (Fig. 5c). Sudden drop in IZI0.01 Hz at −1.41 VSCE could be considered as a critical potential and above which the conversion layer is severely affected and accelerate the rapid degradation of Mg. However, comparing the IZI values of BCTM-5 at different frequency regions with UT clearly indicated the protective nature of the coating. As can be seen in Fig. 5a and b, the IZI11.3 Hz and IZI0.01 Hz values of BCTM-5 with respect to IZI100 kHz is higher compared to UT is due to the protection provided by the conversion layer. In addition to that, the IZI values beyond −1.44 VSCE for BCTM-5 are close to that of the UT indicating the severe attack of the surface by aggressive ions and degradation of conversion layer. Therefore, further increase in potential could only result in the acceleration of Mg dissolution rather than formation of stable passive film. Analysis of phase angle maxima of BCTM-5 and UT provided a good correlation of the capacitive behaviour. A significant increase (2 to 5 fold) in maximum phase angle values from −1.56 to −1.44 VSCE of BCTM-5 (Fig. 5c) confirming the protection extended by the conversion layer.


image file: c4ra16967k-f5.tif
Fig. 5 Comparison of IZI values at different frequency regions (100 kHz, 11.3 Hz and 0.01 Hz); (a) UT and (b) BCTM-5 and (c) comparison of – max. phase angle values of UT and BCTM-5 as a function of applied potential.

The increase in impedance values and phase angle maxima of DEIS bode plots of BCTM-5 compared to UT revealed the protection provided by the conversion layer. The ability to resist the corrosive ions was much better for BCTM-5 compared to UT. However, a sudden drop in impedance values above −1.41 VSCE for BCTM-5 confirmed the breakdown of the conversion layer. Based on these DEIS results, it is concluded that the potential from −1.44 to −1.41 VSCE could be a critical potential region for the breakdown of the conversion layer and onset of corrosion. Further it is quite reasonable to state that DEIS studies could able to predict the existence of conversion layer and its protective nature against corrosive ions attack. A detailed research is under investigation to check the wide applicability of this technique to other protective coatings formed on to Mg and its alloys.

Acknowledgements

Authors A. Srinivasan and N. Rajendran acknowledge the Department of Science and Technology – Science and Engineering Research Board (DST-SERB), New Delhi (SR-SP-01-14, Dt.08.02.2011) for financial support. Author K. S. Shin acknowledges the WPM Program, funded by the Korean Ministry of Trade, Industry and Energy through the Research Institute of Advanced Materials. The facilities provided by DST-FIST and UGC-DRS are gratefully acknowledged.

Notes and references

  1. F. Witte, Acta Biomater., 2010, 6, 1680 CrossRef CAS PubMed.
  2. Y. F. Zheng, X. N. Gu and F. Witte, Mater. Sci. Eng., R, 2014, 77, 1 CrossRef PubMed.
  3. Y. Ding, C. Wen, P. Hodgson and Y. Li, J. Mater. Chem. B, 2014, 2, 1912 RSC.
  4. N. T. Kirkland, N. Birbilis and M. P. Staiger, Acta Biomater., 2012, 8, 925 CrossRef CAS PubMed.
  5. N. T. Kirkland, J. Lespagnol, N. Birbilis and M. P. Staiger, Corros. Sci., 2010, 52, 287 CrossRef CAS PubMed.
  6. A. Atrens, G.-L. Song, F. Cao, Z. Shi and P. K. Bowen, J. Magnesium Alloys, 2013, 1, 177 CrossRef CAS PubMed.
  7. H. Hornberger, S. Virtanen and A. R. Boccaccini, Acta Biomater., 2012, 8, 2442 CrossRef CAS PubMed.
  8. X. B. Chen, D. R. Nisbet, R. W. Li, P. N. Smith, T. B. Abbott, M. A. Easton, D. H. Zhang and N. Birbilis, Acta Biomater., 2014, 10, 1463 CrossRef CAS PubMed.
  9. T. S. N. Sankara Narayanan, I. S. Park and M. H. Lee, J. Mater. Chem. B, 2014, 2, 3365 RSC.
  10. G. Wang, N. Cao and Y. Wang, RSC Adv., 2014, 4, 59772 RSC.
  11. J. Orlikowski and K. Darowicki, Electrochim. Acta, 2011, 56, 7880 CrossRef CAS PubMed.
  12. S. Thomas, N. V. Medhekar, G. S. Frankel and N. Birbilis, Curr. Opin. Solid State Mater. Sci., 2015, 19, 85 CrossRef CAS PubMed.
  13. S. Bender, J. Goellner, A. Heyn and S. Schmigalla, Mater. Corros., 2012, 63, 707 CAS.
  14. M. Taheri, J. R. Kish, N. Birbilis, M. Danaie, E. A. McNally and J. R. McDermid, Electrochim. Acta, 2014, 116, 396 CrossRef CAS PubMed.
  15. A. Srinivasan, K. S. Shin and N. Rajendran, RSC Adv., 2014, 4, 27791 RSC.
  16. T. Kokubo and H. Takadama, Biomaterials, 2006, 27, 2907 CrossRef CAS PubMed.
  17. S. Feliu Jr, A. Samaniego, A. A. El-Hadad and I. Llorente, Corros. Sci., 2013, 67, 204 CrossRef PubMed.
  18. S. Frykstrand, J. Forsgren, A. Mihranyan and M. Strømme, Microporous Mesoporous Mater., 2014, 190, 99 CrossRef CAS PubMed.
  19. H. Kwon and D. G. Park, Bull. Korean Chem. Soc., 2009, 30, 2567 CrossRef CAS.
  20. Z. Hao, J. Pan and F. Du, Mater. Lett., 2009, 63, 985 CrossRef CAS PubMed.
  21. W. Cheng, Z. Li and G. P. Demopoulos, Chin. J. Chem. Eng., 2009, 17, 661 CrossRef CAS.
  22. American Society for Testing and Materials STP 1188, ed. J. R. Scully, D. C. Silverman and M. W. Kendig, Philadelphia, 1993, p. 407 Search PubMed.

This journal is © The Royal Society of Chemistry 2015
Click here to see how this site uses Cookies. View our privacy policy here.