DOI:
10.1039/C4RA16966B
(Paper)
RSC Adv., 2015,
5, 18391-18400
Thermal expansion tensors, Grüneisen parameters and phonon velocities of bulk MT2 (M = W and Mo; T = S and Se) from first principles calculations
Received
24th December 2014
, Accepted 6th February 2015
First published on 6th February 2015
Abstract
We calculated the phonon spectra of several 2H-MT2 structures using the density functional perturbation theory (DFPT). The symmetry properties of phonon modes are analyzed. The mode-Grüneisen parameters and phonon velocities are calculated using phonon spectra. All the investigated structures show very large phase velocities (>10![[thin space (1/6-em)]](https://www.rsc.org/images/entities/char_2009.gif) 000 m s−1) and small group velocities (<600 m s−1). The macroscopic Grüneisen parameter of the [001] direction is larger than that of the [010] direction for 2H-MT2 phases. The volumetric and linear thermal expansion coefficients are evaluated using the quasi-harmonic approximation (QHA) between 0 K and 1100 K. The negative thermal expansion coefficients are discovered in the 2H-WS2 structure. Our results show that the properties in the [001] direction are very different to the [010] direction, because of the significant difference in the chemical bonding in the two crystallographic directions for these layered materials.
000 m s−1) and small group velocities (<600 m s−1). The macroscopic Grüneisen parameter of the [001] direction is larger than that of the [010] direction for 2H-MT2 phases. The volumetric and linear thermal expansion coefficients are evaluated using the quasi-harmonic approximation (QHA) between 0 K and 1100 K. The negative thermal expansion coefficients are discovered in the 2H-WS2 structure. Our results show that the properties in the [001] direction are very different to the [010] direction, because of the significant difference in the chemical bonding in the two crystallographic directions for these layered materials.
1. Introduction
During the past few years, a widespread interest in the structural, optical, electrical, magnetic, and superconducting properties of transition metal-dichalcogenide layered compounds has evolved. These compounds have the universal formula MT2, where M is a transition-metal atom from the group IVB, VB, or VIB columns in the Periodic Table and T is one of the chalcogens, i.e., sulfur, selenium, or tellurium.
Transition-metal dichalcogenide, 2H-MT2, a typical member of the transition metal chalcogenide family, consists of alternating sandwiched sub-layers bonded by van der Waals (vdW) interactions.1 Structurally, these compounds can be regarded as strongly bonded two-dimensional T–M–T layers or sandwiches which are loosely coupled to one another by relatively weak van der Waals-type forces. Within a single T–M–T layer, the T and X atoms form two-dimensional hexagonal arrays. Depending on the relative alignment of the two T-atom sheets within a single T–M–T sheet, two distinct two-dimensional crystal structures are obtained. Van der Waals interactions may enhance some intriguing properties such as the suppressing of electrical transport properties and thermal conductivity in the direction perpendicular to T–M–T layer.2–4 This sandwich-like structure is also responsible for their peculiar electronic and mechanical properties that make these materials suitable for applications as super-lubricants,5 ultralow thermal conductivity devices,3,6 catalysts,7 and solar cell converters.8 Very recently, it has been demonstrated that some semiconducting MT2 structure show the excellent intra-layer electronic mobility, which are suitable for the fabrication of electronic devices, such as transistors.9,10 In experiments, high quality single crystals were grown by chemical vapor transport (CVT) method.11,12 The linear thermal expansion coefficients of 2H-MoS2, 2H-MoSe2 and 2H-WSe2 have been measured before.13,14 Brixner15 reported the linear TECs for Ta doped 2H-WSe2. Matthäus and coworkers16 provided the linear TECs of 2H-WS2. Besides 2H-WS2, the linear thermal expansion coefficient of [001] direction is greater than that of [100] direction in other 2H-MT2 phases. Very recently, the Raman spectroscopic study has been applied to 2H-MT2 (M = Mo, W; T = S, Se) crystals under high pressure and temperature.17–19 Thermoelectric properties of monolayer and multilayer MT2 (M = Mo, W and T = S, Se) have been investigated in experiments and theoretical calculations.20–28 Huang,26 Cai27 and Ataca et al.28 calculated the phonon spectrum, mode Grüneisen parameters, phonon velocities and thermal conductivity of monolayer MoS2.
However, many thermal properties of bulk 2H-MT2 (M = W and Mo; X = S and Se) are lack of theoretical studies at the moment. Most theoretical calculations are mainly focused on the electronic structures and optical properties of mono-layer or multi-layer 2H-MT2 phases. The accuracy and validity of standard quasi-harmonic treatment of thermal properties of them have not been studied yet. In addition, the anisotropy of heat transportation in those layered materials can be revealed by investigating their phonon spectra, phonon velocities and Grüneisen parameters.
In this paper, phonon dispersions, thermal expansion tensors, mode Grüneisen parameters and phonon sound velocities of bulk 2H-MX2 (M = W and Mo; T = S and Se) are calculated using first-principles simulations.
2. Computational details and methods
2.1 DFT calculations
All first principles calculations were performed using the plane wave method implemented in CASTEP code.29 We used 400 eV for the plane wave expansion in reciprocal space. The norm-conserving type pseudopotentials (NCPPs) were employed to describe the Coulomb interactions between the valence electrons and pseudo-ion core.30 For W, Mo, S and Se atoms, the valence electron configurations were 5d46s2, 4d55s1, 3s23p4 and 4s24p4. The exchange–correlation energy was computed by the standard local density approximation (LDA) using CA–PZ approximation.31 LDA usually overbinds solid and thus underestimates the lattice constants. However, for many layered materials where the van der Waals interactions play the important role for the equilibrium geometry, LDA accidentally gives reasonable equilibrium structural parameters such as lattice constants and inter-layer distance.32 For the geometry optimization, a 13 × 13 × 6 k-point grid, which is generated by Monkhorst–Pack method,33 was applied to all 2H-MT2 structures. The crystal structures were fully relaxed, including the lattice constants and atomic positions. Using the current computational parameters, we found that total energy was converged to 2 × 10⁻⁵ eV per atom, and the forces acting on each atom was reduced to 0.05 eV Å−1. The phonon spectra of 2H-MT2 structures were calculated by density functional perturbation theory (DFPT) in the same code.29 The force constants were evaluated using 63k sampling points in the first Brillouin zone, and which is equivalent to a 9 × 9 × 2 k-point mesh. In order to get the fine structure of phonon dispersion, the 18 × 18 × 5 k-grid was used to interpolate the phonon spectrum. Other parameters were identical to those employed for geometry optimization. Finally, it is worth mentioning that there is a strong concerning of using pseudopotentials in the phonon calculations, regarding their accuracy.34 This might be an issue in condensed solid at ultra-high pressure. However, in our case, all phonon calculations were carried out only for structures slightly deviated from the equilibrium one. Under such condition, the difference between all-electron and pseudopotential calculations is expected to be negligible.
Besides the phonon spectra, all other thermal properties were calculated using the home-made programs.
2.2 Thermal expansion coefficients (TECs)
The quasi-harmonic approximation (QHA) was used to evaluate the TECs for bulk MT2 phases. In QHA, the total Helmholtz free energy of an insulating crystal structure is given as| |
 | (1) |
where, E0 represents the total energy at 0 K obtained from a static DFT calculation; the second term in eqn (1) refers to the zero point energy, and the third terms is the Helmholtz free energy of lattice vibrations. The latter two terms are related to the phonon density of states (PDOS) and phonon angular frequency, indicating by g(ω) and ω, respectively. The volume dependence of F(V, T) comes from all three terms on the right hand side of the eqn (1). Minimizing the Helmholtz free energy with respect to cell volume as a function of temperature gives the equilibrium volumes at different temperatures. This can be easily realized by fitting Birch–Murnaghan isothermal third order equation of state to energy versus volume curve.35 Therefore, the volumetric thermal expansion coefficient is obtained from eqn (2).
In the eqn (2), V0 is the equilibrium volume at 0 K, including the zero point energy in the energy versus volume curve. The volumetric thermal expansion coefficient (α(T)) is relevant to the linear thermal expansion tensor (αij(T)) by the following relationship.36
| |
 | (3) |
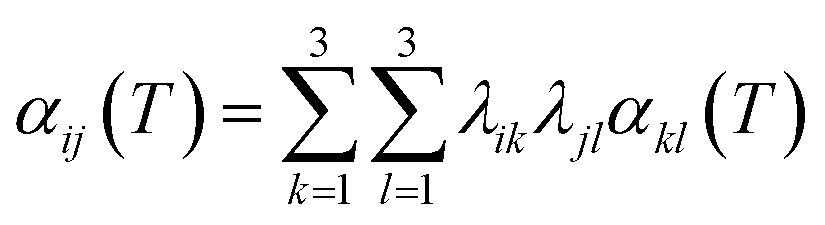
All 2H-MT2 structures possess the hexagonal symmetry (point group: D6h), employing the Neumann's principle to simplify the linear thermal expansion tensor results in the matrix given by eqn (4).
| |
 | (4) |
For hexagonal symmetry, the three diagonal elements are non-zero, and the total number of independent components is just two. The anisotropy in the linear thermal expansions can be easily illustrated by
| |
 | (5) |
here, the directional cosines are given by the 3 × 3 matrix
λik. Finally, we should note that the linear thermal expansion tensor is defined as
| | |
ai(T) = (1 + αij(T)T)aj(T0)
| (6) |
where,
ai(
T) is the
i component of lattice vector at temperature
T; meanwhile,
aj(
T0) is a similar quantity defined at a reference temperature
T0.
2.3 Grüneisen parameters and phonon velocities
The Grüneisen parameters of a crystal structure indicate its anharmonic effects in the phonon spectrum due to the change of cell volume. In this paper, we will address two important Grüneisen parameters, i.e., the phonon-mode Grüneisen constant (γ(ωi)) and macroscopic Grüneisen parameter (γ). The former one sometimes also refers to microscopic Grüneisen parameter, and which is computed from the phonon spectra by the following expression.| |
 | (7) |
where, ωi represents the phonon mode i with angular frequency ω, and V is the cell volume. Meanwhile, ω0,i and V0 refer to the values of equilibrium geometry. We can see from eqn (8) that the microscopic Grüneisen constant is defined for each individual phonon frequency, and from where the macroscopic one can be obtained as| |
 | (8) |
here, the mode specific heat is calculated by| |
 | (9) |
The phonon sound velocities are relevant to the phonon transportation in the bulk crystal of 2H-MT2 compounds, and their values are usually used to estimate the phonon relaxation time due to Umklapp scattering mechanism.37 Therefore, we calculated the phase and group velocities of 2H-MT2 compounds using the obtained phonon spectra from DFPT method. The two phonon related velocities are defined as
| |
 | (10) |
For the layered materials such as graphite and 2H-MT2 crystals, we expect that both Grüneisen parameters and phonon velocities should show strong anisotropic properties with respect to the crystal orientation.38
3. Results and discussions
3.1 Lattice parameters
In Fig. 1, we show the obtained energy versus volume curves for 2H-MoS2 and 2H-WS2 structures. For the former phase, the zero point energy (ZPE) and Helmholtz free energy were also calculated using the empirical Debye–Slater model.39 One can compare the QHA results with those of Debye–Slater method. Firstly, it is found that the zero point energy at each volume is significantly overestimated. The trend has also been reported in some previous works.40 Meanwhile, the Helmholtz free energy is overestimated at finite temperature as well, compared to QHA profile. Our calculations indicate the reliability of Debye–Slater model is highly questionable in those 2H-MT2 phases. Recently, the similar issue of empirical Debye model has also been addressed by Sarker and coworkers in their work.34 Therefore, our results shown in this paper were computed using more accurate QHA method.
 |
| | Fig. 1 The energy versus volume curves computed using QHA and empirical Debye–Slater model for 2H-MoS2 (a) and QHA only for 2H-WS2 (b) Birch-Murnaghan isothermal third order equation of state is employed to fit to QHA data for both structures. | |
The optimized lattice parameters are shown in Table 1. The zero point energy (ZPE) can be included in the obtained energy versus volume curve. As can be seen from Table 1, the main effect of ZPE on lattice parameters is the increasing of their values even at 0 K. Moreover, the ZPE corrected lattice constants of all 2H-MT2 structures are in better agreement with experiments than those given in the parentheses. The latter results were obtained directly by LDA method, and which have been employed in the subsequent phonon calculations.
Table 1 Lattice parameters of 2H-MT2 phases. The values in parentheses are optimized using LDA without including the zero point energy at 0 K
| Structure |
a |
c |
c/a |
| Ref. 14. Ref. 16. |
| MoS2 |
3.1789 |
12.2469 |
3.8526 |
| (3.1227) |
(12.0308) |
3.8904a |
| 3.1622a |
12.3024a |
|
| MoSe2 |
3.2838 |
12.9526 |
3.9444 |
| (3.2459) |
(12.8031) |
3.9295a |
| 3.2920a |
12.9360a |
|
| WS2 |
3.1454 |
12.2181 |
3.8845 |
| (3.1232) |
(12.1319) |
3.9195b |
| 3.154b |
12.362b |
|
| WSe2 |
3.2675 |
12.9381 |
3.9595 |
| (3.2437) |
(12.8436) |
3.9503a |
| 3.2774a |
12.9467a |
|
3.2 Phonon spectra of 2H-MT2 (M = W, Mo; T = S, Se)
Since all 2H-MT2 compounds studied in our paper are crystallized into the hexagonal crystal class with point group D6h, the phonon spectra are calculated along a special path A (0 0 0.5)-Γ (0 0 0)-M (0 0.5 0) in the first Brillouin zone, including the two principal directions, i.e., [001] and [010] axes. This path also allows us to study the anisotropic properties of phonon spectrum and other derived parameters straightforwardly. The unit cell of 2H-MT2 structures has two formula units and 6 atoms. There are 18 phonon normal modes at each k wave vector. At Γ point, the wave vector has the full symmetry of 2H-MT2 crystal structure (D6h), the reducible representation consisting of 18 normal phonon modes can be written as a sum of irreducible representations by eqn (12).| | |
Γ18(D6h) = Γ1+(A1g) + Γ4−(B1u) + Γ6+(E1g) + Γ5−(E2u) + 2Γ3+(B2g) + 2Γ5+(E2g) + 2Γ2−(A2u) + 2Γ6−(E1u)
| (12) |
The symmetry of other special k wave vectors is usually lower than that of Γ point. However, in the case of hexagonal crystal class, the point group of A (0 0 0.5) is the same as Γ point. On the other hand, the symmetry of M (0 0.5 0) point is D2h, a subgroup of parent point group D6h. Similar to eqn (12), the relationships for A and M points are given as
| | |
A18 = 3A3 + 3(A1, A2)
| (13) |
| | |
M18 = 3M1+ + 3M4+ + 3M2− + 3M3− + 2M2+ + 2M4− + M1− + M3+
| (14) |
We should note that A3 is a four-dimensional irreducible representation and A1 and A2 are one-dimensional types. All irreducible representations at M point are one-dimensional type. The Miller and Love notations for the irreducible representations will be used throughout this paper. The ISOTROPY program is employed here for the symmetry analysis.41 For the convenience, the Mulliken notation is also given in eqn (12) at Γ point.
The calculated phonon spectra are shown in Fig. 2, including the irreducible representations of phonon modes at A, M and Γ points. Due to the structural similarity, the phonon spectra of 2H-MT2 compounds fairly resemble each other, especially for the low-frequency part below the phonon band gap in each spectrum. Interestingly, two optical phonon dispersions show much lower frequencies than other optical branches, mixing up with acoustic branches at some k points in the Brillouin zone. These two low-frequency phonon branches are the unique feature of bulk 2H-MT2 crystal, and which are not shown up in a single-layer MT2 phase.27 At Γ point, the two lowest optical phonon modes denoted as Γ5+ and Γ3+ are referred to shear (S) and compression (C) modes. The S and C modes can be observed in fewer-layer MT2 phase. The eigenvectors of S and C modes are illustrated in Fig. 3 for 2H-MoS2 phase as an example. We can clearly see that both modes are relevant to the inter-layer interactions rather than intra-layer chemical bonding, because the intra-layer atomic displacements are always in phase. It is also known that the inter-layer bonding mechanism is mainly van der Waals interactions in bulk 2H-MT2 phases. Thus, the phonon frequencies of S and C modes are very small, compared to other optical modes. Besides Γ point, the eigenvectors at other k points are the complex numbers. We may also plot the vibrational patterns for S and C modes at A and M points using the real part of phonon eigenvectors, it is found that only one MT2 layer is involved in the vibration. The frequencies of optical modes are sensitive to the atomic weight difference between transition metal (W and Mo) and chalcogen (S and Se), and which can be clearly seen from Fig. 2, as the change of the ordering of the irreducible representations for phonon modes. The detailed discussions about the IR or Raman activities of 2H-MT2 bulk phases and single-layer MT2 structures are given in ref. 42 and 43.
 |
| | Fig. 2 The phonon spectra and irreducible representations of phonon modes at A, Γ and M points are shown for (a): 2H-MoS2; (b): 2H-MoSe2; (c): 2H-WS2; (d): 2H-WSe2. Note that the path Γ–A refers to [001] direction, and Γ–M is parallel to [010] direction. | |
 |
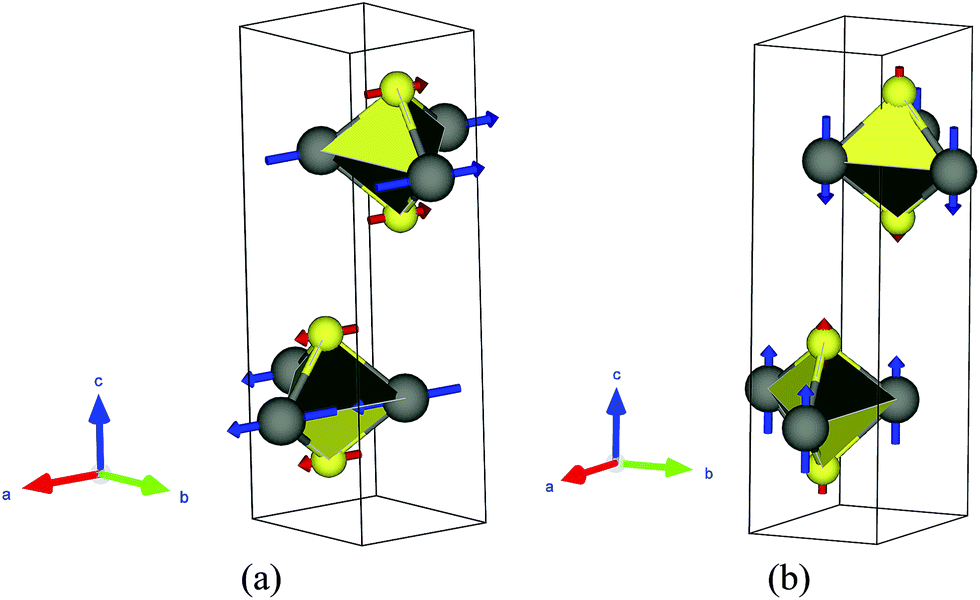
| | Fig. 3 Phonon eigenvectors for two special modes. (a): Shear mode (Γ5+); (b): compression mode (Γ3+). The big-gray balls are transition metals (W and Mo), and the small-yellow balls represent chalcogens (S and Se). The VESTA code is used for the visualization of vibration patterns. | |
3.3 Grüneisen parameters
The mode Grüneisen constants are shown in Fig. 4 for 2H-MT2 structures as a function of phonon frequency using eqn (7). In the calculations, the cell volume of each 2H-MT2 phase was changed by ±%1 near the equilibrium value. The phonon spectra of the deformed cells were evaluated in a similar way to the equilibrium case. The finite difference method was then used to compute the mode Grüneisen constant for each individual phonon mode. Usually, the phonon frequency decreases with the increasing of cell volume, because the force constants between atomic pairs in the crystal structure are reduced due to the volume expansion. Thus, γ(ω) should be a positive number. As can be seen in Fig. 4, all γ(ω) values are positive for 2H-MSe2 (M = W and Mo) phases. Indeed, the results are consistent with the above simple augment. Meanwhile, most γ(ω) values are also positive in 2H-MoS2, but we also find fewer negative values in the acoustic branches. On the other hand, 2H-WS2 phase has a large number of phonon modes with negative γ(ω) values, and all of them are seen in both acoustic and optical branches. The most negative γ(ω) values are found in S and C optical branches. As shown in Fig. 3, S and C branches correspond to the inter-layer vibrations. The observed negative γ(ω) seems to be relevant to the long-pair of chalcogen anion. The electrostatic interaction between two long-pair electrons is mainly repulsive, and the reduction of it is expected as a result of volume expansion. Moreover, the equilibrium lattice constants of 2H-MSe2 (M = W and Mo) are significantly bigger than those of 2H-MS2 (M = W and Mo) structures. However, both acoustic and S + C branches become negative by expanding the cell volume further away from the equilibrium value, indicating that there exists a dedicated balance between long-pair repulsion and inter-layer van der Waals interactions in 2H-WS2 crystal structure. Meanwhile, 2H-WS2 phase also has the largest γ(ω) value among all 2H-MT2 compounds.
 |
| | Fig. 4 Phonon mode Grüneisen parameters of 2H-MT2 phases. (a): 2H-MoS2; (b): 2H-MoSe2; (c): 2H-WS2; (d): 2H-WSe2. The color map is consistent with the increasing of phonon frequency. | |
The macroscopic Grüneisen parameters of 2H-MT2 phases are calculated by eqn (8) and the results are illustrated in Fig. 5 for [010] and [001] directions. Obviously, the Grüneisen parameter decreases rapidly with the temperature at first due to the increasing of phonon mode specific heat. Above the characteristic Debye temperature, it has no dependence upon the temperature. For all 2H-MT2 phases, the intra-layer γ(T) is smaller than that of inter-layer. The observed anisotropy in macroscopic Grüneisen parameters is consistent with the fact that the intra-layer chemical bonding property is very different to that of inter-layer. The macroscopic Grüneisen parameters of many 2H-MT2 compounds are not well understood both in experiments and theoretical calculations. Therefore, the direct comparison of our results with them is impossible.
 |
| | Fig. 5 The macroscopic Grüneisen parameters of 2H-MT2 structures in two crystallographic directions. (a): [010] direction; (b): [001] direction. | |
3.4 Phonon velocities
Phonon velocities are closely relevant to the thermal conductivity of a solid. The anisotropy in phonon velocity also indicates the same information for the latter property. In the present work, we have calculated the phase and group velocities of each 2H-MT2 phase using phonon spectrum. Considering the hexagonal symmetry of the crystal structure and the weak inter-layer interactions, one can expect that the phonon velocities in [001] direction are significantly different from those propagating on (001) plane. In Fig. 6, the phonon velocities of 2H-MoS2 are illustrated as a function of frequency. The results of other 2H-MT2 structures are omitted for the brevity. First of all, we find that phonon phase velocities for optical modes can be very large (10000 m s−1–20000 m s−1). Meanwhile, the phase velocities of acoustic phonons and S + C branches are one order of magnitude smaller than those of optical modes. On the other hand, the group velocities of optical phonons are less than 400 m s−1 in 2H-MoS2, and which are 20–40 times smaller than the corresponding phase velocities in the same frequency range. Moreover, the difference between optical and acoustic phonons in the group velocity is not as significant as phase velocity. Those results can be easily understood from eqn (10) and (11). The phase velocity is directly proportional to phonon frequency: the larger the phonon frequency is, the bigger the phase velocity. In contrast, the group velocity is determined by the slope of phonon dispersion. For acoustic phonons, phase and group velocities are the same in the low frequency limit (ω → 0).
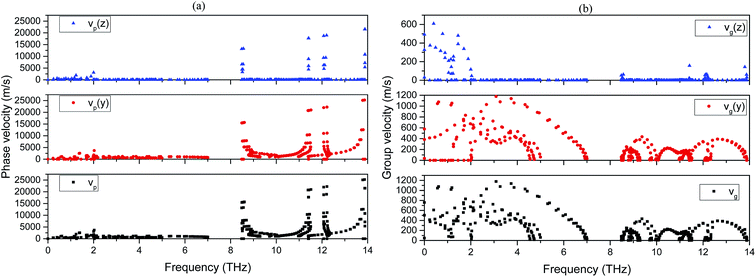 |
| | Fig. 6 Phonon velocities of 2H-MoS2. (a): Phase velocities; (b): group velocities. | |
The strong anisotropy in group and phase phonon velocities is also revealed clearly in Fig. 6. In the figure, we plot phonon velocities in [001] (z) and [010] (y) directions for 2H-MoS2. The optical phonon dispersions in [001] direction show very week dependence on k vectors. As a result, the phonon velocities are high localized near certain frequencies. On the other hand, we can see the more delocalized distribution of phonon velocities in [010] direction as a function of frequency. The anisotropy in phonon velocities has significant effect on the lattice thermal conductivity.37 Experimentally, it is known that the intra-layer thermal conductivity can be several orders of magnitude greater than that of inter-layer direction for van der Waals bound layered materials.38
3.5 Thermal expansion coefficients
The volumetric and linear thermal expansion coefficients are shown in Fig. 7 for all studied 2H-MT2 structures. In our approach, the linear TECs are calculated by the following expressions:| |
 | (15) |
| | |
2a[010](T) + a[001](T) = a(T)
| (16) |
where, the linear TEC in i direction is represented by ai(T), while 〈γi(T)〉 refers to the mean Grüneisen constant in the same direction, computed from Fig. 5 for T > 200 K. The linear TECs can also be calculated using the ratio of linear compressibility in the similar way,44 but the dependence of elastic constants on the temperature must be evaluated first.
 |
| | Fig. 7 The volumetric and linear thermal expansion coefficients of 2H-MT2 structures are calculated using QHA between 0 K to 1100 K. (a): 2H-MoS2; (b): 2H-MoSe2; (c): 2H-WS2; (d): 2H-WSe2. The experimental values are indicated by the symbols. | |
In Table 2, the mean values of thermal expansion coefficients and Grüneisen parameters are given. We also compare the calculated results with experiments. Murray and Evans13 have measured the lattice constants of 2H-MoS2 and 2H-WSe2 between 10 and 320 K, and then linear TECs were calculated. In another work, Evans et al.14 reported the linear TECs for 2H-MoS2, 2H-MoSe2 and 2H-WSe2 between 20 and 800 °C. Brixner15 calculated the linear TECs of W0.97Ta0.03Se2 from the measured lattice parameters between 25 and 600 °C. For 2H-MoS2, the computed TEC in [010] direction is larger than experiments. Meanwhile, the volumetric and linear TECs in [001] direction are fallen in the range of measured values.13,14 The calculated TECs of 2H-MoSe2 are in agreement with ref. 14. In the case of 2H-WSe2, the calculated TEC in [010] direction is very close to the value reported in ref. 15. However, the value is significantly smaller than those given by Evans and coworkers.13,14 For the same structure, our value in [001] direction is fairly in agreement with experiments especially with ref. 13. The great discrepancies between the calculations and experimental results are seen for 2H-WS2. Our prediction shows that it has the negative thermal expansion coefficients. On the other hand, ref. 16 implies a normal thermal expansion behavior. We should note that TECs of 2H-WS2 are small, compared with 2H-MoS2, 2H-MoSe2 and 2H-WSe2. The errors in either QHA calculation or experiment can change the sign of TECs in this structure. In Section 3.3, we showed that this phase has a larger number of negative mode Grüneisen constant. This is the main reason why the TECs of 2H-WS2 are negative. The reported TECs of 2H-WS2 in ref. 16 are also suspicious, i.e., the linear TEC in [010] direction is nearly two times larger than that of [001] direction. Therefore, the more accurate experimental data are needed for 2H-WS2 in order to make the final judgment on QHA results.
Table 2 The mean values for Grüneisen parameters and thermal expansion coefficients above 200 K. The experimental results are also given for some 2H-MT2 phases
| Structure |
〈γ[010](T)〉 |
〈γ[001](T)〉 |
〈a[010](T)〉 (10−5 K−1) |
〈a[001](T)〉 (10−5 K−1) |
〈a(T)〉 (10−5 K−1) |
| Ref. 13. Ref. 14. Ref. 15. Ref. 16. |
| MoS2 |
0.6869 |
1.1615 |
0.6618 |
1.1184 |
2.4422 |
| 0.4922a |
1.858a |
2.8424a |
| 0.19b |
0.865b |
1.245b |
| MoSe2 |
0.8027 |
1.7195 |
0.6435 |
1.3781 |
2.6651 |
| 0.724b |
1.293b |
2.741b |
| WS2 |
0.9176 |
2.1707 |
−0.1470 |
−0.3759 |
−0.6419 |
| 0.635d |
0.326d |
1.596d |
| WSe2 |
0.7746 |
1.8585 |
0.5501 |
1.3195 |
2.4198 |
| 1.445a |
1.374a |
4.264a |
| 1.108b |
1.672b |
3.888b |
| 0.682c |
1.056c |
2.42c |
Using eqn (5) and the mean TECs provided in Table 2, the anisotropy in TEC tensor is illustrated in Fig. 8. For 2H-MoS2, the experimental contours show stronger anisotropic character than our calculated one, i.e., the a[001](T)/a[010](T) > 3 in ref. 13 and 14, and it is smaller than 2 in this work. The excellent agreement between experiment and theoretical calculation is seen for 2H-MoSe2. In the case of 2H-WSe2, all experimental values indicate the relatively weak anisotropy in thermal expansion tensor, compared to QHA result. Although, we also show the 2-D contours for 2H-WS2, the direct comparison between ref. 16 and our profile should not be considered as the main purpose here.
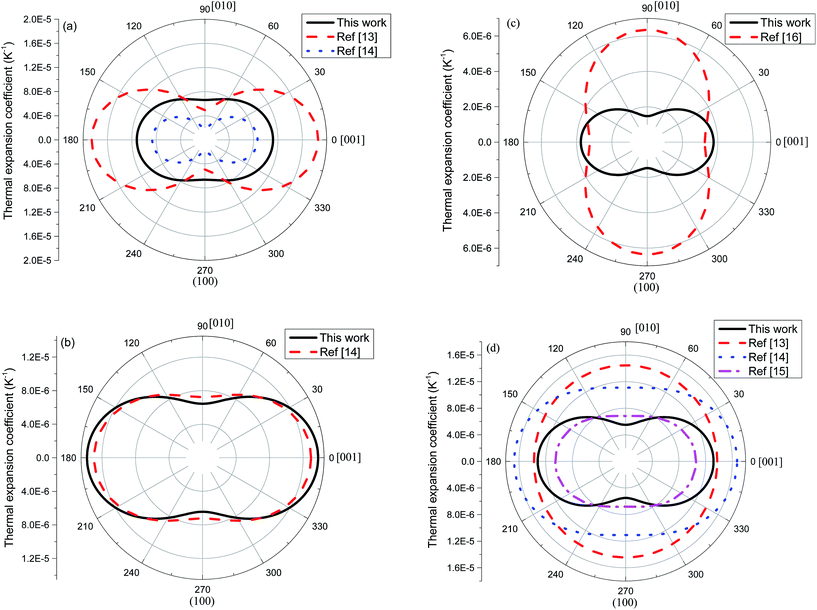 |
| | Fig. 8 Two-dimensional polar plot of linear thermal expansion coefficient on (100) plane. For 2H-WS2, we use the absolute values of the TEC tensor components in the calculation. | |
4. Conclusions
All bulk 2H-MT2 crystals shows the strong anisotropy in the chemical bonding due to their layered structures. This is considered as the main reason why other calculated properties such as phonon spectra, Grüneisen parameters, phonon velocities and thermal expansion tensor show the anisotropic features. Our calculations on those system provided the valuable numerical evidence to support this augment. Furthermore, the thermal conductivity is closely relevant to mode-Grüneisen parameters and phonon velocities. Therefore, our next step will be the calculation of thermal conductivity for those materials using the appropriate approach from the information obtained in the current work.
Acknowledgements
We thank the Institute of Solid State Physics & School of Physics and Electronic Engineering of Sichuan Normal University for the computational support. This work is supported by Foundation of Department of Education of Sichuan Province (Grant no. 10ZA160) and Project supported by the Science Foundation of CUIT (Grant no. KYTZ201035 and J201220).
References
- J. L. Verble and T. J. Wieting, Phys. Rev. Lett., 1970, 25, 362 CrossRef CAS
 .
. - M. Agarwal and L. Talele, Solid State Commun., 1986, 59, 549 CrossRef CAS .
- J. Y. Kim, S. M. Choi, W.-S. Seo and W.-S. Cho, Bull. Korean Chem. Soc., 2010, 31, 3225 CrossRef CAS .
- A. N. Gandi and U. Schwingenschlögl, Chem. Mater., 2014, 26, 6628 CrossRef CAS .
- C. Lee, Q. Li, W. Kalb, X.-Z. Liu, H. Berger, R. W. Carpick and J. Hone, Science, 2010, 328, 76 CrossRef CAS PubMed .
- C. Chiritescu, D. G. Cahill, N. Nguyen, D. Johnson, A. Bodapati, P. Keblinski and P. Zschack, Science, 2007, 315, 351 CrossRef CAS PubMed .
- C. A. Reed and S. K. Cheung, Proc. Natl. Acad. Sci. U. S. A., 1977, 74, 1780 CrossRef CAS .
- J. Puthussery, S. Seefeld, N. Berry, M. Gibbs and M. Law, J. Am. Chem. Soc., 2011, 133, 716 CrossRef CAS PubMed .
- B. Radisavljevic, A. Radenovic, J. Brivio, V. Giacometti and A. Kis, Nat. Nanotechnol., 2011, 6, 147 CrossRef CAS PubMed .
- S. Larentis, B. Fallahazad and E. Tutuc, Appl. Phys. Lett., 2012, 101, 223104 CrossRef PubMed .
- A. Ubaldini, J. Jacimovic, N. Ubrig and E. Giannini, Cryst. Growth Des., 2013, 13, 4453 CAS .
- A. Ubaldini and E. Giannini, J. Cryst. Growth, 2014, 401, 878 CrossRef CAS PubMed .
- R. Murray and B. Evans, J. Appl. Crystallogr., 1979, 12, 312 CrossRef CAS .
- S. H. El-Mahalawy and B. L. Evans, J. Appl. Crystallogr., 1976, 9, 403 CrossRef .
- L. H. Brixner, J. Electrochem. Soc., 1963, 110, 289 CrossRef PubMed .
- A. Matthäus, A. Ennaoui, S. Fiechter, S. Tiefenbacher, T. Kiesewetter, K. Diesner, I. Sieber, W. Jaegermann, T. Tsirlina and R. Tenne, J. Electrochem. Soc., 1997, 144, 1013 CrossRef PubMed .
- S. V. Bhatt, M. P. Deshpande, V. Sathe, R. Rao and S. H. Chaki, J. Raman Spectrosc., 2014, 45, 971 CrossRef CAS .
- D. Fan, J. Xu, M. Ma, J. Liu and H. Xie, Phys. B, 2014, 451, 53 CrossRef CAS PubMed .
- B. C. Windom, W. G. Sawyer and D. W. Hahn, Tribol. Lett., 2011, 42, 301 CrossRef CAS .
- W. Huang, H. X. Da and G. C. Liang, J. Appl. Phys., 2013, 113, 104304 CrossRef PubMed .
- C. Denir, F. M. Peeters and C. Sevik, Appl. Phys. Lett., 2014, 104, 203110 CrossRef PubMed .
- S. Sahoo, A. P. S. Gaur, M. Ahmadi, M. J. F. Guinel and R. S. Katiyar, J. Phys. Chem. C, 2013, 117, 9042 CAS .
- D. Xiao, G. B. Liu, W. Feng, X. Xu and W. Yao, Phys. Rev. Lett., 2012, 108, 196802 CrossRef .
- Y. Zhao, X. Luo, H. Li, J. Zhang, P. T. Araujo, C. K. Gan and Q. Xiong, Nano Lett., 2013, 13, 1007 CrossRef CAS PubMed .
- K. Liu, Q. Yan, M. Chen, W. Fan, Y. Sun, J. Suh and J. Wu, Nano Lett., 2014, 14, 5097 CrossRef CAS PubMed .
- L. F. Huang, P. L. Gong and Z. Zeng, Phys. Rev. B: Condens. Matter Mater. Phys., 2014, 90, 045409 CrossRef .
- Y. Cai, J. Lan, G. Zhang and Y. W. Zhang, Phys. Rev. B: Condens. Matter Mater. Phys., 2014, 89, 035438 CrossRef .
- C. Ataca, M. Topsakal, E. Akturk and S. Ciraci, J. Phys. Chem. C, 2011, 115, 16354 CAS .
- M. D. Segall, P. J. D. Lindan, M. J. Probert, C. J. Pickard, P. J. Hasnip, S. J. Clark and M. C. Payne, J. Phys.: Condens. Matter, 2002, 14, 2717 CrossRef CAS .
- D. R. Hamann, M. Schlüter and C. Chiang, Phys. Rev. Lett., 1979, 43, 1494 CrossRef CAS .
- J. P. Perdew and A. Zunger, Phys. Rev. B: Condens. Matter Mater. Phys., 1981, 23, 5048 CrossRef CAS .
- P. Haas, F. Tran, P. Blaha, K. Schwarz and R. Laskowski, Phys. Rev. B: Condens. Matter Mater. Phys., 2009, 80, 195109 CrossRef .
- H. J. Monkhorst and J. D. Pack, Phys. Rev. B: Solid State, 1976, 13, 5188 CrossRef .
- B. K. Sarkar, A. S. Verma, S. Sharma and S. K. Kundu, Phys. Scr., 2014, 89, 075704 CrossRef .
- F. Birch, Phys. Rev., 1947, 71, 809 CrossRef CAS .
- R. P. Haggerty, P. Sarin, Z. D. Apostolov, P. E. Driemeyer and W. M. Kriven, J. Am. Ceram. Soc., 2014, 97, 2213 CrossRef CAS PubMed .
- E. S. Toberer, A. Zevalkink and G. J. Snyder, J. Mater. Chem., 2011, 21, 15843 RSC .
- G. A. Slack, Phys. Rev., 1962, 127, 694 CrossRef CAS .
- A. Otero-de-la-Roza, D. Abbasi-Pérez and V. Luaña, Comput. Phys. Commun., 2011, 182, 2232 CrossRef CAS PubMed .
- P. Hao, Y. Fang, J. Sun, G. I. Csonka, P. H. T. Philipsen and J. P. Perdew, Phys. Rev. B: Condens. Matter Mater. Phys., 2012, 85, 014111 CrossRef .
- H. T. Stokes, D. M. Hatch and B. J. Campbell, Isotropy software suite, http://stokes.byu.edu/iso/isotropy.php Search PubMed .
- A. Molina-Sanchez and L. Wirtz, Phys. Rev. B: Condens. Matter Mater. Phys., 2011, 84, 155413 CrossRef .
- C. Sourisseau, M. Fouassier, M. Alba, A. Ghorayeband and O. Gorochov, Mater. Sci. Eng., B, 1989, 3, 119 CrossRef .
- L. Sun, Y. Gao, B. Xiao, Y. Li and G. Wang, J. Alloys Compd., 2013, 579, 457 CrossRef CAS PubMed .
|
| This journal is © The Royal Society of Chemistry 2015 |
Click here to see how this site uses Cookies. View our privacy policy here. 


![[v with combining right harpoon above (vector)]](https://www.rsc.org/images/entities/char_0076_20d1.gif) g(
g(![[k with combining right harpoon above (vector)]](https://www.rsc.org/images/entities/i_char_006b_20d1.gif) ) = ∇kω(
) = ∇kω(