
Solution-based fabrication of VO2 (M) nanoparticles via lyophilisation
Xun Caoa,
Myat Noe Theta,
Yu Zhangb,
Say Chye Joachim Looac,
Shlomo Magdassid,
Qingyu Yanabe and
Yi Long*a
aSchool of Materials Science and Engineering, Nanyang Technological University, 50 Nanyang Avenue, Singapore 639798. E-mail: longyi@ntu.edu.sg
bEnergy Research Institute @ NTU, Nanyang Technological University, 50 Nanyang Drive, Singapore 637553
cSingapore Centre on Environmental Life Sciences Engineering (SCELSE), Nanyang Technological University, 60 Nanyang Drive, Singapore 637551
dCasali Institute of Applied Chemistry, The Hebrew University, Edmund Safra Campus, Jerusalem, Israel 91904
eTUM CREATE Research Centre @ NTU, Nanyang Technological University, 62 Nanyang Drive, Singapore 637459
First published on 3rd March 2015
Abstract
Thermochromic vanadium dioxide (VO2) is the most extensively researched smart material owing to its near room-temperature phase transition at around 68 °C. Freeze drying has been employed in the solution-based fabrication of highly pure and crystalline VO2 nanoparticles and it was found that freeze drying can largely eliminate the agglomeration issue which is common in nanoparticle fabrication. The particle size, phase transition temperature (τc), crystallinity and latent heat (LH) have been systematically studied by changing the precursor concentration and annealing temperature. The freeze-dried sample (with 7.5 mL H2O2 in precursor) annealed at 650 °C has a particle size of ∼53 nm and τc of 64.5 °C, as well as high crystallinity with LC of 36.76 J g−1.
Introduction
Vanadium dioxide (VO2) undergoes fully reversible metal–insulator transitions (MIT) from a semiconducting monoclinic phase to a metallic rutile phase at the critical temperature (τc) of 68 °C.1,2 The MIT is observed by a sharp change in infrared (IR) transmittance and electrical resistivity within 500 fs.3 As τc is adjustable to room temperature via doping,4,5 VO2 has thus become a suitable candidate in a wide range of potential applications, including energy-saving thermochromic smart windows,6 IR uncooled bolometers,7 sensors,8,9 field effect transistors10 and optical storage devices.11–13Thermochromic VO2 faces the drawback of low luminous transmittance (Tlum) and low solar modulating ability (the ability to regulate the input solar energy, ΔTsol). Enhancing both properties poses a great challenge and recent researches have focused on embedding VO2 NPs (NPs)/matrix composite foils,14,15 and thin film nanostructuring such as bio-inspired VO2 with anti-reflection (AR) effects16 and controlled nanoporosity.17 Although the newly developed organic18 and hybrid19 smart system based on temperature-responsive hydrogel matrix gave unprecedented thermochromic performance, the translucent appearance at higher temperature limited its full application in the field of smart windows.
Synthesis of VO2 NPs has been extensively studied and the resultant particle sizes, morphologies and phase transition temperatures are listed in Table 1. Two major fabrication methods include mechanical milling14 and hydrothermal synthesis,15,20 which could produce NPs with size less than 100 nm. One of the intrinsic issues of mechanical milling hindering its full application is the large size variation and distribution of the produced NPs, while hydrothermal methods mainly suffers from safety issues related with potential explosion of expensive autoclaves and difficulties in scaling up.
| Reported approaches | Particle size/shape | τc |
|---|---|---|
| Bead milling of commercial VO2 powder14 | ∼20 nm/irregular shape with core–shell structure | N.A. |
| Hydrothermal (V2O5–N2H4·HCl)15 | 25–45 nm/irregular shape | 63.3 °C |
| Hydrothermal (V2O5–H2C2O4)20 | ∼50 nm/spherical | 55.7–55.9 °C |
| Pyrolysis of [NH4]5[(VO)6(CO3)4(OH)9]·10H2O precursor21 | N.A./spherical | 68.0–70.9 °C |
| Hydrothermal (V2O5–H2C2O4) with W-doping22 | 30–50 nm/N.A. | N.A. |
| Hydrothermal (V2O5–H2C2O4) with F-doping23 | ∼30 nm/N.A. | 35 °C (2.93% F) |
| Hydrothermal (V2O5–H2C2O4-additives)24 | ∼70 nm/spherical | 32.2–69.6 °C |
| Hydrothermal (V2O5–N2H4)25 | <20 nm/spherical | 55.5 °C |
| Thermolysis of vanadyl ethylene glycolate (VEG) precursor26 | 50–100 nm/spherical | 68.0 °C |
Freeze drying has been a well-established process in chemical synthesis and food processing industries, during which solvents are frozen at low temperature and sublime under low pressure, hence being removed in a vacuum environment. The synthesis of nanoporous SiO2 and Al2O3 cryogels have also been reported in recent literatures,27–33 in which lyophilisation was employed to leave the nanoparticle suspensions intact.34 During freeze drying, as there is no liquid-to-gas phase transformation, particles are not subjected to capillary force, and thus agglomeration of the NPs is reduced. In this study, we report a simple and reproducible solution-based fabrication method via freeze drying, which produced fine crystalline VO2 (M) NPs and reduced phase transition temperature.
Experimental section
The chemicals used in this study were vanadium(V) oxide (V2O5, 99.99%, Alfa Aesar), hydrogen peroxide (H2O2, 30 wt%, VWR) and hydrazine monohydrate (N2H4·H2O, 98%, Sigma-Aldrich), polyvinylpyrrolidone (PVP, 99%, Sigma-Aldrich) and ethanol (95%, Aik Moh). All of the chemicals were used as received without any further purification.Synthesis of VO2 (M) NPs and casting of VO2 foil
182 mg of V2O5 powder was dissolved in different volumes of H2O2 and vigorously stirred at 70 °C for 2 h to form a reddish-brown sol. Following that, an appropriate amount of hydrazine was added and particles started to precipitate. The mixture was further stirred at 70 °C for another hour to facilitate full redox reaction. The as-prepared precursor was transferred into a 15 mL centrifuge tube (Corning Inc.), which was covered with a piece of filter paper and tightly sealed using parafilm. It was then placed in a 300 mL freeze drying flask (Fisher Scientific) and frozen in liquid nitrogen for 5 min. After that, it was quickly loaded onto the FreeZone 2.5 Plus lyophiliser (Labconco, USA) for 72 h of freeze drying to completely drive off the solvent. The lyophiliser collector was set at −80 °C and 0.01 mbar.After freeze drying, the raw precursor powder was immediately removed from the centrifuge tube and transferred into a high purity quartz bottle (99.99% SiO2, Youlab), evenly distributed and annealed at 550 °C for 2 h in a tube furnace with argon (99.9995%, NOX) atmosphere. The ramping rate was set to 1.0 °C min−1, and gas flow rate was tuned to around 200 cm3 min−1.
A comparative sample was made via conventional drying method (centrifugation at 10![[thin space (1/6-em)]](https://www.rsc.org/images/entities/char_2009.gif) 000 rpm for 10 min), followed by drying in vacuum at room temperature before heat treatment.
000 rpm for 10 min), followed by drying in vacuum at room temperature before heat treatment.
The as-synthesised NPs and PVP (acting as dispersant to distribute NPs) were added to ethanol with the aid of Vortex-Genie 2 mixer (Scientific Industries, USA) and ultrasonication. The homogeneous dispersion was casted onto a piece of pre-cleaned microscopic glass slide.
Characterization method
The phases of the samples were determined with an XRD-6000 X-ray diffractometer (XRD, Shimadzu, Japan), of which the Cu-Kα radiation was produced at 40 kV and 30 mA with λ ≈ 0.15406 nm at an X-ray grazing angle of 1.0°. The phase transition of VO2 (M) NPs was studied using a nitrogen-protected Q10 differential scanning calorimeter (DSC, TA Instruments, USA). The microstructures of the samples were characterised using a JSM-7600F field emission scanning electron microscope (FESEM, JEOL, Japan) with an INCA® EDX attachment (Oxford Instruments, UK), which was operated at an accelerating voltage of 5 kV under secondary electron imaging (SEI) mode and 20 kV for EDX respectively. The morphology, selected area electron diffraction (SAED) pattern and high resolution transmission electron microscopy (HRTEM) images were obtained by a JEM-2010F field-emission gun transmission electron microscope (FEG-TEM, JEOL, Japan) operated at an accelerating voltage of 200 kV. The transmittance spectra and hysteresis loop were collected using a Cary 5000 ultraviolet-visible light-near infrared (UV-Vis-NIR) spectrophotometer (Agilent, USA), which was equipped with a PE120 peltier system simple heating and cooling stage (Linkam, UK). The calculations of integrated Tlum (380 ≤ λ ≤ 780 nm) and ΔTsol (280 ≤ λ ≤ 2500 nm) can be found in eqn (1) and (2) respectively.
 | (1) |
| ΔTsol = Tsol(τ < τc) − Tsol(τ > τc) | (2) |
Results and discussion
Chemical reaction suggests that V2O5 is reduced by N2H4 according to the following scheme: 2V2O5 + N2H4 → 4VO2 + 2H2O + N2. Sample 1 was made by dispersing 182.0 mg of V2O5 in 15.0 mL of deionized water and hydrazine was added in stoichiometry (25 μL). Fig. 1a shows that only V6O13 and V2O5 are present in the annealed sample, possibly because V2O5 has a poor solubility in water, hence the produced Sample 1 powder remained to have a large particle size of 175.5 nm (Fig. 1b). With the addition of hydrazine as reducing agent, only partial reduction took place and formed a mixture of V6O13 and V2O5 during annealing, as the suggested reduction process for vanadium oxide is as following: V2O5 → V3O7 → V4O9 → V6O13 → VO2 → V7O13 → V6O11 → V5O9 → V4O7 → V3O5 → V2O3.37 For further reduction to VO2, H2O2 was added to dissolve the starting material (V2O5 powder). | ||
| Fig. 1 (a) XRD patterns of samples 1–4; (b–d) FESEM images of samples 1, 3a and 3b respectively; (b′–d′) histograms showing corresponding particle size distribution analyses. | ||
Sample 2 was made by adding 7.5 mL of H2O2 and after 2 h of reaction, the V2O5–H2O2 precursor formed a reddish-brown sol which contained V2O5·nH2O NPs. The value of n was confirmed to be 2.0 by thermogravimetric analysis (TGA) and the method was reported in our previous publication.38 With further addition of N2H4 with stoichiometric amount (90 μL), the annealed Sample 2 was a mixture of VO2 (M) and V6O13. The incomplete reduction could arise from the presence of residual H2O2 in the precursor which did not fully dissociate after 2 h of reaction, tending to re-oxidise the VO2 (M) NPs to V6O13. Sample 3a was fabricated with increased addition of N2H4 (110 μL), which produced a pure VO2 (M) phase after heat treatment with high crystallinity and all the XRD peaks could be ascribed to JCPDS# 82-661. The FESEM images (Fig. 1c) show a much smaller particles size compared with Sample 1 (Fig. 1b) with an average of 52 nm, which proved the efficacy of H2O2 employed to dissolve the V2O5 raw powders. When N2H4 amount was further increased to 120 μL (Sample 4), the presence of V7O13 phase indicated over-reduction contributed by the excessive amount of N2H4.
Meanwhile, Sample 3b was fabricated under the same condition as Sample 3a except that Sample 3b was dried via centrifugation but not freeze-dried. It can be observed that Sample 3b contains V6O13 as major phase, with minor trace of VO2 (M) in contrast with the highly crystalline Sample 3a with minor trace of undetermined impurity (Fig. 1a). This could be due to the residual H2O2 solvent content in the raw powder of Sample 3b which could not be fully removed even after centrifugation and drying in vacuum for 24 hours, and any remaining H2O2 would lead to incomplete reaction during the reduction of V2O5 to VO2. On the other hand, FESEM image of Sample 3b shows a mixture of plate-like and round shape morphologies of particles with an average size of 115 nm, and a large size distribution (Fig. 1d) compared with Sample 3a (Fig. 1c). It does suggest that freeze drying could keep the particles intact with much more uniform structures produced.17 As the solvent will be directly sublimed from solid to gas phase during freeze drying, the large capillarity force due to the solid–liquid transformation during ambient drying in Sample 3b will be eliminated, therefore the agglomeration issue which is common in the nanoparticles fabrication could be solved to large extent. Moreover, the reduced agglomeration ensures uniform heating during crystallisation, thereby reducing the amount of impurities and promoting the VO2 phase formation as shown in Fig. 1a.
Fig. 2a shows the XRD patterns of the VO2 (M) NPs synthesised using different amount of H2O2 and the sample designation is listed in Table 2. The general trend suggests that with increasing amount of H2O2, the highest peaks' intensity reduces which related to lower crystallinity. As more H2O2 being added during precursor synthesis, a dramatic broadening of the characteristic peaks along (011) orientation and declination of the peak intensity are observed starting from Sample 7 with 17.5 mL H2O2. From the calculation using full-widths at half maxima (FWHM) at 2θ ≈ 28.0°, the crystallite size of Samples 3a, 4, 5 and 6 are estimated to be ∼2 nm and this value is larger than that for Samples 7 to 9 (∼1 nm). By lowering the V5+ concentration, smaller crystallites could be produced as well as small average particle size (Table 2).
 | ||
| Fig. 2 (a) XRD patterns of VO2 (M) NPs synthesised using different amount of H2O2; (b and c) FESEM images of Sample 4 and Sample 9, respectively; (b′ and c′) histograms showing corresponding particle size distribution analyses. | ||
| Sample no. | Amount of H2O2 (mL) | τc (°C) | Δτc (°C) | LH (J g−1) | LC (J g−1) | Average particle sized |
|---|---|---|---|---|---|---|
| a LH and LC represent specific latent heat during heating and cooling stages.b Sample 3c was made under the same condition as Sample 3a, except that it was heat treated at 650 °C.c The reference sample was tested using the commercial VO2 (M) powder as purchased from Alfa Aesar, with particle size of ∼50 μm.d The average particle sizes were obtained from respective FESEM images. | ||||||
| 3a | 7.5 | 64.1 | 4.3 | 25.66 | 31.88 | 52 nm |
| 3cb | 7.5 | 64.5 | 4.5 | 31.85 | 36.76 | 53 nm |
| 4 | 10.0 | 64.2 | 5.6 | 19.54 | 27.23 | 53 nm |
| 5 | 12.5 | 64.1 | 5.3 | 21.44 | 27.16 | 53 nm |
| 6 | 15.0 | 65.8 | 5.5 | 11.95 | 21.24 | 55 nm |
| 7 | 17.5 | 46.9 | 30.4 | 4.49 | 2.33 | 38 nm |
| 8 | 20.0 | 43.8 | 35.1 | 3.17 | 0.57 | 37 nm |
| 9 | 25.0 | 49.7 | 32.4 | 3.94 | 3.12 | 37 nm |
| Referencec | N.A. | 68.0 | 2.5 | 38.70 | 41.87 | 50 μm |
According to the aggregative growth model constructed by Bogush and Zukoski, the size of final particles is directly proportional to the precursor concentration and inversely proportional to the nucleus size.39 These explain the larger average particle size in Samples 3–6 and this agrees well with the mechanism of the Stöber process.40 The above-mentioned finding is supported by the sudden change in the average particle sizes, which are listed in Table 2. Li et al.24 suggested that grain size has great influence on thermal behaviours of VO2 NPs, and smaller particle size leads to lower phase transition temperature (τc), both of which could be observed in this study (Table 2). Table 2 also records that smaller average particle size leads to an enlarged hysteresis width (Δτc) and a much lower latent heat (LH/LC) for phase transition.41–43
The phase transition of VO2 (M) NPs was examined by DSC. By plotting the heat flow rate against temperature, a peak was observed in both the heating and cooling stages, forming a hysteresis loop, thereby indicating the first-order MIT in the VO2 (M) NPs. The DSC graphs for Samples 3a, 3c, 9 and commercial VO2 (M) powder (∼50 μm) are shown in Fig. 3a. τc is calculated as the mean value of the heating and cooling peaks, and the difference between the two will be Δτc. LH/LC is calculated as the area under each peak individually. The synthesised VO2 (M) NPs are found to exhibit MIT at 64–66 °C, which is slightly lower than that for commercial VO2 (M) at 68 °C (Table 2). This should be mainly due to the reduced particle size as a result of the solution-based synthesis route via freeze drying. The experimental data also follows the general phase transition mechanism as described in the literatures.44,45
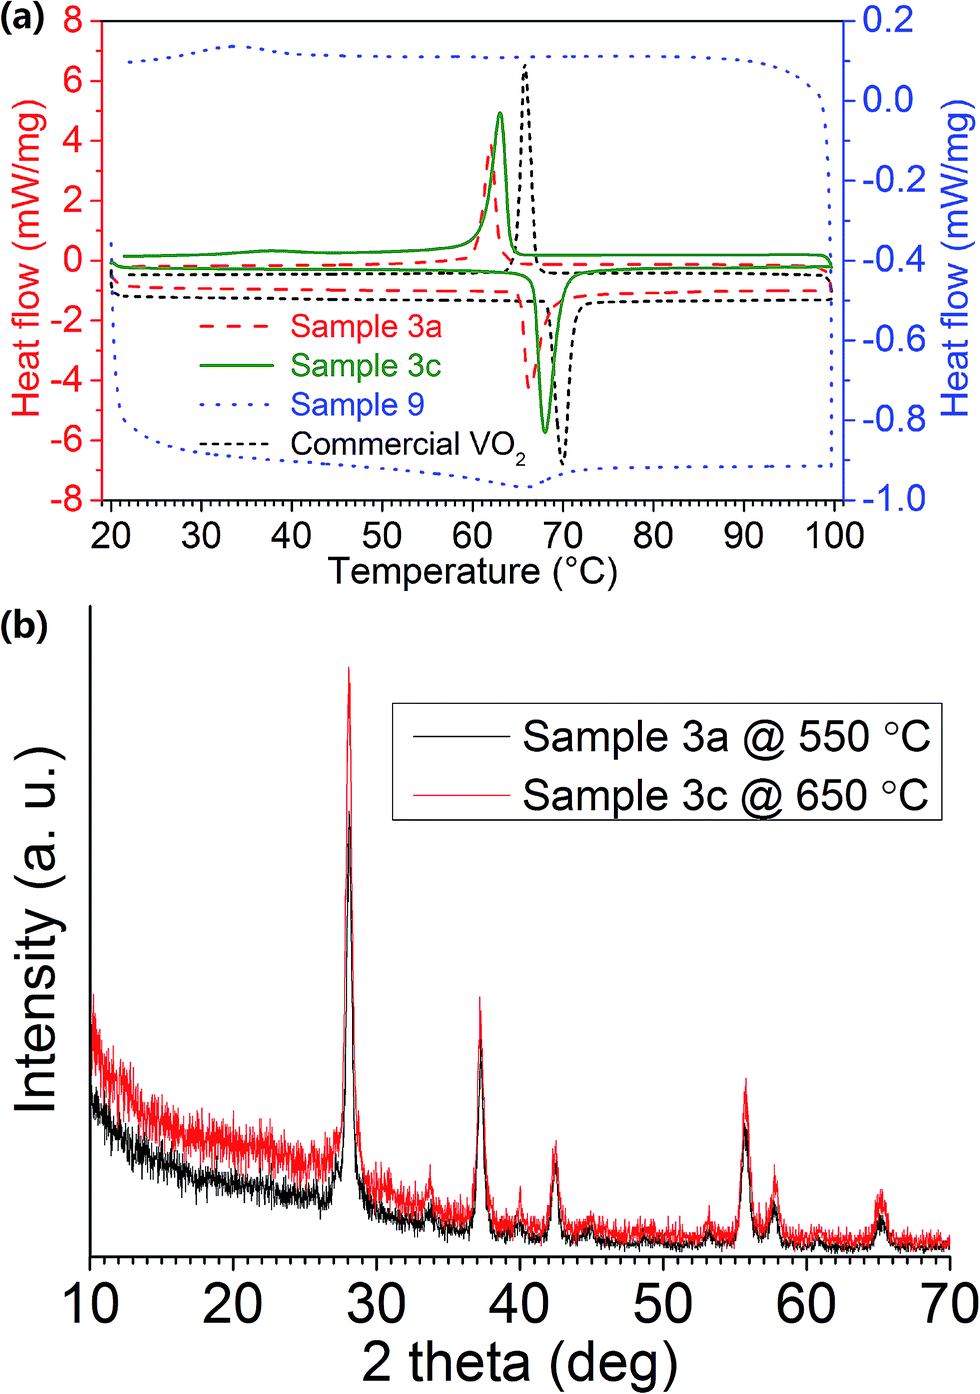 | ||
| Fig. 3 (a) DSC graphs of Samples 3a, 3c, 9 and commercial VO2, the respective latent heat of phase transitions can be found in Table 2; (b) XRD patterns of Samples 3a (black line) and 3c (red line). | ||
Fig. 3a reveals that Sample 3a has much sharper and more distinct peaks than Sample 9, indicating a much greater crystallinity in the sample. This result is consistent with XRD observations (Fig. 2a). The small Δτc in Sample 3a signifies a quick response to the external stimuli, whereas the broadened peaks with large Δτc in Sample 9 represents a supercooling effect.46 This might be due to that with lower vanadium concentration in the precursor, the annealed sample tends to have much smaller grain size and reveals much lower crystallinity as shown by the calculated latent heat for phase transition (Table 2), therefore having a slower response to the changes in the environment. Much smaller grain size and lower crystallinity in the sample may lead to a much lowered phase transition temperature, which is similar to the trend shown in the literature.24
The precursor powder dried from 7.5 mL H2O2 synthesis was also annealed at 650 °C to obtain VO2 (M) NPs with higher crystallinity (Sample 3c). This is evident from DSC and XRD (Fig. 3a and b), whereby Sample 3c had a higher latent heat during phase transition and a greater relative intensity of the diffraction peaks respectively.
FESEM image (Fig. 4a) shows that the particle size of Sample 3c does not differ much from that of Sample 3a (Fig. 1c). TEM image (Fig. 4b) of Sample 3c shows that VO2 (M) NPs size is approximately 50 nm with little agglomeration and it is consistent with particle size distribution histogram (Fig. 4a′) measured from Fig. 4a. HRTEM image (Fig. 4c) of Sample 3c indicates that the inter-plane distance for the nanocrystals is 0.319 nm, which matches well with the data for (011) orientation in JCPDS# 82-661 (d011 = 0.320 nm as indicated in standard database), this further confirms that the formed phase of the NPs is VO2 (M); the corresponding SAED pattern (Fig. 4d) shows that the as-synthesised NPs are polycrystalline. On the other hand, TEM image of Sample 9 (Fig. 4e) shows that the particle size is smaller than that of Sample 3c, but the diffraction rings in its SAED pattern are not distinguishable, this indicates poor crystallinity of the Sample 9 and this observation is consistent with XRD patterns (Fig. 2a) Thermal analysis for Sample 3c shows that the latent heat for phase transition of the sample is close to that of the commercial VO2 (M) powder as purchased from Alfa Aesar, indicating similar crystallinity in the synthesised sample.
 | ||
| Fig. 4 (a) FESEM, (b) TEM, (c) HRTEM images and (d) the SAED pattern of Sample 3c; (a′) histogram showing particle size distribution analysis; (e) TEM image of Sample 9 and its SAED pattern (inset). | ||
Fig. 5 displays the transmittance spectra of the casted film at 20 °C and 90 °C, as well as the hysteresis loop obtained at the fixed wavelength of 2500 nm. Since Sample 3c powder has the best crystallinity and it was casted into a foil (with a powder loading of VO2:PVP = 1:2 by mass), it has a deep bronze colour and renders thermochromic performance of Tlum = 35% and ΔTsol = 6.8% (Fig. 5). The NIR transmittance contrast at λ = 2500 nm is ∼40%, this means the sample has high NIR modulating ability, which is an important factor of thermochromism. The hysteresis loop shows Δτc = 5 °C, which is comparable to that of Sample 3c powder (Table 2); while further confirming the high crystallinity of Sample 3c, the fast response to the testing temperatures also signifies the practical application of VO2 (M) NPs in the field of smart window coatings. However, the casted film has a slightly higher τc of 67.5 °C as compared to Sample 3c powder (64.5 °C), this might be because after casting, the grains get closer to each other due to the binding effect of PVP, thus showing the similar effect as agglomeration, and hence giving rise to a slightly higher τc.
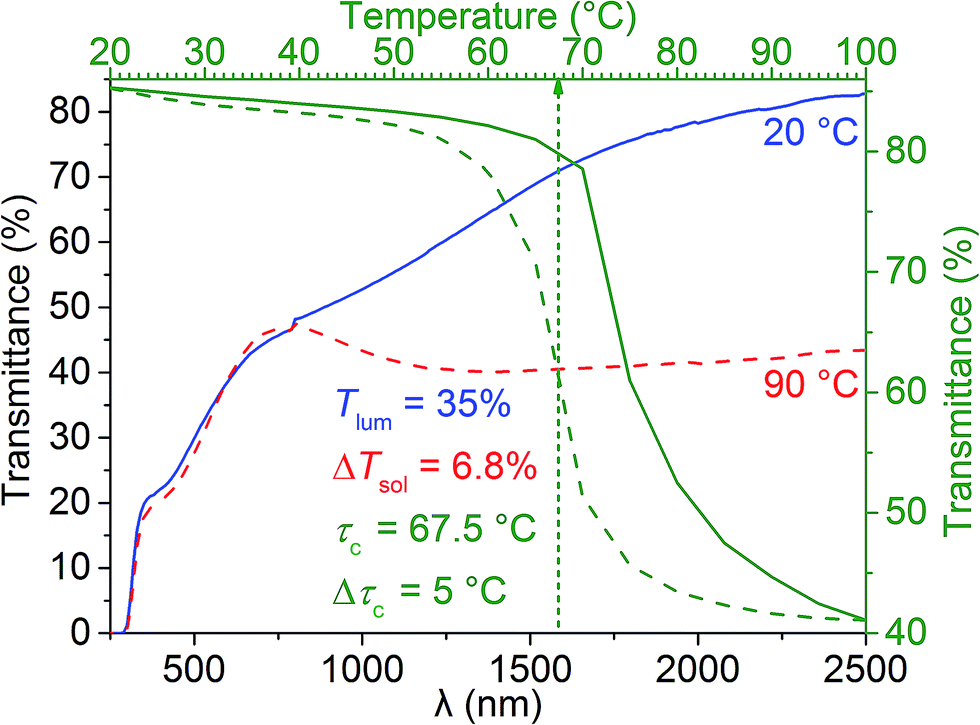 | ||
| Fig. 5 Transmittance spectra of the casted film made from Sample 3c at 20 °C (blue curve) and 90 °C (red curve), as well as the hysteresis loop obtained at λ = 2500 nm (green curves). | ||
Conclusions
In this study, VO2 (M) NPs were synthesised by hydrazine reduction followed by freeze drying and annealing. Careful control of hydrazine amount is required to produce pure VO2 (M) phase in the final samples. Freeze drying effectively keeps NPs well-separated in precursor powder, which leads to the formation of the VO2 (M) NPs of ∼50 nm. With more solvent in precursors, the average particle size is reduced from ∼53 nm to ∼37.5 nm; τc shows a general decreasing trend from 65.8 °C to 43.8 °C, while Δτc is enlarged from 4.3 °C to 35.1 °C. With a higher vanadium concentration, crystallinity and latest heat for phase transition of the samples can be improved. The freeze-dried sample (with 7.5 mL H2O2 in precursor) annealed at 650 °C has high crystallinity with a particle size of ∼53 nm and τc = 64.5 °C. Its latent heat for phase transition is ∼36.76 J g−1, which is close to the commercial VO2 (M) powder (∼41.87 J g−1) as purchased from Alfa Aesar.Acknowledgements
This research is supported by the Singapore National Research Foundation under CREATE programme: Nanomaterials for Energy and Water Management and Singapore Ministry of Education (MOE) Academic Research Fund Tier 1 RG101/13. The XRD, FESEM and TEM characterizations were performed at the Facility for Analysis, Characterization, Testing and Simulation (FACTS) in Nanyang Technological University, Singapore.Notes and references
- M. K. Liu, H. Y. Hwang, H. Tao, A. C. Strikwerda, K. B. Fan, G. R. Keiser, A. J. Sternbach, K. G. West, S. Kittiwatanakul, J. W. Lu, S. A. Wolf, F. G. Omenetto, X. Zhang, K. A. Nelson and R. D. Averitt, Nature, 2012, 487, 345 CrossRef CAS PubMed.
- M. M. Qazilbash, M. Brehm, B.-G. Chae, P.-C. Ho, G. O. Andreev, B.-J. Kim, S. J. Yun, A. V. Balatsky, M. B. Maple, F. Keilmann, H.-T. Kim and D. N. Basov, Science, 2007, 318, 1750 CrossRef CAS PubMed.
- C. Kübler, H. Ehrke, R. Huber, R. Lopez, A. Halabica, R. F. Haglund and A. Leitenstorfer, Phys. Rev. Lett., 2007, 99, 116401 CrossRef.
- P. Kiri, G. Hyett and R. Binions, Adv. Mater. Lett., 2010, 1, 86 CrossRef CAS PubMed.
- X. Cao, N. Wang, S. Magdassi, D. Mandler and Y. Long, Sci. Adv. Mater., 2014, 6, 558 CrossRef CAS PubMed.
- C. Liu, N. Wang and Y. Long, Appl. Surf. Sci., 2013, 283, 222 CrossRef CAS PubMed.
- S. Chen, L. Dai, J. J. Liu, Y. F. Gao, X. L. Liu, Z. Chen, J. D. Zhou, C. X. Cao, P. G. Han, H. J. Luo and M. Kanahira, Phys. Chem. Chem. Phys., 2013, 15, 17537 RSC.
- E. Strelcov, Y. Lilach and A. Kolmakov, Nano Lett., 2009, 9, 2322 CrossRef CAS PubMed.
- A. Boscolo, E. Menosso, B. Piuzzi and M. Toppano, in Device Applications of Nonlinear Dynamics, ed. S. Baglio and A. Bulsara, Springer, Berlin Heidelberg, 2006, p. 139 Search PubMed.
- M. Nakano, K. Shibuya, D. Okuyama, T. Hatano, S. Ono, M. Kawasaki, Y. Iwasa and Y. Tokura, Nature, 2012, 487, 459 CrossRef CAS PubMed.
- G. V. Jorgenson and J. C. Lee, Sol. Energy Mater., 1986, 14, 205 CrossRef CAS.
- E. E. Chain, Appl. Opt., 1991, 30, 2782 CrossRef CAS PubMed.
- F. A. Chudnovskii, A. L. Pergament, D. A. Schaefer and G. B. Stefanovich, Proc. SPIE, 1996, 80 CrossRef CAS PubMed.
- C. Liu, X. Cao, A. Kamyshny, J. Y. Law, S. Magdassi and Y. Long, J. Colloid Interface Sci., 2014, 427, 49 CrossRef CAS PubMed.
- Z. Chen, Y. F. Gao, L. T. Kang, C. X. Cao, S. Chen and H. J. Luo, J. Mater. Chem. A, 2014, 2, 2718 CAS.
- X. K. Qian, N. Wang, Y. F. Li, J. H. Zhang, Z. C. Xu and Y. Long, Langmuir, 2014, 30, 10766 CrossRef CAS PubMed.
- X. Cao, N. Wang, J. Y. Law, S. C. J. Loo, S. Magdassi and Y. Long, Langmuir, 2014, 30, 1710 CrossRef CAS PubMed.
- Y. Zhou, Y. F. Cai, X. Hu and Y. Long, J. Mater. Chem. A, 2014, 2, 13550 CAS.
- Y. Zhou, Y. F. Cai, X. Hu and Y. Long, J. Mater. Chem. A, 2015, 3, 1121 CAS.
- Y. F. Gao, S. B. Wang, H. J. Luo, L. Dai, C. X. Cao, Y. L. Liu, Z. Chen and M. Kanehira, Energy Environ. Sci., 2012, 5, 6104 CAS.
- C. M. Zheng, X. M. Zhang, J. H. Zhang and K. R. Liao, J. Solid State Chem., 2001, 156, 274 CrossRef CAS.
- Y. F. Gao, S. B. Wang, L. T. Kang, Z. Chen, J. Du, X. L. Liu, H. J. Luo and M. Kanehira, Energy Environ. Sci., 2012, 5, 8234 CAS.
- L. Dai, S. Chen, J. J. Liu, Y. F. Gao, J. D. Zhou, Z. Chen, C. X. Cao, H. J. Luo and M. Kanehira, Phys. Chem. Chem. Phys., 2013, 15, 11723 RSC.
- M. Li, X. Wu, L. Li, Y. X. Wang, D. B. Li, J. Pan, S. J. Li, L. T. Sun and G. H. Li, J. Mater. Chem. A, 2014, 2, 4520 CAS.
- S. D. Ji, F. Zhang and P. Jin, Sol. Energy Mater. Sol. Cells, 2011, 95, 3520 CrossRef CAS PubMed.
- J. Zou, Y. G. Peng and H. Lin, J. Mater. Chem. A, 2013, 1, 4250 CAS.
- L. F. Su, L. Miao, S. Tanemura and G. Xu, Sci. Technol. Adv. Mater., 2012, 13, 035003 CrossRef.
- O. A. Shlyakhtin and Y.-J. Oh, J. Electroceram., 2009, 23, 452 CrossRef CAS.
- S. R. Mukai, H. Nishihara and H. Tamon, Catal. Surv. Asia, 2006, 10, 161 CrossRef CAS.
- E. Baudrin, G. Sudant, D. Larcher, B. Dunn and J.-M. Tarascon, Chem. Mater., 2006, 18, 4369 CrossRef CAS.
- G. Sudant, E. Baudrin, B. Dunn and J.-M. Tarascon, J. Electrochem. Soc., 2004, 151, A666 CrossRef CAS PubMed.
- J. J. Xu and J. Yang, Electrochem. Commun., 2003, 5, 230 CrossRef CAS.
- J. H. Harreld, W. Dong and B. Dunn, Mater. Res. Bull., 1998, 33, 561 CrossRef CAS.
- W. Abdelwahed, G. Degobert, S. Stainmesse and H. Fessi, Adv. Drug Delivery Rev., 2006, 58, 1688 CrossRef CAS PubMed.
- G. Wyszecki and W. S. Stiles, Color Science: Concepts and Methods, Quantitative Data and Formulae, Wiley, New York, second edn, 2000 Search PubMed.
- Standard Tables of Reference, Solar Spectral Irradiance: Direct Normal and Hemispherical on a 37° Tilted Surface, Annual Book of ASTM Standards, 2012, G173-03.
- H. P. Ma and S. Q. Xu, Rare Met. Mater. Eng., 2004, 33, 317 CAS.
- N. Wang, S. Magdassi, D. Mandler and Y. Long, Thin Solid Films, 2013, 534, 594 CrossRef CAS PubMed.
- G. H. Bogush and C. F. Zukoski IV, J. Colloid Interface Sci., 1991, 142, 19 CrossRef CAS.
- W. Stöber, A. Fink and E. Bohn, J. Colloid Interface Sci., 1968, 26, 62 CrossRef.
- R. Lopez, L. C. Feldman and R. F. Haglund, Phys. Rev. Lett., 2004, 93, 177403 CrossRef CAS.
- E. U. Donev, R. Lopez, L. C. Feldman and R. F. Haglund, Nano Lett., 2009, 9, 702 CrossRef CAS PubMed.
- K. Appavoo, D. Y. Lei, Y. Sonnefraud, B. Wang, S. T. Pantelides, S. A. Maier and R. F. Haglund, Nano Lett., 2012, 12, 780 CrossRef CAS PubMed.
- R. Lopez, T. E. Haynes, L. A. Boatner, L. C. Feldman and R. F. Haglund, Phys. Rev. B: Condens. Matter Mater. Phys., 2002, 65, 224113 CrossRef.
- E. U. Donev, J. I. Ziegler, R. F. Haglund and L. C. Feldman, J. Opt. A: Pure Appl. Opt., 2009, 11, 125002 CrossRef.
- N. Wang, Y. Z. Huang, S. Magdassi, D. Mandler, H. Liu and Y. Long, RSC Adv., 2013, 3, 7124 RSC.
| This journal is © The Royal Society of Chemistry 2015 |