New insights into the qualitative phenolic profile of Ficus carica L. fruits and leaves from Tunisia using ultra-high-performance liquid chromatography coupled to quadrupole-time-of-flight mass spectrometry and their antioxidant activity

Sonda Ammarab, María del Mar Contreras*ac, Olfa Belguith-Hadrichb, Mohamed Bouaziz*b and Antonio Segura-Carreteroac
aResearch and Development Functional Food Centre (CIDAF), Bioregión Building, Health Science Technological Park, Avenida del Conocimiento s/n, 18016, Granada, Spain
bLaboratoire d'Électrochimie et Environnement, École Nationale d'Ingénieurs de Sfax, Université de Sfax, BP “1173” 3038, Tunisia, mohamed.bouaziz@fsg.rnu.tn
cDepartment of Analytical Chemistry, Faculty of Sciences, University of Granada, Avda. Fuentenueva s/n, 18071 Granada, Spain. E-mail: mmcontreras@ugr.es; Fax: +34 958 637 083; Tel: +34 958 637 206

Received 20th December 2014 , Accepted 6th February 2015

First published on 6th February 2015


Abstract

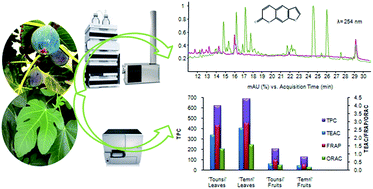
Ficus carica L. fruits have been consumed from the earliest times, and other parts of the tree have been used for traditional medicinal purposes. Nowadays, the beneficial properties of this and other Ficus species are attributed to the presence of key phytochemicals. To increase our knowledge about this topic, the present study has conducted phenolic profiling of the leaves and whole fruits from two Tunisian cultivars, ‘Temri’ and ‘Tounsi’, using reversed-phase ultra-high-performance liquid chromatography (RP-UHPLC) coupled to two detection systems: diode-array detection (DAD) and quadrupole time-of-flight (QTOF) mass spectrometry (MS). UV-Vis absorption was a valuable tool for classifying phenolic compounds into families, while MS using electrospray ionization (ESI) and MS/MS allowed the molecular formula to be established and structural information to be obtained. The total phenol content and the antioxidant activity were also assessed. As a result, in the negative ionization mode 91 phenolic compounds were characterized including hydroxybenzoic acids, hydroxycinnamic acids, hydroxycoumarins and flavanoids (flavonols, flavones, flavanones, flavanonols, flavanols and isoflavones). This work was complemented by the detection of other 18 phenolic compounds in the positive ionization mode, including anthocyanins and furanocoumarins. To the best of our knowledge, this is the first time most of these compounds have been tentatively reported in F. carica. These results indicate the complexity of this family of secondary metabolites in F. carica, as well as the potential of this analytical method for characterization purposes. In conclusion, the qualitative phenolic profile, total phenolic content and antioxidant activity differed especially between leaves and fruits.


1. Introduction

Moraceae is an angiosperm plant family, very rich in edible species and characterized by milky latex in all parenchymatous tissue, unisexual flowers, anatropous ovules, and aggregate drupes or achenes.1 Ficus is one of the thirty-seven genera of this family, which comprises about 800 species.2 Among them, the fig tree or common fig (Ficus carica L.) is the most well known species. This plant is a native of the Middle East and one of the first plants cultivated by humans. Fig fruits are consumed either fresh or dried,3,4 and today F. carica continues to be an important crop worldwide, especially in the Mediterranean basin,5 which includes Tunisia.

In general, figs have the best nutrient score among dried fruit, being an important source of minerals and vitamins,4 as well as containing relatively higher amounts of crude fibre than all other common fruits.6,7 Among its phytochemicals, some phenolic classes have been reported in Spanish, Italian and Turkish commercial figs such as the furanocoumarins psoralen and bergapten (5-methoxypsoralen),8 the flavonoid rutin,8–10 hydroxycinnamic acids like ferulic and chlorogenic acids8,9,11 and anthocyanins.4 The analytical techniques to perform these studies include gas chromatography (GC) coupled to mass spectrometry (MS) and a flame ionization detector (FID),12 as well as high-performance liquid chromatography (HPLC) coupled to UV, diode array detection (DAD) and mass spectrometry (MS) in a negative or positive ionization mode depending on the target phenolic class.4,7,8,10–14

Regarding the potential health benefits, F. carica exhibits antioxidant,2,6,7 and remarkably hypolipidemic and hypoglycemic properties15 that could be of interest for managing metabolic syndrome. In fact, the antidiabetic effects of F. carica leaves extracts have evoked great interest as a natural therapy15 since diabetes is one of the most common diseases in nearly all countries. It also continues to increase in number and significance as changing lifestyles lead to reduced physical activity and increased obesity.16 Pèrez and co-workers confirmed that the water extract of fig leaves and its chloroform fraction tend to normalize the antioxidant status of diabetic rats.17 Although several studies have related the bioactivity of this and other Ficus species to the phenolic constituents,15 more studies are needed to clarify this issue. Thus, novel analytical methodologies may help in the elucidation of the bioactive molecules.

In the case of Tunisia, more than 70 different fig ecotypes were recently reported with a wide phenotypic diversity and distinguished by taste, colour and flavour of fruits. However, little is known about their bioactivity and minor phytochemical composition. Two examples of cultivars, known as the ‘Temri’ and ‘Tounsi’ cultivars, are commonly cultivated in the centre and south of Tunisia,18 respectively. Therefore, as potential bioactive markers, the total phenolic content (TPC) and antioxidant capacity of leaves and dried whole fruits from these two Tunisian cultivars of F. carica were firstly evaluated. Secondly, their phenolic profiles were extensively studied by ultra-high-performance liquid chromatography (UHPLC) coupled with two detection systems, DAD and quadrupole time-of-flight (QTOF)-MS using electrospray ionization in complementary negative and positive ionization modes.

2. Results and discussion

Total phenolic content and antioxidant activity of the ‘Tounsi’ and ‘Temri’ fig cultivars

Total phenolic content. In general, the leaves were richer in phenolic compounds than fruits, the TPC value being the highest in the ‘Temri’ cultivar (686.88 mg of gallic acid/100 g of leaves; Fig. 1). However, the dried whole fruits from the ‘Tounsi’ cultivar presented a higher TPC value (200.18 mg of gallic acid/100 g of dried fruits) than ‘Temri’ (124.48 mg of gallic acid/100 g of dried fruits) (Fig. 1). Concerning the fig fruits, Solomon et al.7 evaluated the TPC of six common commercial figs, which had values ranging from 48.6 to 281.1 mg of gallic acid/100 g of fresh fruits. These authors showed that cultivars with skins with dark purple colours, such as Mission and Chechick, were richer in phenolic compounds than those with clearer skins, which explain our results since the skin from the ‘Tounsi’ fruits presents a darker purple colour than ‘Temri’ fruits.
image file: c4ra16746e-f1.tif
Fig. 1 Bar graph of total phenol content (TPC) (mg of gallic acid/100 g sample) of leaves and fruits from F. carica cultivars ‘Tounsi’ and ‘Temri’ and antioxidant activity evaluated by: trolox equivalent antioxidant capacity (TEAC) (mmol eq. trolox/100 g of sample), ferric ion reducing antioxidant power (FRAP) (mmol eq. FeSO4/100 g sample) and oxygen radical absorbance capacity (ORAC) (mmol eq. trolox/100 g sample) assays. The primary Y axis corresponds to TPC and the secondary Y axis corresponds to antioxidant activity. Data are given as mean ± standard deviation. Caffeic acid was used as the control and expressed as mmol eq. trolox or FeSO4/mmol of compound.
In vitro antioxidant activity. Three different methods were used to evaluate the antioxidant capacity: trolox equivalent antioxidant capacity (TEAC), which is also known as the ABTS method; ferric ion reducing antioxidant power (FRAP); and oxygen radical absorbance capacity (ORAC). The TEAC and FRAP methods are based on single electron transfer (SET) mechanisms, whereas the ORAC method is based on a hydrogen atom transfer (HAT) reaction. In this regard, it is now recommended that in vitro antioxidants should be determined by at least two methods, preferably with different mechanisms.19,20 The results are depicted in Fig. 1. Caffeic acid was used as control due to the lack of standardization of these protocols in the literature, with the TEAC, FRAP and ORAC values in agreement with those in studies by Rice-Evans et al.,21 Ozgen et al.22 and Ou et al.,23 respectively.

According to aforementioned results for TPC, the leaves showed higher antioxidant activity values than fruits by the three methods assayed. In the same manner, the highest TEAC, FRAP and ORAC values were measured in the ‘Temri’ cultivar, being 2.58 mmol equivalent of trolox/100 g of sample, 2.93 mmol equivalents of FeSO4/100 g of sample and 1.56 mmol equivalents of trolox/100 g of sample, respectively. In general, the antioxidant potential of leaves from the Ficus genus is higher than that of the fruits.24

Previous studies on the antioxidant activity were only conducted on fresh fruits, with results ranging from 0.025 to 0.716 mmol equivalent of trolox/100 g for TEAC, and 0.36 to 1.61 mmol equivalent of FeSO4/100 g for FRAP,7,25 so it is not appropriate to compare these with our values. Furthermore, the drying process may partially alter the total fruits phenolic content,10 anthocyanins,26 as well as antioxidant activity.26 In the case of the ORAC, this activity has not been studied before in this fruit. This method is interesting since it is based on the scavenging of peroxyl radicals that are physiologically relevant radicals.19

Correlation between TPC and antioxidant activity. Overall, the leaves of both cultivars possessed the strongest antioxidant activity and the fruits had the weakest activity. This may be explained by the occurrence of the highest amounts of phenolic compounds in leaves, since our results indicate an excellent correlation between TPC content and TEAC (r = 0.994), FRAP (r = 0.997) and ORAC (r = 0.993) at p < 0.01 (Table 1). On the other hand, the antioxidant activities determined by these three methods also correlated well between each other (r > 0.98; Table 1). These results are in accordance with previous studies that have also shown a strong correlation between the TPC, TEAC7 and FRAP25 of fig fruits. However, in other foods little or no relationship has been found and other antioxidant compounds may contribute greatly.20 Thus, our results indicate that phenolic compounds are determinants of antioxidant agents in the F. carica samples.
Table 1 Correlation between the total phenolic content (TPC) and antioxidant activity of leaves and fruits of F. carica cultivars ‘Temri’ and ‘Tounsi’a
Correlations
  TPC TEAC FRAP ORAC
a Antioxidant activity: TEAC, trolox equivalent antioxidant capacity; FRAP, ferric ion reducing antioxidant power; ORAC, oxygen radical absorbance capacity.b Correlation is significant at the 0.01 level (2-tailed).
TPC Pearson correlation 1 0.994b 0.997b 0.993b
Sig. (2-tailed)   0.000 0.000 0.000
TEAC Pearson correlation 0.994b 1 0.991b 0.985b
Sig. (2-tailed) 0.000   0.000 0.000
FRAP Pearson correlation 0.997b 0.991b 1 0.984b
Sig. (2-tailed) 0.000 0.000   0.000
ORAC Pearson correlation 0.993b 0.985b 0.984b 1
Sig. (2-tailed) 0.000 0.000 0.000  


Qualitative profiling of leaves and fruits

General identification process. In the present work, a qualitative analysis of the phenolic composition was performed using RP-UHPLC-DAD-QTOF-MS and MS/MS, using electrospray ionization in negative and positive ionization modes. Respectively, Tables 2 and 3 show the general results for the following: retention time (RT), molecular monoisotopic mass, experimental m/z, molecular formula, UV data (nm), MS score, error (ppm), main MS/MS fragments and the proposed assignment. Additionally, Tables S1 and S2 provide the species, plant family and previous studies that have reported on each compound.
Table 2 Phenolic compounds characterized using the negative ionization mode in leaves and fruits of F. carica cultivars ‘Tounsi’ and ‘Temri’
RTa (min) [M − H] Formula Score Errora (ppm) UVa (nm) Main fragments via MS/MS Proposed compound Presence
‘Tounsi’ ‘Temri’
La Fa La Fa
a RT, retention time; L, leaves; F, fruits. The UV data agreed with Gómez-Romero et al.;28 Lin et al.;36 Tsimogiannis et al.37b Identification confirmed by comparison with standards.c Compounds described here for first time in family Moraceae with several saccharide combinations and conjugation positions reported in different plant families (see KNApSAck, Reaxys or SciFinder databases).d Apigenin C-hexoside pentoside could be schaftoside (apigenin 6-C-glucoside 8-C-arabinoside) or isochaftoside (apigenin 6-C-arabinoside 8-C-glucoside). The latter were previously described in F. carica leaves (Takahashi et al.32).e The identification was based on the elution pattern under similar analytical conditions (Tahir et al.39).f Compounds described here for first time in family Moraceae and common in the family Fabaceae (see KNApSAck, Reaxys or SciFinder databases).g 6-, 8- and 3′-prenylgenistein were previously reported in other Ficus species.
Hydroxybenzoic acids and derivatives
10.61 359.0976 C15H20O10 94.7 1.6 280 197.0455; 179.0346; 153.0549; 135.0452; 85.0292 Syringic acid hexoside I + +
10.76 315.0725 C13H16O9 98.9 −1.2 153.0190; 152.0109; 108.0212; 109.0293 Dihydroxybenzoic acid hexoside I + + + +
10.76 313.0569 C13H14O9 84.0 −1.2 280 197.0462; 167.0354; 153.0559; 135.0454; 133.0145; 123.0455; 115.0039 Syringic acid malate I + +
10.94 359.0993 C15H20O10 89.3 −2.9 280 197.0458; 179.0352; 153.0352; 135.0454; 123.0453; 85.0297 Syringic acid hexoside II + +
11.07 329.0886 C14H18O9 80.3 −2.4 255; 291 167.0345; 152.0111; 123.0450; 108.0213 Vanillic acid glucoside + + +
11.07 313.0573 C13H14O9 82.7 −2.7 280 179.0350; 135.0450; 133.0142; 115.0037 Syringic acid malate II + +
11.09 475.1473 C20H28O13 86.7 −3.8 329.0880; 167.0347; 109.0293 Vanillic acid hexoside deoxyhexoside + +
11.19 433.1002 C17H22O13 95.3 −3.2 280 301.0564; 169.0138; 168.0061; 151.0035; 125.0242 Gallic acid di-pentoside I + +
11.23 315.0726 C13H16O9 98.9 −1.5 153.0188; 109.0294 Dihydroxybenzoic acid hexoside II + + + +
11.50 433.0996 C17H22O13 98.2 −1.6 280 301.0568; 169.0130; 168.0064; 151.0041; 125.0245 Gallic acid di-pentoside II + + + +
11.57 447.1143 C18H24O13 99.3 0.4 305 315.0714; 271.0816; 152.0112; 109.0291; 108.0217 Dihydroxybenzoic acid hexoside pentoside I + + + +
12.32 447.1143 C18H24O13 97.4 0.2 260; 297 152.0114; 109.0291 Dihydroxybenzoic acid hexoside pentoside II + +
12.54 153.0198 C7H6O4 92.5 −4.1 260; 290 109.0296; 108.0220 Dihydroxybenzoic acid + + + +
12.56 315.0723 C13H16O9 99.7 −0.5 153.0194; 152.0194; 109.0291; 108.0219 Dihydroxybenzoic acid hexoside II + +
12.62 285.0613 C12H14O8 97.3 1.2 260; 300 152.0115; 153.0191; 108.0217; 109.0295 Dihydroxybenzoic acid pentoside I + + + +
12.68 447.1151 C18H24O13 94.3 −1.6 153.0192; 109.0295 Dihydroxybenzoic acid hexoside pentoside III + + + +
13.17 285.0621 C12H14O8 85.2 −1.4 230; 300 153.0191; 152.0113; 109.0294; 108.0219 Dihydroxybenzoic acid pentoside II + + + +
13.25 417.1043 C17H22O12 98.2 −1.0 310 285.0613; 241.0718; 153.0165; 152.0119; 108.0217; 109.0287 Dihydroxybenzoic acid di-pentoside + + + +
14.66 137.025 C7H6O3 96.1 −5.0 109.0294; 108.0221; 93.0349; 92.0273 Hydroxybenzoic acid I + +
15.17 137.0245 C7H6O3 95.3 −1.7 93.0344 Hydroxybenzoic acid II + + + +
15.90 167.0349 C8H8O4 96.9 0.9 261; 292 152.0110; 123.0431; 124.0163; 108.0214 Vanillic acidb + + + +
 
Hydroxycinnamic acids and derivatives
11.19 515.1408 C22H28O14 88.4 −0.9 264; 327 353.0881; 191.0560; 179.0346 Caffeoylquinic acid hexoside I + +
11.75 515.1408 C22H28O14 98.2 −0.7 262; 324 341.0872; 323.0771; 191.0559; 179.0348; 173.0451; 135.0451 Caffeoylquinic acid hexoside II + + + +
12.31 353.0884 C16H18O9 98.3 −1.3 264; 328 191.0560; 179.0349; 135.0448 Caffeoylquinic acid I + + + +
12.37 343.1043 C15H20O9 95.9 −2.7 282 181.0508; 163.0400; 137.0609; 135.0443 Dihydrocaffeic acid hexose + + + +
12.64 515.1408 C22H28O14 98.5 −1.0 280; 320 341.0773; 323.0773; 191.0560; 179.0347; 135.0446 Caffeoylquinic acid hexoside III + + + +
12.89 355.1038 C16H20O9 99.1 −1.0 322 193.0502; 178.0267; 149.0606; 134.0369 Ferulic acid hexoside I + +
13.79 337.0926 C16H18O8 81.3 0.8 300; 320 191.0557; 173.0454; 163.0399 Coumaroylquinic acid I + +
13.90 353.0883 C16H18O9 98.2 −1.3 298; 325 191.0566; 179.0347 Caffeoylquinic acid IIb (chlorogenic acid) + + + +
14.11 325.0929 C15H18O8 92.4 −0.5 326 163.0397; 119.0499 Comaroyl hexoside + +
14.21 353.0882 C16H18O9 83.7 −1.1 325 Caffeoylquinic acid III + + + +
14.72 355.1036 C16H20O9 99.3 −0.4 323 193.0502; 178.0267; 149.0602; 134.0370 Ferulic acid hexoside II + +
15.28 353.0885 C16H18O9 83.2 −1.6 272; 328 191.0565 Caffeoylquinic acid IV + + + +
15.61 337.0929 C16H18O8 98.4 0.5 272; 328 191.0568 Coumaroylquinic acid II + +
15.84 179.036 C9H8O4 94.5 −5.5 295; 324 135.056; 134.0377; 89.0399 Caffeic acidb + +
16.03 295.0467 C13H12O8 95.9 −2.5 298; 330 179.0350; 133.0143; 115.0038 Caffeoylmalic acid + +
16.83 337.0929 C16H18O8 99.8 0.0 272; 326 191.0558 Coumaroylquinic acid III + +
17.30 385.1144 C17H22O10 82.0 −0.9 268; 326 267.0724; 249.0617; 223.0458; 205.0353; 147.0294; 113.0241; 91.0551; 85.0294 Sinapic acid hexoside + + + +
18.01 279.0513 C13H12O7 99.0 −1.0 291; 324 163.0398; 133.0139; 119.0499; 115.0033 Coumaroylmalic acid I + +
18.10 339.0729 C15H16O9 98.1 −1.7 286; 330 309.0621; 223.0616; 208.0372; 193.0507; 164.0480; 149.02543; 133.0142; 115.0039 Sinapic acid malate + +
18.25 279.051 C13H12O7 99.2 0.0 298; 320 163.0401; 133.0139; 119.0500; 115.0033 Coumaroylmalic acid II + +
18.40 309.0625 C14H14O8 96.0 −2.8 286; 325 193.0510; 178.0267; 149.0607; 133.0146; 115.0039 Ferulic acid malate I + +
18.67 309.0623 C14H14O8 98.0 −2.0 288; 320 193.0556; 134.0371 Ferulic acid malate II + +
19.09 193.0511 C10H10O4 98.3 −2.0 293; 325 134.0373 trans-Ferulic acidb + +
19.62 193.0503 C10H10O4 84.7 0.3 282; 325 134.0373 Ferulic acid isomer + +
 
Flavonoids–flavonols
13.09 771.2002 C33H40O21 97.5 −1.7 356 609.1459; 462.0801; 463.0871; 301.0352; 300.0258 Quercetin O-deoxyhexoside di-hexosidec + + + +
13.39 625.141 C27H30O17 87.5 −1.0 346 463.0893; 462.0814; 301.0360 Quercetin O-di-hexosidec + + + +
15.59 755.2052 C33H40O20 94.1 −1.6 356 301.0359; 300.0279 Quercetin di-deoxyhexoside hexosidec + + + +
17.18 609.1486 C27H30O16 93.8 −1.9 354 463.0890; 300.0278; 273.0398; 257.0448; 229.0502; 178.9983; 121.0297; 151.0036; 107.0142 Quercetin-3-O-rutinosideb (rutin) + + + +
17.94 463.0888 C21H20O12 99.8 −0.3 354 301.0349; 300.0278; 151.0037 Quercetin-3-O-glucosideb (isoquercetin) + + + +
18.68 549.0882 C24H22O15 99.2 0.6 354 505.0986; 463.0874; 301.0351; 300.0276 Quercetin 3-O-(6′′-malonyl)glucoside + + + +
23.05 301.0373 C15H10O7 83.2 −0.8 371 273.0399; 178.9983; 151.0034; 121.0296; 107.0139 Quercetinb + +
 
Flavonoids–flavones
14.76 579.1367 C26H28O15 87.3 −3.3 344 561.1251; 519.1156; 489.1044; 459.0938; 429.0834; 399.0727; 369.0623; 285.0499; 133.0289 Luteolin C-hexoside C-pentoside I + + + +
14.89 579.136 C26H28O15 96.3 −0.7 354 561.1254; 519.1153; 489.1049; 459.0939; 429.0834; 399.0723; 369.0624; 285.0400; 133.0297 Luteolin C-hexoside C-pentoside II + + + +
15.10 563.1415 C26H28O14 98.3 −1.5 336 545.1321; 503.1212; 473.1097; 443.0988; 383.0786; 353.0669; 325.0733; 297.0766; 117.0347 Apigenin C-hexoside C-pentoside Id + + + +
15.60 563.1435 C26H28O14 88.3 −4.7 335 545.1312; 503.1203; 473.1104; 443.0999; 383.07858; 353.0680; 325.0726; 297.0778; 117.0343 Apigenin C-hexoside C-pentoside IId + + + +
16.00 447.0937 C21H20O11 98.7 −1.0 350 429.0821; 387.2027; 357.0615; 327.0512; 285.0404; 133.0138 Luteolin 6-C-glucoside (isoorientin)e + + + +
16.21 563.142 C26H28O14 84.5 −3.3 330 545.1302; 503.1195; 473.1092; 443.0989; 383.0777; 353.0670; 297.0766; 117.0357 Apigenin 6-C-hexose-8-C-pentose IIId + + + +
16.58 447.0938 C21H20O11 98.7 −1.3 350 357.0608; 327.0507; 285.0398; 133.0291 Luteolin 8-C-glucoside (orientin)e + + + +
16.80 577.1579 C27H30O14 98.2 −2.0 330 457.1140; 413.0880; 293.0455 Apigenin C-hexoside C-deoxyhexoside + + + +
17.42 431.0989 C21H20O10 99.4 −1.2 326 341.0663; 311.0553; 283.0603; 269.0444; 268.0372; 117.0342 Apigenin 8-C-glucoside (vitexin) + + + +
17.82 447.0932 C21H20O11 89.9 −1.0 352 285.0406; 284.0327; 197.0806; 175.0282; 133.0294 Luteolin 7-O-glucosideb (cynaroside) + + + +
24.29 269.0459 C15H10O5 98.8 0.0 336 241.0495; 227.0352; 225.0553; 201.0551; 183.0445; 181.650; 159.0457; 151.0033; 149.0240; 117.0344; 107.0137 Apigeninb + + + +
22.46 285.0407 C15H10O6 95.7 −1.8 349 267.0298; 257.0453; 243.0297; 241.504; 217.0506; 213.0549; 199.0396; 197.0604; 175.0395; 151.0031; 133.0295 Luteolinb + + + +
 
Flavonoids–flavanones
16.09 611.1624 C27H32O16 94.2 −1.5 280 449.1094; 287.0563; 151.0036; 135.0445 Eriodictyol di-hexosidec +
17.95 449.1099 C21H22O11 96.2 −2.3 280 287.0565; 151.0039; 135.0451; 107.0142 Eriodictyol hexoside Ic +
19.87 449.1086 C21H22O11 96.0 0.9 286 287.058; 151.0033; 135.0450; 107.0138 Eriodictyol hexoside IIc +
22.91 287.0569 C15H12O6 97.7 −2.5 282 151.0039; 135.0449; 125.0241; 107.0139; 83.0137 Eriodictyol + +
24.46 271.0617 C15H12O5 98.8 −2.0 289 177.0183; 151.0034; 119.0499; 107.0137 Naringenin + + + +
 
Flavonoids–flavanols
14.52 289.0717 C15H14O6 81.5 0.6 278 245.0821; 205.0497; 203.0707; 161.0606; 125.0245 (+)-Catechinb + + + +
 
Flavonoid–flavanonols
19.50 303.0510 C15H12O7 98.7 −0.1 283 285.0399; 151.0034; 125.0240 Dihydroquercetin (taxifolin) + +
 
Flavonoid–isoflavones
22.68 547.1093 C25H24O14 88.6 −0.7 503.1204; 299.0558; 284.0320; 165.0191; 149.9954; 133.0294; 121.0292 Hydroxygenistein methyl ether malonylhexoside + +
24.46 269.0459 C15H10O5 85.5 −0.9 260; 330 241.0492; 225.0556; 201.0552; 151.0031; 133.0292; 119.0504; 117.0349; 107.0139 Genisteinb +
25.82 299.0555 C16H12O6 99.6 2.2 260; 335 298.0475; 285.0357; 284.0310; 256.0370; 240.0419; 239.0343; 165.0190; 149.9955; 133.0289; 121.0291 7-Methoxy 2′-hydroxy genistein (cajanin) + + + +
26.49 353.1037 C20H18O6 97.9 −1.9 266 325.1074; 298.0472; 283.0604; 219.0655; 175.0397; 133.0290; 133.0658 Prenylhydroxygenistein If + +
27.19 353.1034 C20H18O6 84.2 −2.2 264 325.1074; 285.1127; 284.0322; 219.0657; 175.0398; 151.0761; 133.0657; 133.0295 Prenylhydroxygenistein IIf + + + +
27.62 353.1037 C20H18O6 97.5 −2.0 264; 344 325.1078; 285.1127; 284.0320; 219.0660; 175.0762; 151.0761; 151.0032; 133.0657; 133.0293 Prenylhydroxygenistein IIIf + + + +
27.69 337.1087 C20H18O5 94.8 −2.7 293.0462; 282.0534; 269.1190; 254.0516; 133.0658; 117.0346 Prenylgenistein Ig + + + +
27.82 283.0614 C16H12O5 99.7 −0.5 268.0374; 239.0348; 151.0040; 132.0214; 107.0133 Genistein 4′-methyl ether (biochanin A) + + + +
28.54 337.1082 C20H18O5 98.2 0.2 265; 339 293.0449; 282.0526; 269.0436; 268.0368; 254.0564; 238.0622; 225.0469; 133.0287 Prenylgenistein IIg + + + +
29.10 337.1084 C20H18O5 99.0 −0.3 266; 340 293.0452; 282.0528; 269.0446; 268.0370; 253.0500; 254.0574; 238.0624; 133.0923 Prenylgenistein IIIg + + + +
 
Hydroxycoumarins
13.09 339.0728 C15H16O9 94.8 −2.4 279; 330 177.0191; 133.0293 Esculetin hexoside I + + + +
13.71 339.075 C15H16O9 83.4 −0.1 279; 335 177.0197 Esculetin hexoside II + +
15.39 177.0187 C9H6O4 97.0 −3.9 149.0241; 133.0293; 105.0346 Dihydroxycoumarin I + + + +
18.32 205.0146 C10H6O5 98.6 −1.8 286 161.0243; 133.0295; 117.0348; 105.0347; 89.0396; 77.0398 6-Carboxyl-umbelliferone + +
19.34 161.0244 C9H6O3 97.4 −1.7 283; 324 133.0291; 117.0342; 105.034 7-Hydroxycoumarinb (umbelliferone) + + + +
20.86 177.0194 C9H6O4 93.5 0.7 285 149.0247; 133.02937; 105.0346 Dihydroxycoumarin II + + + +
22.60 205.0517 C11H10O4 92.2 −5.2 244; 252sh; 289; 338 187.0400; 161.0607; 146.0372; 133.0657; 118.0419; 105.0709 Phellodenol A/hydrated form of 4′,5′-dihydropsoralen + +
22.94 235.0616 C12H12O5 97.8 −1.7 255; 282 217.0499; 201.0189; 191.0712; 176.0477; 161.0241; 148.0523; 133.0293; 117.0345 Murrayacarpin B/di-hydrated form of bergapten + +
27.95 229.0872 C14H14O3 99.5 −0.4 213.0553; 185.0603; 146.0368; 130.0420; 118.0426 Prenyl-7-hydroxycoumarin + + +
 
Others
17.88 365.0964 C17H18O9 97.8 −1.7 244; 288; 334 203.0347; 159.0453; 131.0497; 130.0421; 103.0552 (2Z)-3-[6-(β-D-Glucopyranosyloxy)-1-benzofuranyl]-2-propenoic acid (psoralic acid glucoside) + +


Table 3 Other phenolic compounds characterized using the positive ionization mode in leaves and fruits of F. carica cultivars ‘Tounsi’ and ‘Temri’
RTa (min) [M + H]+ Formula Score Error (ppm) UVa (nm) Main fragments via MS/MS Proposed compound Presence
‘Tounsi’ ‘Temri’
La Fa La Fa
a RT, retention time; L, leaves; F, fruits. The UV data agreed with Dueñas et al.;4 Teixeira et al.;8 Frérot et al.;55 Tang et al.65b Hydroxypsoralen hexoside could be 5-hydroxypsoralen hexoside (bergaptol hexoside) or 8-hydroxypsoralen hexoside (xanthoxol hexoside).c Marmesin was previously described in F. carica and its enantiomeric form nodakenetin in Ficus tsiangii.d Hydroxypsoralen could be 5-hydroxypsoralen (bergaptol) or 8-hydroxypsoralen (xanthoxol) according to Yang et al.52e Compounds described here for first time in F. carica but described in the family Moraceae and other families (see KNApSAck, Reaxys or SciFinder databases).f Non detected in the negative ionization mode.g Compounds described here for first time in the family Moraceae and common in the family Fabaceae (see KNApSAck, Reaxys or SciFinder databases).
Anthocyanins
11.51 611.1603 C27H31O16 93.9 −0.3 520 449.1078; 287.0565 Cyanidin 3,5-diglucoside + +
13.13 595.1667 C27H31O15 98.5 0.5 282; 520 449.1073; 287.0547 Cyanidin 3-rutinoside + +
[thin space (1/6-em)]
Furanocoumarins
15.97 365.0872 C17H16O9 98.6 −0.9 250; 264; 308 203.0336; 175.0438; 147.0438; 131.0387; 119.0487; 101.0387; 91.0540 Hydroxypsoralen hexoside Ib + +
16.65 365.0871 C17H16O9 96.9 −1.0 252; 264; 310 203.0336; 175.0389; 147.0440; 131.0395; 119.0485; 91.0539 Hydroxypsoralen hexoside IIb + +
17.58 247.0969 C14H14O4 94.3 −2.4 229.0845; 213.0548; 189.0574; 175.0393; 147.0438; 119.0489; 103.0545 Marmesin isomer Ic + + + +
17.64 409.1496 C20H24O9 96.2 −1.0 247.0962; 229.0862; 213.0545; 185.0602; 175.0389; 147.0348; 119.0487; 91.0543 Marmesinin + +
17.77 235.0606 C12H10O5 93.2 −3.3 256; 303 217.0505; 202.0259; 174.0547; 131.0489; 115.0537 Methoxypsoralen derivative (hydrate) + +
21.8 189.0549 C11H8O3 86.8 −1.5 250; 290 161.0605; 147.0441; 133.0644; 119.0489; 105.0700 4′,5′-dihydropsoralen + +
22.05 247.0971 C14H14O4 95.0 −2.6 255 229.0858; 213.0545; 189.0537; 175.0392; 147.0442; 119.0492; 103.0544 Marmesin isomer IIc + + + +
22.30 305.1030 C16H16O6 95.7 −3.0 257; 266; 310 203.0344; 175.0391; 159.0441; 147.0438; 131.0489; 119.0490 Oxypeucedanin hydrate + +
22.48 203.0343 C11H6O4 85.8 −2.0 254; 269; 306 147.0442; 131.0494; 129.0332; 119.0496; 101.0376; 91.0541 Hydroxypsoralend,e + +
24.46 187.0317 C11H6O3 80.0 −1.7 254; 296; 328 159.0440; 131.0492; 115.0542; 103.0543 Psoralen + + + +
26.01 217.0502 C12H8O4 97.6 −2.4 258; 266; 310 202.0259; 174.0311; 159.0447; 146.0359; 131.0490; 118.0410; 115.0486 Methoxypsoralen + + + +
26.26 287.0918 C16H14O5 99.4 −1.2 203.0338; 175.1124; 159.0429; 147.0430; 131.0477; 119.0487; 103.0550 Oxypeucedanin + +
28.25 271.0980 C16H14O4 91.8 −5.3 229.0503; 215.0349; 203.0349; 201.0554; 187.0397; 173.0603; 159.0448; 131.0495; 117.0702 Isopentenoxypsoralene + +
31.16 285.1131 C17H16O4 95.5 −3.4 268; 309 243.0638; 229.0478; 217.0473; 201.0530; 186.0293; 115.0521 Prenyl methoxypsoralen + + + +
[thin space (1/6-em)]
Isoflavonesf
30.85 299.0906 C17H14O5 96.5 2.9 262; 329 284.0660; 267.0633; 256.0711; 243.0998; 166.0242; 137.0576 Hydroxy-dimethoxyisoflavoneg + + + +
[thin space (1/6-em)]
Others
17.21 205.0502 C11H8O4 96.1 −3.5 255; 290; 335 187.0401; 133.0648; 131.0491; 115.0537; 107.0491; 105.0700; 103.0541 Psoralic acid/dihydro-hydroxypsoralen + +


On the one hand, the UV-Vis was a valuable tool for classifying phenolic compounds into families and subfamilies according to the presence of one or two characteristic absorption bands in the UV: band I and band II that come from the B-ring cinnamoyl structure and the A-ring benzoyl or benzene structure, respectively. In this regard, the wavelength of maximum absorption for the characterized phenolic compounds is depicted in Tables 2 and 3, as commented above. Besides, as an example, Fig. S1 shows the UV spectra of several phenolic types from F. carica, where band I ranged from 325–371 nm, approximately, and band II was around 260–298 nm. In the case of flavonoids, at the same time that the heterocyclic C-ring structure serves for their sub-classification, the most intensive band also depends on this ring. For example quercetin (flavonol) showed a prominent band I with a maximum at 371 nm, whereas naringenin (flavanone) presented a maximum at 289 nm that comes from the band II (Fig. S1). Genistein (isoflavone) was characterized by a maximum around 260 nm with higher intensity than the second maximum at 330 nm. This UV absorption behaviour enabled to differentiate isoflavones from flavones, preliminarily. In addition, anthocyanins presents a maximum absorption at visible wavelengths, around 520 nm, that is a characteristic feature of this flavonoid subclass.

On the other hand, the QTOF mass analyzer delivers accurate mass measurements and isotopic fidelity (see Experimental section) that allow the molecular formula of the target compound to be obtained. Therefore, in order to procure confident formula assignments for target molecular ions, the lower mass error value and the higher MS score the better (see values in Tables 2 and 3). Afterwards, databases as well as literature were consulted for the retrieval of chemical structure information taking the MS and UV data into account. Finally, using MS/MS analyses, the structure of the parent compound may be tentatively confirmed through studying the fragmentation pattern: fragment ions and neutral losses, which are also accurately measured. As an example, this general identification process is summarized in Fig. S2. Moreover, the RT served as criterion of polarity and elution order. In this way, a total of 13 phenolic compounds were confirmed with standards by comparison of the RT, UV spectra and MS/MS data in order to validate our characterization process (see Table 2).

Briefly, with a concise data mining, 91 phenolic compounds were characterized in the negative ionization mode (method 1) including hydroxybenzoic acids, hydroxycinnamic acids, flavonoids that were represented by flavonols, flavones, flavanones, flavanonols, flavanols and isoflavones subclasses, and hydroxycoumarins (Table 2). Several of these compounds were also detected using the analytical method 2 (data not shown). These data were complemented with 18 phenolic compounds tentatively characterized using the positive ionization mode, belonging to anthocyanins, furanocoumarins and a isoflavone (Table 3), which were either poorly ionized in the negative ionization mode or undetectable. Furthermore, the major part of the characterized phenolic compounds were tentatively reported in F. carica for the first time in this work (Fig. S3), and other unreported phenolic structures were proposed as well according to their UV, MS and MS/MS information. Several previous studies on F. carica applied GC and HPLC coupled to several detectors, including mass analyzers such as quadrupole and ion trap.4,7,8,10–14 However, there were few compounds identified in these works, which are in the range from 4 to 15. One of the reason is that the authors focused on a particular phenolic subclass, e.g. anthocyanins,4,7 or target phenolic compounds.8,11 Therefore, at this point, our findings remark the potential of RP-UHPLC-DAD-QTOF-MS in order to perform successful and extensive characterization works of plant extracts and as starting point for structure elucidation of new molecules. In this regard, the MS analysis via electrospray ionization in the negative and positive ionization modes was complementary and enabled the detection and characterization of a large number of compounds. However, the analyst must be cautious in offering interpretations until all the information is evaluated. It is probably the most critical and long time-consuming part since, although there are efforts to generate spectral libraries using standards, unfortunately LC-ESI-MS methods often lack the consistency, standardization or reproducibility that characterizes GC-MS or nuclear magnetic resonance spectroscopy.27

The chromatographic profiles are depicted in Fig. 2 that show the base peak chromatograms (BPC) of leaves and fruits of both cultivars that represent the ions detected in negative ionization mode using method 1, and the UV chromatograms at 254 and 520 nm, at which furanocoumarins and anthocyanins, respectively, show absorption,4,8 using method 2 (see Experimental section). These chromatographic profiles, BPC and UV at 254 nm, show that the leaves presented richer qualitative and quantitative profiles, explaining our previous results for TPC and antioxidant activity. However, not surprisingly, anthocyanins were only detected in fruits.


image file: c4ra16746e-f2.tif
Fig. 2 Chromatographic profiles of the leaves and fruits from F. carica cultivars ‘Tounsi’ and ‘Temri’ obtained by RP-UHPLC-DAD-QTOF-MS: (a and b) base peak chromatogram (BPC) in negative ionization mode using analytical method 1 and (c and d) UV chromatograms at 254 and (e and f) at 520 nm using analytical method 2. In each figure, the intensity was scaled to the largest area.

Regarding non-phenolic compounds, several organic acids, amino acids and other compounds were also characterized, and these are additionally described in the ESI, see Table S1 and non phenolic compounds information. Furthermore, Table S3 also contains information about certain unknown compounds that their MS/MS spectra is related to the MS/MS of hydroxybenzoic derivatives. Double bond equivalents (DBE) are reported in this table since this value is related to the total number of combined rings and double bonds in the molecule, and so it is useful as indicator of aromaticity or unsaturation. For example, a benzene ring has 4 DBE, that is one ring and three double bonds.

Phenolic acids: hydroxybenzoic, hydroxycinnamic acids and others. Overall, 45 phenolic acids were found in F. carica (Tables 2 and S1), belonging to hydroxybenzoic and hydroxycinnamic acids. The main qualitative differences were found between leaves and fruits. The first phenolic class with a more polar feature eluted over a period of 10.61 to 15.90 min, whereas the second class compounds eluted between 11.19 and 19.62 min. In general, phenolic acids and their derivatives ionized better in the negative ionization mode and most of them presented a loss of 18.0106 u (H2O) and 43.9898 u (CO2) in MS/MS, which is consistent with previous findings in Gómez Romero et al.28 and Abu-Reidah et al.29 Interestingly, the leaves were richer in phenolic derivatives formed by conjugation with sugars and organic acids, including malic and quinic acid. However, the free forms of hydroxybenzoic, caffeic and ferulic acids, except vanillic acid, were only present in fruits.

It is worth mentioning that all hydroxybenzoic acids except dihydroxybenzoic acid were reported for the first time in F. carica. The new compounds were derivatives of hydroxybenzoic, dihydroxybenzoic and trihydroxybenzoic acid (e.g. gallic acid), being O-methylated (e.g. vanillic and syringic acids) or conjugated with hexose, pentose and malic acid. These moieties were assigned according to their respective neutral losses established on the basis of the fragmentation pattern in MS/MS, as previously reported.28–31 As an example, Fig. 3a shows the MS/MS spectra of the isomer of syringic acid malate (isomer I) (m/z 313.0569): 197.0462 ([C9H10O5 − H]), 133.0145 ([C4H6O5 − H]) and 115.0039 ([C4H4O4 − H]), which correspond to free syringic acid ion after the loss of malic acid, malic acid ion and its fragment ion generated by the loss of H2O, respectively. In addition, the presence of fragments at m/z 167.0354 and 153.0559 indicated the loss of CH2O and CO2 from the methoxy group and the carboxylic acid moiety of the phenolic acid, respectively. This compound was detected only in the leaves of both cultivars.


image file: c4ra16746e-f3.tif
Fig. 3 Examples of MS/MS spectra of phenolic compounds highlighting the main fragments from F. carica: (a) syringic acid malate (isomer I), (b) quercetin 3-O-(6′′-malonyl) glucoside, and (c) methoxypsoralen.

A total of 24 hydroxycinnamic acids were derivatives of coumaric, caffeic, ferulic and sinapic acids. Overall, hydroxycinnamics also presented a higher signal in leaves than in fruits (Fig. S4a and d). The presence of caffeic acid and trans-ferulic acid in fruits and chlorogenic acid in fruits and leaves was confirmed with standards and presented the same RT, molecular formula, UV maximum and fragmentation pattern. These compounds have been previously reported in this species.8,9,32–34 Moreover, other three isomers of chlorogenic acid were also found. Recently, Oliveira et al.9 described the isomers 3-O- and 5-O-caffeoylquinic acids (chlorogenic acid) in Portuguese white fig samples.

Interestingly, as for the aforementioned phenolic acid class, several conjugated forms were reported for the first time in F. carica and as well as in the Moraceae family (Tables 2 and S1). For example, three isomers of caffeoylquinic acid hexoside were characterized based on their molecular formula and UV and MS/MS spectra, which was in agreement with previous studies on other plant families.30,35,36 In a similar manner, the fragmentation pattern of caffeic, coumaric and ferulic acids conjugated with hexose or organic acids were in accordance with previous studies.28–30,32,35 Overall, these conjugations could be established on the basis of the MS/MS spectra, because the moieties of the latter and/or the free phenolic acid were observed (Tables 2 and S1). For example, fragment ions with m/z values of 191.0561 ([C7H12O6 − H]) (quinic acid) and 179.0350 ([C9H8O4 − H]) (caffeic acid) were released from caffeoylquinic acid isomers.

Finally, a phenylpropanoid acid related to furanocoumarin psoralen was assigned as psoralic acid glucoside, according to the recent findings in F. carica leaves (Takahashi et al.32), which also suggested that this compound could be a precursor of psoralen. Their fragmentation pattern agreed with the Takahashi's study, as we also observed the loss of glucose (m/z 203.0347) and the loss of CO2 (m/z 159.0453) as the main fragments in MS/MS. This compound was detected in leaves (Fig. S4b and e). Furthermore, a compound related to this was detected in negative and positive ion modes (e.g. see compound with m/z value at 205.0502 and RT 17.21 min in Tables 3 and S2), which could be the aglycone or a dihydro form of hydroxypsoralen. The MS data, the UV spectra and published literature were not enough to elucidate the structure of this compound.

Flavonoids. As commented above, UV-Vis spectra can be used as an indicative tool for the primary characterization of flavonoids, whereas MS and MS/MS information can provide additional and significant information.37 In this way, the flavonols, flavones, flavanones, flavanonols and isoflavones were characterized in the negative ionization mode (Tables 2 and S1) and two anthocyanins in positive ionization mode (Tables 3 and S2).

The flavonols quercetin, quercetin-3-O-glucoside and quercetin-3-O-rutinoside were confirmed by standards and previously reported in fresh and dried figs.8–10,32–34,38 A malonyl derivative of quercetin was found at RT 18.68 min, the fragmentation pattern (Fig. 3b) being in agreement with Takahashi et al.32 and so characterized as quercetin 3-O-(6′′-malonyl)glucoside. In the case of quercetin di-deoxyhexoside hexoside, it is tentatively described here in F. carica for the first time, and has been previously reported in other plant families (e.g. Table S1). In general, new quercetin derivatives in F. carica probably contain at least a sugar at the position 3 of the C-ring that produces a shift of λmax from band I, which comes from the B-ring cinnamoyl structure, of quercetin to a lower wavelength (<20 nm).36

Flavones were among the most qualitatively abundant fig flavonoids and presented slight distribution differences between leaves and fruits. In the case of luteolin-7-O-glucoside, luteolin and apigenin, their identification was resolved by means of comparison of the RT, UV absorption and MS/MS spectra with commercial standards. When standards were unavailable, MS/MS helps in the assignment, together with the previous literature. For example, consecutive neutral losses of 18.0106 u (H2O), 60.0211 u (C2H4O2), 90.0317 u (C3H6O3), 120.0423 u (C4H8O4), 180.0634 u (C6H12O6) and/or 210.0740 u (C7H14O7) are considered to be characteristic of the fragmentation pattern of C-glycosylated compounds. The MS/MS spectra for these compounds are in good agreement with previous studies.39 In contrast to C-glycosides, the MS/MS spectra of the O-glycosidic forms of apigenin and luteolin showed more abundant fragment ions corresponding to the aglycones after the neutral loss of 162.0526 u (hexose) and 308.1122 u (hexose–deoxyhexose), respectively (Tables 2 and S1).

The third group of flavonoids identified was flavanones (Tables 2 and S1). Among them, eryodictiol and naringenin have been previously reported in other Ficus species.40,41 It should be mentioned that the glycosylated flavanones were reported here for the first time in the Moraceae family. For example, eriodictyol di-hexoside (m/z 611.1624, RT 16.09 min) was characterized according to its fragmentation pattern, which agrees with the findings of Iswaldi et al.42 for eriodictyol 5,3′-di-O-glucoside in Aspalathus linearis (Fabaceae). Moreover, the UV-Vis spectra of these compounds showed a main maximum close to 280 nm related to a strong UV band II absorption from the A ring benzoyl structure.36,37 Two isomers of eriodictyol hexoside, with m/z at 449.1099 and 449.1086 and RT 17.95 and 19.87, respectively, were reported in the Cucurbitaceae family.43 It was not possible to distinguish between both isomers, since no commercial standards were available for these compounds. Interestingly, the last three compounds were found only in fruits of cultivar ‘Temri’, being putative characteristic biomarkers of its consumption.

Although isoflavonoids are widely distributed in the Moraceae family,44,45 there is no mention in the literature about this class in F. carica. Our methodology allows ten isoflavones to be tentatively characterized (Tables 2 and S1), including several prenylated forms. Genistein and methylated derivatives of genistein and prenylgenistein have been previously described in other Ficus species.45–47 Only genistein (RT 24.46 min, m/z 269.0459) could be confirmed with standards and was found in the leaves of the cultivar ‘Temri’. The UV data clearly show a main maximum close to 260 nm, which is in accordance with the findings of Shen et al.48 Overall, among other fragments found in the MS/MS spectra of the genistein derivatives, aglycone at m/z value of 269.1190 (even electron) or 268.0374 (odd electron) were detected, and also the characteristic fragment ions at m/z 151.0031 (1,3A), 133.0658 (0,3B) (even electron) or 132.0214 (odd electron) and 117.0346 (1,3B) released from the breakage of genistein backbone. In the case of the malonylhexoside derivative of hydroxygenistein methyl ether, the loss of CO2 from the malonyl group and the subsequent loss of 204.0634 u (C8H12O6, acetyl hexosyl rest) were also observed in MS/MS. A dimethyl ether isoflavone was only detected in positive ionization mode (Tables 3 and S2), exhibiting the UV maximums related to the isoflavone core, and the MS/MS spectrum was in agreement with 7-hydroxy-6,4′-dimethoxyisoflavone (afromosin).49 Since there was no information about this compound in the Moraceae literature and the MS/MS data were not enough to distinguish the exact position of the free hydroxyl or methoxy groups, the compound was denominated as hydroxy-dimethoxyisoflavone.

Interestingly, the prenylated isoflavones presented a remarkably higher signal in leaves than in fruits (Fig. S4c and f). Not surprisingly, they eluted at higher RT due to the presence of this lipophilic prenyl side chain, with an RT from 26.49 to 29.10 min. The UV data and main MS/MS fragments agreed with prenylated forms of genistein (6-, 3′-, and 8-prenylgenistein) present in the Lupinus species.48 In this regard, 6- and 8-prenylgenistein was reported in stem barks and fruits of other Ficus species (e.g. Ficus tikoua).47,50 Furthermore, related prenylated forms linked to hydroxygenistein were also tentatively characterized, and the UV data agreed with the findings of Shen et al.48 In general, these prenylated compounds were characterized by the neutral loss of C4H7 (55.0548 u) and C5H9 (69.0704 u) from the prenyl moiety, amongst others. In this regard, prenylated flavonoids possess unique bioactivities relative to their unmodified parent compounds, particularly potent antifungal activity.47,48

Finally, using the analytical method 1, the flavanol (+)-catechin, which was confirmed with the standard, and the flavanonol dihydroquercetin were also detected, in accordance with previous studies on the Ficus species.10,13,33,40,41

Using analytical method 2, two anthocyanins could be detected in dried fig fruits at 520 nm (see Fig. 2e and f). According to the MS and MS/MS data obtained in the positive ionization mode and the published studies on fig fruits,4 they were assigned to cyanidin 3,5-diglucoside (m/z 611.1613, C27H31O16) and cyanidin 3-rutinoside (m/z 595.1667, C27H31O15) (Tables 3 and S2).

Hydroxycoumarins. The presence of 7-hydroxycoumarin (umbelliferone) was confirmed with the standard. This compound was previously reported in F. carica.45 and it is suggested that it is the precursor of furanocoumarins.51 The rest of the hydroxycoumarins were putatively characterized on the basis of the MS/MS spectra, UV data and literature.40,45 All of these compounds were found in the leaves and some of them in fruits, too. Their fragmentation pattern was characterized by the loss of CO (27.9949 u), CO2 (43.9898 u) and, subsequently, C2H4 (28.0313 u) from the aglycone, in agreement with our previous findings for lettuce (Lactuca sativa) leaves.29 A prenylated form of 7-hydroxycoumarin was also tentatively characterized at RT 27.95 min and m/z 229.0872 (C14H14O3), which showed the characteristic loss of C4H7 (55.0548 u) from the prenyl moiety in MS/MS at m/z 174.0319, as observed above. Several fragments were also in agreement with the findings of Yang et al.52
Furanocoumarins. There are two type of furanocoumarins in nature, linear and angular ones.53 F. carica contains mainly the first class, with psoralen and 8-methoxypsoralen (bergapten) being the major representatives.12,24,32 In this regard, a total of 14 furanocoumarins were tentatively characterized in Tunisian figs in positive ionization mode, including the aforementioned compounds (Tables 3 and S2). The major part of the characterized furanocoumarins are described here for the first time in F. carica and several of them in the Moraceae family (e.g. isopentenoxypsoralen, at RT 28.25 min and m/z 271.098). Alternatively, others have been previously reported in other Ficus species, such as marmesin isomers, 4′,5′-dihydropsoralen and oxypeucedanin hydrate (Table S2). In agreement with Yang et al.'s study on Radix glehniae,52 we detected a characteristic series of fragment ions for furanocoumarins that were mainly generated by consecutive losses of CO (e.g. Fig. 3c). As stated above, in a similar way the loss of C3H6 (42.0470 u), C4H8 (56.0626 u) and C5H8 (68.0626 u) from the prenyl moiety was also observed in the MS/MS spectra of prenylated furanocoumarins, isopentenoxypsoralen and prenyl methoxypsoralen.52,54 In addition, the UV data of furanocoumarins also agreed with that of Frérot et al.55,56

Linear furocoumarins have received great attention since these compounds, used medicinally and in a controlled way, may represent a novel class of natural drugs that are potentially useful for the photodynamic treatment of several skin diseases.12 In this regard, F. carica leaves could be of interest, thanks to their qualitatively rich profiles (Tables 3 and S2; Fig. 2).

3. Conclusions

Despite the popularity of the consumption of dried fig fruits, there is little information about its antioxidant activity. Moreover, in the case of its qualitative phenolic composition, previous studies have only focused on target phenolic compounds. In our study, a total of 109 phenolic compounds were characterized in F. carica samples. Most of them were reported for the first time in F. carica species. In addition, fig leaves presented a richer phenolic qualitative profile with also a higher total phenol content in comparison to fruits. In this regard, phenolic acids conjugated with sugars and organic acids as well as furanocoumarins were mainly present in leaves, but not in fruits. Concurrently, F. carica leaves exhibited stronger antioxidant capacity by both electron or hydrogen transfer mechanisms. Therefore, our results are of interest to further studies on the phytochemical composition of F. carica and the Moraceae family; additionally, the antioxidant values may be used as references for future researches to make comparisons with other fig cultivars. Overall, these results contribute to explaining the past and current usage of F. carica in folk medicine, as leaves extracts can be regarded as a promising source of antioxidant phenolic compounds for further uses in pharmacology and cosmetology.

4. Experimental

Chemical and reagents

Ethanol, acetonitrile, formic acid and glacial acetic acid were purchased from Fisher Chemicals (ThermoFisher, Waltham, MA, USA). Solvents used for extraction and analysis were of analytical and HPLC-MS grades, respectively. Ultrapure water was obtained by a Milli-Q system (Millipore, Bedford, MA, USA).

The reagents used to measure the TPC and the antioxidant capacity were Folin & Ciocalteu's, sodium carbonate (Na2CO3), 2,2′-azobis(2-methylpropionamidine) dihydrochloride (AAPH), 2,4,6-tris(2-pyridyl)-s-triazine (TPTZ), 2,2′-azino-bis(3-ethylbenzothiazoline-6-sulfonic acid) (ABTS) diammonium salt, 6-hydroxy-2,5,7,8-tetramethylchroman-2-carboxylic acid (trolox), fluorescein, potassium persulphate (K2S2O8) and ferric sulphate (FeSO4). They were purchased from Sigma-Aldrich (St. Louis, MO, USA). Dehydrated sodium phosphate, trihydrated sodium acetate, sodium acetate, ferric chloride (FeCl3·6H2O) and hydrochloric acid (HCl) were obtained from Panreac (Barcelona, Spain). Phenolic standards available in our laboratory were bought from Sigma-Aldrich: chlorogenic acid, caffeic acid, vanillic acid, trans-ferulic acid, rutin, quercetin-3-O-glycoside, quercetin, luteolin-7-O-glucoside, apigenin, luteolin, (+)-catechin, genistein, 7-hydroxycoumarin and gallic acid. The degree of purity of the standards was around 95% (w/w).

Fig samples

Leaves and fruits from the F. carica cultivars ‘Tounsi’ and ‘Temri’ were collected in Sfax region (southeast Tunisia) in August 2013. The samples (about 0.5 kg) was randomly harvested and immediately transferred to the laboratory where they were dried at room temperature in the dark, and then they were finely ground prior to extraction.

Sample preparation

Dried fig leaves and fruits (3 g) were put in amber glass bottle homogenized in 100 mL of 70[thin space (1/6-em)]:[thin space (1/6-em)]30 (v/v) ethanol–water placed on a stirring hot plate for 24 hours at 37 °C and 150 rpm. Each mixture was centrifuged at 8000 rpm for 15 min and the supernatant was collected. Afterwards, the solvent was evaporated to dryness using a rotary evaporator under vacuum at 40 °C, and the residue was redissolved in 3 mL of 70[thin space (1/6-em)]:[thin space (1/6-em)]30 (v/v) ethanol–water. Finally, the supernatants were filtered with a syringe filter (regenerated cellulose, 0.45 μm pore size) and stored at −20 °C until analysis. The extraction was repeated in duplicate.

Total phenol content (TPC)

The TPC of the extracts was determined in triplicate by the colorimetric assay using the Folin–Ciocalteu reagent57 modified according to Romero-de Soto et al.58 with 96-well polystyrene microplates (ThermoFisher) and a Synergy Mx Monochromator-Based Multi-Mode Microplate reader (Bio-Tek Instruments Inc., Winooski, VT, USA). The absorbance of the solution at a wavelength of 760 nm was measured after incubation for 2 hours in the dark and compared with a calibration curve of serially diluted gallic acid, which was elaborated in the same manner. The results were expressed as the equivalents of gallic acid.

Antioxidant capacity assays

TEAC assay. This antioxidant method measures the reduction of the radical cation of ABTS by antioxidants, and is based on Miller et al.'s approach59 The method was modified as described Laporta et al.60 Briefly, the ABTS radical cation (ABTS+˙) was produced by reacting the ABTS stock solution with 2.45 mM of potassium persulfate and keeping the mixture in darkness at room temperature for 12 to 24 h before use. For the antioxidant assay with vegetable extracts, the ABTS+˙ solution was diluted with water until an absorbance value of 0.70 (±0.02) at 734 nm was reached. Afterwards, 300 μL of the ABTS+˙ solution and 30 μL of the extract were mixed for 45 s and measured immediately after 5 min (absorbance did not change significantly up to 10 min). The readings were performed at 734 nm and 25 °C. The result of each sample was then compared with a standard curve made from the corresponding readings of trolox (0.625–30 μM in the microplate wells). Caffeic acid was used as a positive control. The results are expressed in mmol of trolox equivalents/100 g of sample.
FRAP assay. The FRAP assay was conducted following the method described by Benzie and Strain.61 The stock solutions included 300 mM acetate buffer (1.23 g C2H3NaO2 + 0.8 mL C2H4O2 + 49.2 mL of water, pH = 3.6 adjusted with HCl), 10 mM of TPTZ solution in 40 mM HCl and 20 mM FeCl3 in water. The fresh working solution was prepared by mixing 25 mL acetate buffer, 2.5 mL of TPTZ and 2.5 mL of FeCl3 solutions. Briefly, 40 μL of the extracts was mixed with 250 μL of freshly prepared FRAP reagent on a 96-well plate. Samples were incubated for 10 min at 37 °C; then, absorbance was recorded at 593 nm for 4 min on the microplate reader. The final absorbance of each sample was compared with those from the standard curve made from FeSO4·7H2O (12.5–200 μM, final concentration in wells). Caffeic acid was used as a positive control. The results are expressed in mmol of FeSO4 equivalents/100 g of sample.
ORAC assay. The method used was based on that of Ou et al.23 modified by Laporta et al.60 The reaction was carried out in 75 mM phosphate buffer (pH = 7.4), and the final reaction mixture was 200 μL fluorescein and AAPH, which was used at 40 nM and 19 mM, respectively. A freshly prepared AAPH solution was used for each experiment. The temperature of the incubator was set at 37 °C and the fluorescence was recorded 15 min after the addition of AAPH. The microplate was immediately placed in the reader and the fluorescence recorded every minute for 180 min. The microplate was automatically shaken prior to each reading. All the fluorescent measurements are expressed relative to the initial reading (AUC for each well). A blank (phosphate buffer instead of the antioxidant solution), several dilutions of trolox (0.625–15 μM, final concentration in wells) and samples (at least four valid dilution points) were measured. All the reaction mixtures were prepared in triplicate, and at least two independent assays were performed for each sample. The net area under curve (AUC) corresponding to the trolox or samples was calculated by subtracting the AUC corresponding to the blank. Caffeic acid was used as a positive control. ORAC values were expressed as trolox equivalents by using the standard curve calculated for each assay. The final results were in mmol of trolox equivalents/100 g of samples.

Characterization of phenolic compounds by UHPLC-DAD-QTOF-MS

Analyses were made with an Agilent 1200 series rapid resolution (Palo Alto, CA, USA) equipped with a binary pump, an autosampler and a DAD. The system was coupled to a 6540 Agilent Ultra-High-Definition (UHD) Accurate-Mass Q-TOF LC/MS, equipped with an Agilent Dual Jet Stream electrospray ionization (Dual AJS ESI) interface.

To characterize phenolic compounds, the mobile phases consisted of water plus 0.5% acetic acid (phase A) and acetonitrile (phase B), according to the approach of Abu-Reidah et al.62 (method 1). The following multistep linear gradient was applied: 0 min, 0% B; 10 min, 20% B; 15 min, 30% B; 20 min, 50% B; 25 min, 75% B; 30 min, 100% B; 31 min, 100% B; 34 min, 0% B; 40 min, 0% B. The flow rate was set at 0.50 mL min−1 throughout the gradient. To characterize anthocyanins and furanocoumarins, the mobile phases were water plus 5% formic acid (phase A) and acetonitrile (phase B), according to the approach of Gómez-Caravaca et al.63 (method 2). Separation was carried out with a Zorbax Eclipse Plus C18 column (150 × 4.6 mm, 1.8 μm of particle size) at room temperature. The UV spectra were recorded from 190 to 600 nm. The injection volume was 5 μL. Samples were diluted by 1/4 with an ethanol–water mix of 70[thin space (1/6-em)]:[thin space (1/6-em)]30 (v/v).

The operating conditions in negative ionization mode were as follows: gas temperature, 325 °C; drying gas, nitrogen at 10 L min−1; nebulizer pressure, 20 psig; sheath gas temperature, 400 °C; sheath gas flow, nitrogen at 12 L min−1; capillary voltage, 4000 V; skimmer, 45 V; octopole radiofrequency voltage, 750 V; focusing voltage, 500 V, with the corresponding polarity automatically set. Spectra were acquired over a mass range from m/z 100 to 1700 and for MS/MS experiments from m/z 70 to 1700. In the case of anthocyanins and furanocoumarins, MS analyses were performed in positive ionization mode based on several studies,8,64 with the parameters set as commented above, but with the corresponding polarity. Reference mass correction of each sample was performed with a continuous infusion of Agilent TOF mixture containing trifluoroacetic acid (TFA) ammonium salt (m/z 112.9856 corresponding to TFA) and hexakis (1H,1H,3H-tetrafluoropropoxy) phosphazine (m/z 1033.9881 corresponding to the TFA adduct) for negative ionization mode, while using purine (m/z 121.0508) and hexakis (1H,1H,3H-tetrafluoropropoxy) phosphazine (m/z 922.0098) for positive ionization mode. The detection window was set to 100 ppm.

Data analysis was performed on a Mass Hunter Qualitative Analysis B.06.00 (Agilent technologies). For characterization, the isotope model selected was common organic molecules with a peak spacing tolerance of m/z 0.0025 and 7 ppm. Then, the characterization of the compounds was done taking into account the generation of candidate molecular formula with a mass error limit of 5 ppm and also considering RT, experimental and theoretical masses, and MS/MS spectra. The MS score related to the contribution to mass accuracy, isotope abundance and isotope spacing for the generated molecular formula was set at ≥80. Confirmation was made through a comparison with standards, whenever these were available in-house. Consequently, the literature on Moraceae and the following chemical structure databases were consulted: PubChem (http://pubchem.ncbi.nlm.nih.gov), ChemSpider (http://www.chemspider.com), SciFinder Scholar (https://scifinder.cas.org), Reaxys (http://www.reaxys.com), Phenol-Explorer (http://www.phenol-explorer.eu) and KNApSAcK Core System (http://kanaya.naist.jp/knapsackjsp/top.html).

Statistical analysis

Microsoft Excel 2007 (Redmond, WA, USA) was employed for statistical analysis. The correlation between TPC and antioxidant activity was performed using SPSS Statistics 22 (Armonk, NY, USA).

Conflicts of interest

The authors declare no competing financial interest.

Acknowledgements

The authors are grateful to the Andalusian Regional Government Council of Innovation and Science for the Excellence Project P11-CTS-7625, and M. del M. Contreras to the Spanish Ministry of Economy and Competitiveness (MINECO) for the Juan de la Cierva contract. The authors would like also to thank the Ministry of Higher Education, Scientific Research and Information and Communication Technologies, Tunisia, for its support of this research work.

References

  1. M. I. Barolo, N. Ruiz Mostacero and S. N. López, Food Chem., 2014, 164, 119–127 CrossRef CAS PubMed.
  2. E. S. S. Abdel-Hameed, Food Chem., 2009, 114, 1271–1277 CrossRef CAS PubMed.
  3. A. Salhi-Hannachi, K. Chatti, O. Saddoud, M. Mars, A. Rhouma, M. Marrakchi and M. Trifi, Hereditas, 2006, 143, 15–22 CrossRef PubMed.
  4. M. Dueñas, J. J. Pérez-Alonso, C. Santos-Buelga and T. Escribano-Bailón, J. Food Compos. Anal., 2008, 21, 107–115 CrossRef PubMed.
  5. M. T. Sadder and A. F. Ateyyeh, Sci. Hortic., 2006, 107, 347–351 CrossRef CAS PubMed.
  6. J. A. Vinson, L. Zubik, P. Bose, N. Samman and J. Proch, J. Am. Coll. Nutr., 2005, 24, 44–50 CrossRef.
  7. A. Solomon, S. Golubowicz, Z. Yablowicz, S. Grossman, M. Bergman, H. E. Gottlieb, A. Altman, Z. Kerem and M. A. Flaishman, J. Agric. Food Chem., 2006, 54, 7717–7723 CrossRef CAS PubMed.
  8. D. M. Teixeira, R. F. Patão, A. V. Coelho and C. T. Da Costa, J. Chromatogr. A, 2006, 1103, 22–28 CrossRef CAS PubMed.
  9. A. P. Oliveira, P. Valentão, J. A. Pereira, B. M. Silva, F. Tavares and P. B. Andrade, Food Chem. Toxicol., 2009, 47, 2841–2846 CrossRef CAS PubMed.
  10. F. Vallejo, J. G. Marín and F. A. Tomás-Barberán, Food Chem., 2012, 130, 485–492 CrossRef CAS PubMed.
  11. A. Del Caro and A. Piga, Eur. Food Res. Technol., 2008, 226, 715–719 CrossRef.
  12. M. Marrelli, F. Menichini, G. A. Statti, M. Bonesi, P. Duez, F. Menichini and F. Conforti, Food Chem. Toxicol., 2012, 50, 726–733 CrossRef CAS PubMed.
  13. R. Veberic, M. Colaric and F. Stampar, Food Chem., 2008, 106, 153–157 CrossRef CAS PubMed.
  14. A. P. Oliveira, L. R. Silva, P. B. Andrade, P. Valentao, B. M. Silva, R. F. Gonc-Alves, J. A. Pereira and P. G. De Pinho, J. Agric. Food Chem., 2010, 58, 10855–10863 CrossRef CAS PubMed.
  15. S. Khan and M. J. Balick, J. Compl. Alternative Med., 2001, 7, 405–515 CAS.
  16. J. E. Shaw, R. A. Sicree and P. Z. Zimmet, Diabetes Res. Clin. Pract., 2010, 87, 4–14 CrossRef CAS PubMed.
  17. C. Pèrez, J. R. Canal and M. D. Torres, Acta Diabetol., 2003, 40, 3–8 CrossRef PubMed.
  18. O. Saddoud, A. Chatti, A. Salhi-Hannachi, M. Mars, M. Rhouma and M. Trifi, Hereditas, 2007, 144, 149–157 CrossRef CAS PubMed.
  19. R. Apak, S. Gorinstein, V. Böhm, K. M. Schaich, M. Özyürek and K. Güçlü, Pure Appl. Chem., 2013, 85, 957–998 CrossRef CAS.
  20. R. L. Prior, X. Wu and K. Schaich, J. Agric. Food Chem., 2005, 53, 4290–4302 CrossRef CAS PubMed.
  21. C. Rice-Evans, N. Miller and G. Paganga, Trends Plant Sci., 1997, 2, 152–159 CrossRef.
  22. M. Ozgen, R. N. Reese, A. Z. Tulio, J. C. Scheerens and A. R. Miller, J. Agric. Food Chem., 2006, 54, 1151–1157 CrossRef CAS PubMed.
  23. B. Ou, M. Hampsch-Woodill and R. L. Prior, J. Agric. Food Chem., 2001, 49, 4619–4626 CrossRef CAS PubMed.
  24. E. P. Lansky and H. M. Paavilainen, Figs: The Genus Ficus, Taylor & Francis, 2010 Search PubMed.
  25. O. Çalişkan and A. Aytekin Polat, Sci. Hortic., 2011, 128, 473–478 CrossRef PubMed.
  26. J. J. Martínez-García, J. A. Gallegos-Infante, N. E. Rocha-Guzmán, P. Ramírez-Baca, M. G. Candelas-Cadillo and R. F. González-Laredo, J. Eng., 2013, 2013, 1–8 CrossRef PubMed.
  27. A. Scalbert, C. Andres-Lacueva, M. Arita, P. Kroon, C. Manach, M. Urpi-Sarda and D. Wishart, J. Agric. Food Chem., 2011, 59, 4331–4348 CrossRef CAS PubMed.
  28. M. Gómez-Romero, A. Segura-Carretero and A. Fernández-Gutiérrez, Phytochemistry, 2010, 71, 1848–1864 CrossRef PubMed.
  29. I. M. Abu-Reidah, M. M. Contreras, D. Arráez-Román, A. Segura-Carretero and A. Fernández-Gutiérrez, J. Chromatogr. A, 2013, 1313, 212–227 CrossRef CAS PubMed.
  30. I. M. Abu-Reidah, D. Arraez-Roman, A. Segura-Carretero and A. Fernandez-Gutierrez, Food Chem., 2013, 141, 2269–2277 CrossRef CAS PubMed.
  31. N. I. Tahir, K. Shaari, F. Abas, G. K. Ahmad Parveez, H. Ahmad Tarmizi and U. S. Ramli, J. Oil Palm Res., 2013, 25, 72–83 CAS.
  32. T. Takahashi, A. Okiura, K. Saito and M. Kohno, J. Agric. Food Chem., 2014, 62, 10076–10083 CrossRef CAS PubMed.
  33. A. Slatnar, U. Klancar, F. Stampar and R. Veberic, J. Agric. Food Chem., 2011, 59, 11696–11702 CrossRef CAS PubMed.
  34. G. Pande and C. C. Akoh, Food Chem., 2010, 120, 1067–1075 CrossRef CAS PubMed.
  35. A. G. A. W. Alakolanga, A. M. D. A. Siriwardene, N. Savitri Kumar, L. Jayasinghe, R. Jaiswal and N. Kuhnert, Food Res. Int., 2014, 62, 388–396 CrossRef CAS PubMed.
  36. L. Z. Lin, J. Harnly, R. W. Zhang, X. E. Fan and H. J. Chen, J. Agric. Food Chem., 2012, 60, 544–553 CrossRef CAS PubMed.
  37. D. Tsimogiannis, M. Samiotaki, G. Panayotou and V. Oreopoulou, Molecules, 2007, 12, 593–606 CrossRef CAS.
  38. E. Faleh, A. P. Oliveira, P. Valentão, A. Ferchichi, B. M. Silva and P. B. Andrade, Rev. Bras. Farmacogn., 2012, 22, 1282–1289 CrossRef CAS PubMed.
  39. N. Tahir, K. Shaari and F. Abas, J. Agric. Food Chem., 2012, 60, 11201–11210 CrossRef CAS PubMed.
  40. Y. Wang, H. Liang, Q. Zhang, W. Cheng and S. Yi, Biochem. Syst. Ecol., 2014, 57, 210–215 CrossRef CAS PubMed.
  41. X.-G. Wang, X.-Y. Wei, Y.-Q. Tian, L.-T. Shen and H.-H. Xu, Agric. Sci. China, 2010, 9, 690–694 CrossRef CAS.
  42. I. Iswaldi, D. Arráez-Román, I. Rodríguez-Medina, R. Beltrán-Debón, J. Joven, A. Segura-Carretero and A. Fernández-Gutiérrez, Anal. Bioanal. Chem., 2011, 400, 3643–3654 CrossRef CAS PubMed.
  43. I. M. Abu-Reidah, D. Arráez-Román, A. Segura-Carretero and A. Fernández-Gutiérrez, Food Res. Int., 2013, 51, 354–362 CrossRef CAS PubMed.
  44. V. Kuete, B. Ngameni, C. C. F. Simo, R. K. Tankeu, B. T. Ngadjui, J. J. M. Meyer, N. Lall and J. R. Kuiate, J. Ethnopharmacol., 2008, 120, 17–24 CrossRef CAS PubMed.
  45. E. P. Lansky, H. M. Paavilainen, A. D. Pawlus and R. A. Newman, J. Ethnopharmacol., 2008, 119, 195–213 CrossRef CAS PubMed.
  46. N. Darbour, C. Bayet, S. Rodin-Bercion, Z. Elkhomsi, F. Lurel, A. Chaboud and D. Guilet, Nat. Prod. Res., 2007, 21, 461–464 CrossRef CAS PubMed.
  47. S. Wei, W. Wu and Z. Ji, Int. J. Mol. Sci., 2012, 13, 7375–7382 CrossRef CAS PubMed.
  48. G. Shen, D. Huhman, Z. Lei, J. Snyder, L. W. Sumner and R. A. Dixon, Plant Physiol., 2012, 159, 70–80 CrossRef CAS PubMed.
  49. J. Tchoumtchoua, D. Njamen, J. C. Mbanya, A. Skaltsounis and M. Halabalaki, J. Mass Spectrom., 2013, 48, 561–575 CrossRef CAS PubMed.
  50. J. J. K. Bankeu, R. Khayala, B. N. Lenta, D. T. Noungoué, S. A. Ngouela, S. A. Mustafa, K. Asaad, M. I. Choudhary, S. T. Prigge and R. Hasanov, J. Nat. Prod., 2011, 74, 1370–1378 CrossRef CAS PubMed.
  51. K. Szewczyk and A. Bogucka-Kocka, Phytochem.: Global Perspect. Their Role Nutr. Health, 2012, 58–92 Search PubMed.
  52. W. Yang, M. Ye, M. Liu, D. Kong, R. Shi, X. Shi, K. Zhang, Q. Wang and Z. Lantong, J. Chromatogr. A, 2010, 1217, 4587–4600 CrossRef CAS PubMed.
  53. G. F. Spencer, L. W. Tjarks and R. G. Powell, J. Agric. Food Chem., 1987, 35, 803–805 CrossRef CAS.
  54. R. Heinke, K. Franke, K. Michels, L. Wessjohann, N. A. A. Ali and J. Schmidt, J. Mass Spectrom., 2012, 47, 7–22 CrossRef CAS PubMed.
  55. E. Frérot and E. Decorzant, J. Agric. Food Chem., 2004, 52, 6879–6886 CrossRef PubMed.
  56. E. C. Horning and D. B. Reisner, J. Am. Chem. Soc., 1950, 72, 1514–1518 CrossRef CAS.
  57. V. L. Singleton and J. A. J. Rossi, Am. J. Enol. Vitic, 1965, 16, 144–158 CAS.
  58. M. D. Romero-de Soto, P. García-Salas, S. Fernández-Arroyo, A. Segura-Carretero, F. Fernández-Campos and B. Clares-Naveros, Plant Foods Hum. Nutr., 2013, 68, 200–206 CrossRef CAS PubMed.
  59. N. J. Miller, C. Rice-Evans, M. J. Davies, V. Gopinathan and A. Milner, Clin. Sci., 1993, 84, 407–412 CAS.
  60. O. Laporta, L. Pérez-Fons, R. Mallavia, N. Caturla and V. Micol, Food Chem., 2007, 101, 1425–1437 CrossRef CAS PubMed.
  61. I. F. Benzie and J. J. Strain, Anal. Biochem., 1996, 239, 70–76 CrossRef CAS PubMed.
  62. I. M. Abu-Reidah, D. Arráez-Román, R. Quirantes-Piné, S. Fernández-Arroyo, A. Segura-Carretero and A. Fernández-Gutiérrez, Food Res. Int., 2012, 46, 108–117 CrossRef CAS PubMed.
  63. A. M. Gómez-Caravaca, V. Verardo, M. Toselli, A. Segura-Carretero, A. Fernández-Gutiérrez and M. F. Caboni, J. Agric. Food Chem., 2013, 61, 5328–5337 CrossRef PubMed.
  64. A. M. Gómez-Caravaca, A. Segura-Carretero, A. Fernández-Gutiérrez and M. F. Caboni, J. Agric. Food Chem., 2011, 59, 10815–10825 CrossRef PubMed.
  65. D.-Q. Tang, X.-X. Zheng, X. Chen, D.-Z. Yang and Q. Du, J. Pharm. Anal., 2014, 4, 96–106 CrossRef CAS PubMed.

Footnote

Electronic supplementary information (ESI) available. See DOI: 10.1039/c4ra16746e

This journal is © The Royal Society of Chemistry 2015
Click here to see how this site uses Cookies. View our privacy policy here.