 Open Access Article
Creative Commons Attribution 3.0 Unported Licence
Comprehensive and quantitative analysis for controlling the physical/chemical states and particle properties of nanodiamonds for biological applications†
S.
Sotoma
a,
K.
Akagi
b,
S.
Hosokawa
ac,
R.
Igarashi
a,
H.
Tochio
d,
Y.
Harada
e and
M.
Shirakawa
*a
aDepartment of Molecular Engineering, Graduate School of Engineering, Kyoto University, Nishikyo-ku, Kyoto 615-8510, Japan. E-mail: shirakawa@moleng.kyoto-u.ac.jp
bSection of Laboratory Equipment, National Institute of Biomedical Innovation, 7-6-8 Saito Asagi Ibaraki-city, Osaka, 567-0085, Japan
cElements Strategy Initiative for Catalysts & Batteries (ESICB), Kyoto University, Kyotodaigaku Katsura, Nishikyo-ku, Kyoto 615-8520, Japan
dDepartment of Biophysics, Graduate School of Science, Kyoto University, Kitashirakawa-oiwake, Sakyo-ku, Kyoto 606-8502, Japan
eInstitute for Integrated Cell-Material Sciences (WPI-iCeMS), Kyoto University, Yoshida-Honmachi, Sakyo-ku, Kyoto 606-8501, Japan
First published on 13th January 2015
Abstract
The physical/chemical states and properties of nanodiamonds subjected to thermal annealing and air oxidation, which are indispensable processes for the preparation of fluorescent nanodiamonds, were investigated. Specifically, the weight loss, particle size, crystal quality, chemical bonding states of carbon and oxygen, zeta potential, dispersibility, and fluorescent and optically detected magnetic resonance (ODMR) properties were determined using X-ray diffraction (XRD) analysis, transmission electron microscopy (TEM), elemental analysis, dynamic light scattering, Raman analysis, X-ray photoelectron spectroscopy (XPS), IR spectroscopy, and a home-made fluorescence and ODMR microscope. The study focused on small-sized nanodiamonds (∼50 nm), which are applicable for biological research. The obtained results should be useful for controlling the mutually-related physical/chemical states and properties of diamond nanoparticles.
1. Introduction
In recent years, numerous reports have appeared in the literature on the properties of nitrogen-vacancy centers (NVCs) as lattice defects in nanodiamonds (NDs).1 Fluorescence arising from NVCs exhibits perfect photo-stability, undergoing neither photo-bleaching nor photo-blinking,2 a long fluorescence life time,3 and a high quantum yield.4 These photo-properties, along with the ability to achieve diverse surface modifications5 and a reduced cytotoxicity,6 make NDs promising candidates as novel bio-imaging agents.7,8 In addition, optically detected magnetic resonance (ODMR) has been demonstrated for the detection of a single spin ESR of an NVC under ambient conditions, which has attracted significant attention in the fields of quantum information,9 magnetic sensing,10,11 and biomaterials.12,13For the preparation of NDs containing NVCs, thermal annealing and air oxidation processes are indispensable. Thermal annealing at 800 °C under a vacuum results in the trapping of a moving vacancy by a substitutional nitrogen atom, leading to the formation of an NVC.14 Subsequent oxidation in air at 500–600 °C removes the graphite on the ND surface, yielding a fluorescent ND. Many scientists have investigated and reported the optical properties of small-sized NDs (<50 nm) with potential bio-applications.15,16 However, although annealing and oxidation processes affect physical/chemical properties, such as the particle size, crystal quality, and surface chemical termination, little has been learned about the chemical/physical states of NDs.
Gabel et al. reported that air oxidation of NDs is effective for particle size-reduction,17 with an average crystal size reduction of 10.6 nm h−1 at 600 °C during air oxidation under atmospheric conditions. Havlik et al. reported that annealing at 900 °C for one hour resulted in 3-fold brighter ND particles compared to particles annealed under commonly used conditions (temperature and time).18 In addition, several researchers have reported that high-temperature annealing introduces a graphite on the surface, while oxidation effectively removes this graphite.19,20 However, a comprehensive understanding of these physical/chemical states for bio-applicable NDs has not been established. Furthermore, the relationship between these states and ND particle properties, such as dispersibility, fluorescence, and ODMR, has not been reported to date. Changes in these states are expected to affect these important particle properties. By elucidating the relationship between the chemical/physical states and the particle properties, it should be possible to readily prepare fluorescent NDs bearing desired properties. For biological investigations, controlling important factors such as the particle size, crystal quality, surface chemical termination, dispersibility, and fluorescence and ODMR signals will strongly facilitate ND research.
Herein, we report the physical/chemical states and particle properties of pristine NDs and NDs annealed and oxidized at various temperatures and for various lengths of time. The properties were investigated using transmission electron microscopy (TEM), Raman and infrared (IR) spectroscopy, X-ray photoelectron spectroscopy (XPS), X-ray diffraction (XRD) and elemental analyses, and dynamic light scattering. Fluorescence and ODMR signals were detected using a home-built microscope.
2. Results and discussion
2.1 Physical/chemical states of the nanodiamonds
NDs were annealed at 800 °C for two hours under a vacuum in order to increase a concentration of NVCs. Subsequently, the NDs were oxidized at 500 °C, 525 °C, 550 °C, 575 °C, or 600 °C for 1, 2, 3, 4, or 5 hours. First, the weight loss of the NDs during annealing and oxidation was investigated. Due to annealing, 7% of the weight of the NDs was lost. Fig. 1 shows the weight loss of the annealed NDs versus the oxidation time at various oxidation temperatures. The degree of the weight loss highly depended on the oxidation temperature and time. After 5 hours of oxidation, the weight of the NDs remained nearly unchanged at 500 °C, while at 550 °C and 600 °C, significant losses of approximately 40% and 99% were observed, respectively. This weight loss is thought to be due to the isolation of carbon atoms at the surface, which then react with the oxygen and hydrogen in the air to generate carbon oxide. The different degrees of weight loss for the different samples are thought to be related to their physical/chemical states. These three oxidation conditions were thus expected to result in notable differences in the physical/chemical states and were therefore the focus of the present study. Samples are abbreviated as follows: pristine NDs: ND-pris; NDs subjected only to thermal annealing at 800 °C for two hours: ND-800; NDs subjected to thermal annealing at 800 °C for two hours and subsequently oxidation at 500, 550, or 600 °C for five hours: ND-500, ND-550, and ND-600, respectively.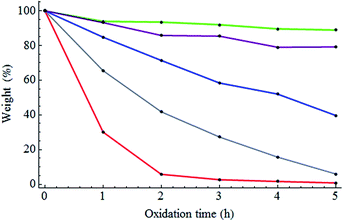 | ||
| Fig. 1 Weight loss of the NDs versus oxidation time at different oxidation temperatures (green: 500 °C; purple: 525 °C; blue: 550 °C; grey: 575 °C; red: 600 °C). | ||
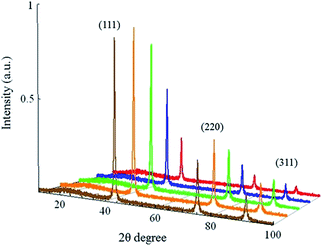 | ||
| Fig. 2 XRD patterns for ND-pris (brown), ND-800 (orange), ND-500 (green), ND-550 (blue), and ND-600 (red). | ||
The ND samples were then observed via TEM in order to elucidate any changes in particle size as a function of the annealing and oxidation processes. Fig. 3 shows photos, TEM images, and size distributions determined from the corresponding TEM images for each of the samples. It can be seen in the photos that ND-pris was a dark-gray color, while ND-800 was black. This change of color may be due to the graphitization of the surface of the NDs during annealing. This graphite was removed by air oxidation, and the degree of whiteness was enhanced with increasing oxidation temperature (a detailed analysis of the surface chemical structure is given in a later section). From the TEM images, it can also be seen that the NDs were not spherical, but had edges. The particle size distributions were similar for ND-pris, ND-800, and ND-500, while the particle sizes for ND-550 and ND-600 were smaller at 35.6 and 14.5 nm, respectively. These results suggested that the surface of ND-800 was graphitized due to annealing, and subsequent oxidation contributed to the removal of the graphite. However, the removal efficiency appeared to depend on the oxidation temperature, because the colors of the different oxidized samples were different. In addition, particle shrinkage occurred when oxidation was performed above 550 °C, and the degree of the size reduction was also temperature dependent.
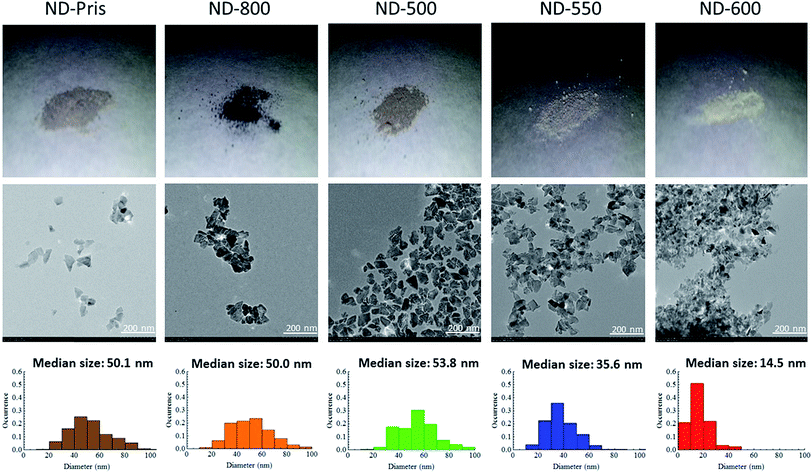 | ||
| Fig. 3 Photos (upper line), TEM images (middle line), and particle size distributions determined from the corresponding TEM images (lower line) of the ND samples. | ||
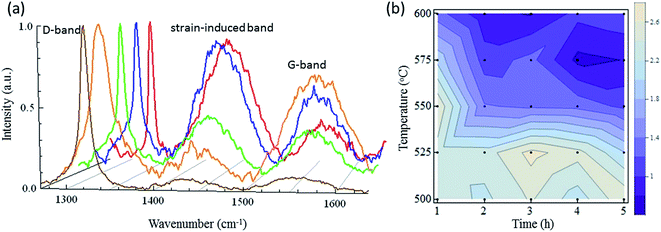
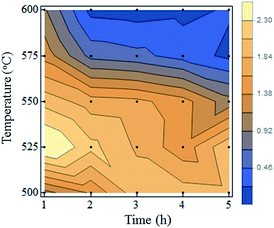
To obtain further insight into the particle shrinkage and crystal qualities, a Raman spectroscopic analysis was performed. Fig. 4a presents the Raman spectra of the samples. Each spectrum has a D-band (sp3 carbon), a strain-induced band, and a G-band (sp2 carbon) near 1332, 1450, and 1550 cm−1, respectively. ND-pris exhibited a sharp D-band peak, but the signal for the strain-induced band and the G-band were weak. In contrast, the D-band in the spectrum of ND-800 was drastically enlarged. This result indicated that graphitization of the NDs occurred during annealing, which is supported by the change in color from gray to black (Fig. 3). Because this graphite was readily removed by oxidation at 500 °C, it is thought that it covered only the surfaces of the NDs. Additional notable changes in the Raman spectra for ND-550 and ND-600 were also observed. The G-band was reduced in the spectra of both ND-550 and ND-600, as was the case for ND-500; on the other hand, the strain-induced bands in the spectra of the former samples were largely enhanced. These results indicated that oxidation above 550 °C induced distortion of the crystal structure, resulting in an increase in the intensity of the strain-induced bands. Such distortion was likely caused by the annihilation of carbon atoms at the surface. Fig. 4b shows a contour map of the ratio of the Raman signal intensity for diamond divided by that of the strain-induced band for each of the prepared samples. The black points represent the individual oxidation conditions. It can be seen from the figure that crystal destruction was triggered in the oxidation temperature range from 525 °C to 550 °C and appeared to be more temperature-dependent than time-dependent.
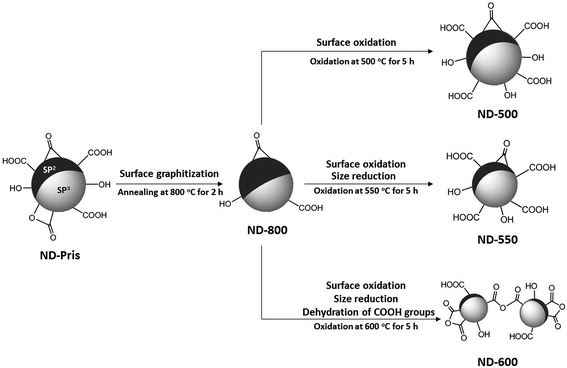
To summarize, it was revealed that annealing at 800 °C introduced graphite on the surfaces of the NDs. Air oxidation at 500 °C was effective for removal of the introduced surface graphite, but not for changing the particle size. On the other hand, air oxidation above 550 °C led to both removal of the graphite and particle size reduction, and the degree of each effect increased with increasing oxidation temperature.
| Element | H | C | N | O |
|---|---|---|---|---|
| ND-pris | 0.22 | 96.28 | 0.1 | 2.45 |
| ND-800 | 0.05 | 98.89 | 0.37 | 0 |
| ND-500 | 0.24 | 96.06 | 0.1 | 2.03 |
| ND-550 | 0.06 | 94.94 | 0 | 3.04 |
| ND-600 | 0.26 | 76.51 | 0 | 2.88 |
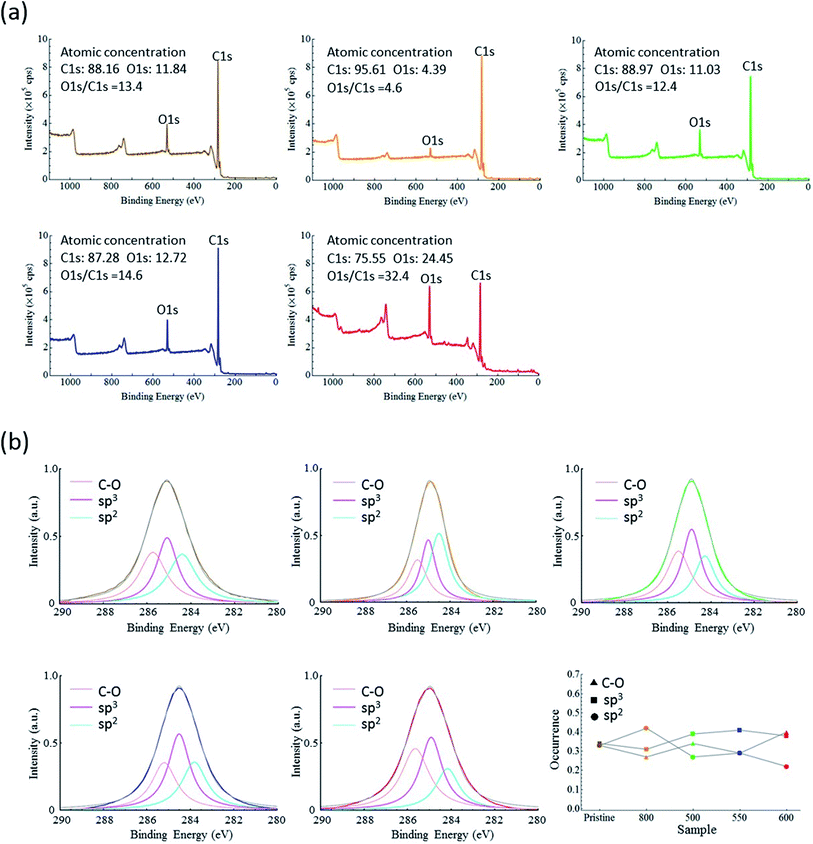
XPS is a favorable method for characterizing material surfaces because the escape depth of an electron is localized to within a few nanometers of the target surface. The survey XPS spectra are shown in Fig. 5a. Each spectrum exhibited C1s and O1s peaks at approximately 285 eV and 533 eV, respectively, but their intensities were different for the different samples. The atomic concentrations of carbon and oxygen were calculated from the corresponding intensities of the C1s and O1s peaks. Notably, 13% of the carbon atoms on the surface of ND-pris were oxidized, which dropped to 8% for ND-800 and then recovered to 12% for ND-500. ND-600 had a relatively high oxygen to carbon ratio of 32%, which can be attributed to the high surface-area-to-volume ratio induced by size reduction. A plot of the ratios of oxygen to carbon estimated from the elemental analysis and XPS results is displayed in Fig. S2.† It can be seen in the figure that the XPS and elemental analysis results were similar, although the XPS data were larger than the elemental analysis data. This difference occurred because XPS only measures the surface area of a particle, while elemental analysis evaluates the entire ND particle. It should also be noted that even for the most oxidized ND sample (ND-600), the oxygen accounted for only 32% of the total atoms on the surface. This low concentration of oxygen limits the surface functionalization of the NDs.
Fig. 5b presents the deconvoluted high resolution C1s spectra of the samples along with a comparison plot of each component for all of the samples. Each spectrum was calibrated against the 374 eV Ag3d peak as an internal standard (survey spectra are shown in Fig. S3†). The C1s spectra were curve-fitted into three peak components with binding energies of 284 ± 0.5, 285 ± 0.5, and 286 ± 0.5 eV, which were attributed to sp2, sp3, and C–O bonds. Each of the peak components was also fitted using the Lorenz model, and the existing ratios were estimated. Table 2 shows the probability for each component in the different ND samples. The major component for ND-pris, ND-500, and ND-550 was sp3 bonding, while those for ND-800 and ND-600 were sp2 bonding and C–O groups, respectively. As mentioned above, the annealing process introduced graphite, which was then removed during oxidation. Oxygen-containing groups were simultaneously introduced, and the graphite-removal/oxygen-introduction efficiency appeared to be temperature dependent.
| Component | sp2 | sp3 | CO |
|---|---|---|---|
| ND-pris | 0.33 | 0.34 | 0.33 |
| ND-800 | 0.42 | 0.31 | 0.27 |
| ND-500 | 0.27 | 0.39 | 0.34 |
| ND-550 | 0.29 | 0.41 | 0.29 |
| ND-600 | 0.22 | 0.38 | 0.40 |
The ratios of the sp3 to sp2 carbons in the different ND samples estimated from their Raman and XPS spectra were then compared. Because Raman spectroscopy provides information about the carbon bonding state, the ratios of the Raman signal intensities for the sp3 and strain-induced bands divided by that of the sp2 band were calculated for quantitative comparison of the carbon bonding states in the different samples. Values of 4.1, 1.4, 3.1, 3.8, and 9.5 were obtained for ND-pris, ND-800, ND-500, ND-550, and ND-600, respectively. A plot of the ratios of the sp3 to sp2 bonded carbons in the ND samples estimated from Raman and XPS data is shown in Fig. S4.† In both cases, the ratio decreased following annealing and increased as the oxidation temperature increased. The differences in the XPS and Raman plots can be attributed to the differences in the observation depths of these analytical techniques.
![[double bond, length as m-dash]](https://www.rsc.org/images/entities/char_e001.gif) O peak at 1750–1778 cm−1; C
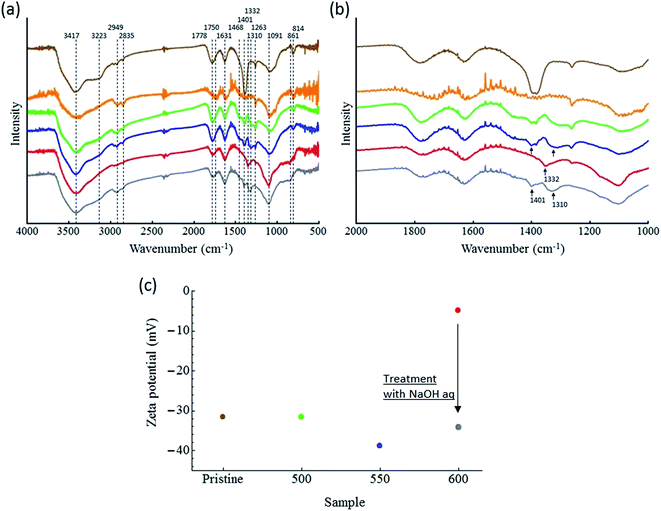
O peak at 1750–1778 cm−1; C![[double bond, length as m-dash]](https://www.rsc.org/images/entities/char_e001.gif) C and/or adsorbed waters peak at 1631 cm−1; COO− peak at 1401–1468 cm−1; C–O peak at 1263–1310 cm−1; C–O–C stretching peak at 1091 cm−1; and C–H bending peak at 814–861 cm−1 are observed in the samples.21,22 Interestingly, significant differences in the FTIR spectra of ND-500 and ND-550 were not observed, while notable changes were seen in the spectrum of ND-600. Fig. 6b shows the spectra in the range 1000–2000 cm−1. The relative intensity of the C–O at 1310 cm−1 and COO− at 1401 cm−1 are diminished, while C–O at 1332 cm−1 are emerged. We assumed that these spectral changes are attributed to the changes of the oxygen containing groups, possibly due to the conversion from carboxyl groups to a different species such as carboxylic anhydrides. To confirm this, ND-600 was then treated with an aqueous NaOH solution in order to facilitate the hydration of the surface anhydride groups and thus the formation of free COOH groups. Gray spectrum in Fig. 6a and b show the NaOH treated ND-600. It is observed that the disappeared peaks at 1310 and 1401 cm−1 are regenerated, and the emerged peaks at 1332 cm−1 disappeared. This data supported the conclusion that the surface COOH groups were dehydrated in the ND-600. To gain further evidence for this dehydration, the zeta potentials of the ND samples were also determined.
C and/or adsorbed waters peak at 1631 cm−1; COO− peak at 1401–1468 cm−1; C–O peak at 1263–1310 cm−1; C–O–C stretching peak at 1091 cm−1; and C–H bending peak at 814–861 cm−1 are observed in the samples.21,22 Interestingly, significant differences in the FTIR spectra of ND-500 and ND-550 were not observed, while notable changes were seen in the spectrum of ND-600. Fig. 6b shows the spectra in the range 1000–2000 cm−1. The relative intensity of the C–O at 1310 cm−1 and COO− at 1401 cm−1 are diminished, while C–O at 1332 cm−1 are emerged. We assumed that these spectral changes are attributed to the changes of the oxygen containing groups, possibly due to the conversion from carboxyl groups to a different species such as carboxylic anhydrides. To confirm this, ND-600 was then treated with an aqueous NaOH solution in order to facilitate the hydration of the surface anhydride groups and thus the formation of free COOH groups. Gray spectrum in Fig. 6a and b show the NaOH treated ND-600. It is observed that the disappeared peaks at 1310 and 1401 cm−1 are regenerated, and the emerged peaks at 1332 cm−1 disappeared. This data supported the conclusion that the surface COOH groups were dehydrated in the ND-600. To gain further evidence for this dehydration, the zeta potentials of the ND samples were also determined.
Fig. 6c shows plots of the zeta potentials for the samples. Note that it was not possible to disperse ND-800 in water, and thus no data was obtained for this sample (Fig. S5†). The zeta potentials were determined to be −31.5, −31.5, −38.8, and −4.9 mV for ND-pris, ND-500, ND-550, and ND-600, respectively. The negative charges are attributed to the presence of COOH groups on the surfaces of the NDs. The very small zeta potential value for ND-600 indicated that dehydration of the COOH groups occurred, leading to the formation of carboxylic anhydrides. After this treatment, the zeta potential was found to be −34.2 mV (gray point in Fig. 6c). This result indicated the regeneration of COOH groups. Based on these results, it was concluded that excess oxidation led to size reduction accompanied by the introduction of carboxylic anhydride groups on the surfaces of the NDs, which in turn had a lower zeta potential. We further acquired deconvoluted high-resolution O1s XPS spectra of the ND samples, and the results are given in Fig. S6 and Table S2.† The data support the results of IR and zeta potential.
Thus, the overall changes in the physical/chemical states of NDs due to annealing and oxidation have been revealed, and a schematic illustration of the results is presented in Fig. 7.
2.2 Particle properties
Fig. 9a shows the fluorescence spectra of the bulk samples. The data for ND-pris is not shown because this sample was not subjected to annealing, and thus no NVCs were introduced into the NDs. ND-800 exhibited a very weak fluorescence intensity, possibly due to absorption of the fluorescence from the NVCs by the surface graphite. The other samples exhibited similar fluorescence spectra, with ZPLs for NV0 and NV− at 575 and 637 nm, respectively. The ODMR spectra of ND-800, ND-500, ND-550, and ND-600 are shown in Fig. 9b. Each sample clearly exhibited MW-dependent reduction of the fluorescence intensity at 2870 MHz. Notably, in the spectrum of ND-800, the signal was weaker and broader than that in the spectrum of ND-500, which was likely caused by the graphite. The strongest ODMR signal of 4.7% was observed for ND-500. The ODMR signal then deceased for ND-550 and ND-600 to 3.6% and 2.4%, respectively. This decrease in the intensity is assumed to derive from the decrease in the total number of NVCs (both NV0 and NV−) contained in the NDs due to their reduction in size. However, it must be considered that the ODMR signal is determined as shown in eqn (1):
| IODMR = (IOFF − ION)/IOFF, | (1) |
 | (2) |
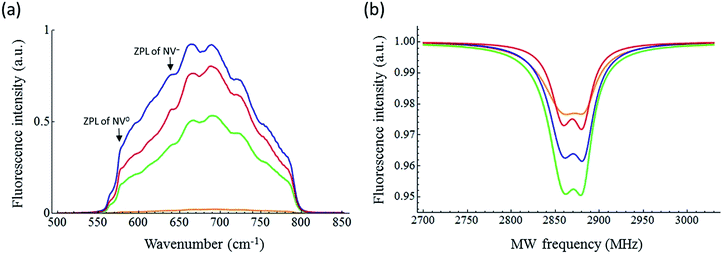 | ||
| Fig. 9 (a) Fluorescence and (b) ODMR spectra of ND-800 (orange), ND-500 (green), ND-550 (blue), and ND-600 (red). | ||
| Parameter | Intensity (%) | HWHM (MHz) | E-value (MHz) |
|---|---|---|---|
| ND-800 | 2.3 | 16.8 | 13.0 |
| ND-500 | 4.7 | 13.7 | 11.5 |
| ND-550 | 3.6 | 14.5 | 12.3 |
| ND-600 | 2.4 | 12.9 | 11.6 |
3. Conclusions
Changes in the physical/chemical states of NDs due to annealing and oxidation have been quantitatively analyzed, and several key points have been elucidated.(1) Weight loss in the NDs occurred via several processes.
(2) A surface graphite introduced during annealing was oxidized in air at temperatures above 500 °C.
(3) Distortion of the crystal during oxidation at 525–550 °C was accompanied by particle shrinkage.
(4) The sp3/sp2 ratio increased with increasing temperature, and COOH groups introduced at lower oxidation temperature were dehydrated at higher oxidation temperatures, resulting in NDs with low zeta potentials.
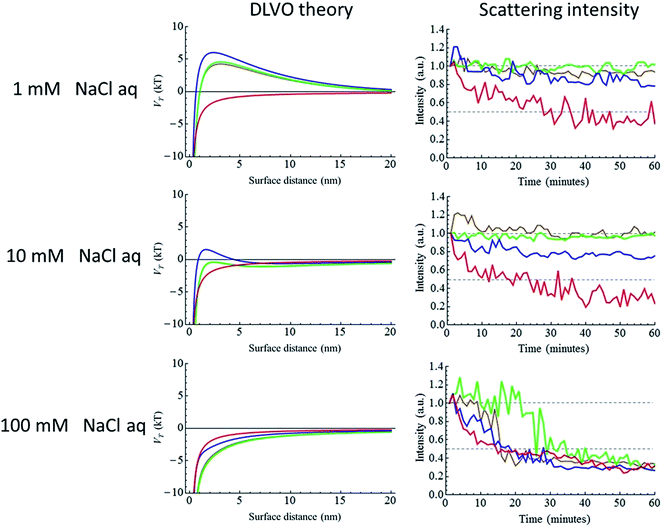
In addition to these results, it was found that the dispersibility, fluorescence, and ODMR properties of the NDs are related to their physical/chemical properties. Notably, there is a strong relationship between the dispersibility of NDs and their physical/chemical states, and the dispersibility can be estimated in advance using DLVO theory. In addition, it was determined that the ODMR signal intensity for NDs may be influenced by its sp2 ratio and particle size; the ODMR signal decreased with decreasing particle size, but crystal distortion around NV− was not observed, indicating that an NVC existing at the surface was converted from NV− to NV0. Furthermore, the optimal oxidation conditions for a discrete maximum ODMR intensity were determined. These experimental results suggest that it should be possible to control the physical/chemical states and properties of NDs through adjustment of the annealing and oxidation processes, and will thus open avenues for facilitating their bio-application.
4. Experimental
NDs (MD50) synthesized by a static high-pressure high-temperature (HPHT) method were purchased from Tomei Diamond Co. Ltd., and used in this study. Ion irradiation, which is the common method for creating additional vacancies in NDs,27 was not applied to the materials. TEM images were obtained using a Hitachi H-7650. Raman spectra were obtained using a Horiba XploRa in the range from 1200 to 1650 cm−1 in order to evaluate the distribution of the diamond sp3 band (1332 cm−1), the strain-induced band (1450 cm−1), and the graphite sp2 band (1550 cm−1). A 488 nm excitation laser was used. X-ray diffraction patterns were recorded using a power X-ray diffractometer (MultiFlex DR, Rigaku, Tokyo Japan) with a CuKα source (X-ray wavelength 0.15405 nm) and an acceleration voltage and anode current of 30 kV and 30 mA, respectively. XPS spectra were recorded using an ULVAC PHI 5500MT system. Samples mounted on indium foil were analyzed using MgKα radiation (15 kV, 400 W) in a vacuum chamber (<1 × 10⁻⁸ Torr). Precise measurement and characterization of the energies of the C1s and O1s peaks were achieved by referencing them to the 3d peak of Ag at 374 eV. FTIR spectra were obtained on a JASCO FT/IR-4200 using standard KBr-pellets with a resolution of 2 cm−1. The zeta potentials of the samples in neutral water were measured using a Malvern Zeta sizer Nano instrument. The concentration of each ND sample was 1 mg ml−1 in a salt-containing aqueous solution, and the samples were sonicated for 5 minutes prior to measurement. Time-dependent changes in the dynamic light scattering intensities of the samples (1 mg ml−1 in Milli-Q water) were determined using a Wyatt DynaPro NanoStar. Fluorescence and optically detected magnetic resonance spectra were recorded using a home-built microscope established by Igarashi et al.32 The field of view was illuminated using a 532 nm Nd:YAG laser at 7 mW, and fluorescence images (40 μm × 40 μm) were obtained using an electron multiplying charge-coupled device (EMCCD) camera, while fluorescence spectra were recorded using a Hamamatsu photonics PMA-12. The emitted light was collected using an oil immersion 100× objective lens (numerical aperture = 1.49) and passed through a dichroic mirror centered at 575 nm and a long (short)-wave pass filter longer than 590 nm (shorter than 842 nm) to detect the intrinsic signal. The microscope was equipped with a computer-controlled moving stage.Treatment of ND-600 in an NaOH aqueous solution was performed using the following procedure. NaOH (0.1 M) was added to the NDs and the suspension was stirred for two hours at 90 °C. After washing three times with Milli-Q water, the NDs were stirred in 0.1 M HCl for two hours at 90 °C. The NDs were then centrifuged and washed three times with Milli-Q water.
Acknowledgements
The authors thank Prof. Tsunehiro Tanaka, Graduate School of Engineering, Kyoto University, for help with the XRD and XPS analyses; Mr Yuta Kumiya, Graduate School of Engineering, Kyoto University, for help with the fluorescence measurements; and Mr Erik Walinda, Graduate School of Engineering, Kyoto University, for his scientific discussions. This research was supported by the World Premier International Research Center World Researchers (NEXT Program). Initiative (WPI), Ministry of Education, Culture, Sports, Science and Technology (MEXT) Japan, the Japan Science and Technology Agency under the Core Research for Evolutional Science (CREST), and the Japan Society for the Promotion of Science under the Funding Program for Next-Generation.Notes and references
- I. Aharonovich, A. Greentree and S. Prawer, Nat. Photonics, 2011, 5, 397–405 CrossRef CAS.
- S.-J. Yu, M.-W. Kang, H.-C. Chang, K.-M. Chen and Y.-C. Yu, J. Am. Chem. Soc., 2005, 127, 17604–17605 CrossRef CAS PubMed.
- G. Liaugaudas, G. Davies, K. Suhling, R. U. A. Khan and D. J. F. Evans, J. Phys.: Condens. Matter, 2012, 24, 435503 CrossRef CAS PubMed.
- F. Jelezko and J. Wrachtrup, Phys. Status Solidi, 2006, 203, 3207–3225 CrossRef CAS.
- A. Krueger and D. Lang, Adv. Funct. Mater., 2012, 22, 890–906 CrossRef CAS.
- A. M. Schrand, H. Huang, C. Carlson, J. J. Schlager, E. Omacr Sawa, S. M. Hussain and L. Dai, J. Phys. Chem. B, 2007, 111, 2–7 CrossRef CAS PubMed.
- Y. Y. Hui, C.-L. Cheng and H.-C. Chang, J. Phys. D: Appl. Phys., 2010, 43, 374021 CrossRef.
- J. M. Say, C. Vreden, D. J. Reilly, L. J. Brown, J. R. Rabeau and N. J. C. King, Biophys. Rev., 2011, 3, 171–184 CrossRef CAS.
- H. Bernien, B. Hensen, W. Pfaff, G. Koolstra, M. S. Blok, L. Robledo, T. H. Taminiau, M. Markham, D. J. Twitchen, L. Childress and R. Hanson, Nature, 2013, 497, 86–90 CrossRef CAS PubMed.
- T. Staudacher, F. Shi, S. Pezzagna, J. Meijer, J. Du, C. A. Meriles, F. Reinhard and J. Wrachtrup, Science, 2013, 339, 561–563 CrossRef CAS PubMed.
- M. Geiselmann, M. L. Juan, J. Renger, J. M. Say, L. J. Brown, F. J. G. de Abajo, F. Koppens and R. Quidant, Nat. Nanotechnol., 2013, 8, 175–179 CrossRef CAS PubMed.
- Y. Y. Hui and H.-C. Chang, J. Chin. Chem. Soc., 2014, 61, 67–76 CrossRef CAS.
- R. Schirhagl, K. Chang, M. Loretz and C. L. Degen, Annu. Rev. Phys. Chem., 2014, 65, 83–105 CrossRef CAS PubMed.
- X. Song, G. Wang, X. Liu, F. Feng and J. Wang, Appl. Phys. Lett., 2013, 102, 133109 CrossRef PubMed.
- A. Schrand, S. a. C. Hens and O. Shenderova, Crit. Rev. Solid State Mater. Sci., 2009, 34, 18–74 CrossRef CAS.
- J. Tisler, G. Balasubramanian, B. Naydenov, R. Kolesov, B. Grotz, R. Reuter, J.-P. Boudou, P. a. Curmi, M. Sennour, A. Thorel, M. Börsch, K. Aulenbacher, R. Erdmann, P. R. Hemmer, F. Jelezko and J. Wrachtrup, ACS Nano, 2009, 3, 1959–1965 CrossRef CAS PubMed.
- T. Gaebel, C. Bradac, J. Chen, J. M. Say, L. Brown, P. Hemmer and J. R. Rabeau, Diamond Relat. Mater., 2012, 21, 28–32 CrossRef CAS PubMed.
- J. Havlik, V. Petrakova, I. Rehor, V. Petrak, M. Gulka, J. Stursa, J. Kucka, J. Ralis, T. Rendler, S.-Y. Lee, R. Reuter, J. Wrachtrup, M. Ledvina, M. Nesladek and P. Cigler, Nanoscale, 2013, 5, 3208–3211 RSC.
- J. Cebik, J. K. McDonough, F. Peerally, R. Medrano, I. Neitzel, Y. Gogotsi and S. Osswald, Nanotechnology, 2013, 24, 205703 CrossRef PubMed.
- S. Osswald, G. Yushin, V. Mochalin, S. O. Kucheyev and Y. Gogotsi, J. Am. Chem. Soc., 2006, 128, 11635–11642 CrossRef CAS PubMed.
- O. Shenderova, M. Panich, S. Moseenkov, S. C. Hens, V. Kuznetsov and H.-M. Vieth, J. Phys. Chem. C, 2011, 115, 19005–19011 CAS.
- V. Y. Osipov, E. Aleksenskiy, I. Shames, M. Panich, M. S. Shestakov and A. Y. Vul, Diamond Relat. Mater., 2011, 20, 1234–1238 CrossRef CAS PubMed.
- E. Verwey and J. Overbeek, Theory of the Stability of Lyophobic Colloids, Elsevier, 1948 Search PubMed.
- B. V. Deryagyin and L. Landau, Acta Phys. Chem., 1941, 15, 633 Search PubMed.
- Y. Hui, B. Zhang and Y. Chang, Opt. Express, 2010, 18, 2135–2143 CrossRef PubMed.
- L. Zhao, T. Takimoto, M. Ito, N. Kitagawa, T. Kimura and N. Komatsu, Angew. Chem., Int. Ed., 2011, 50, 1388–1392 CrossRef CAS PubMed.
- Y.-R. Chang, H.-Y. Lee, K. Chen, C.-C. Chang, D.-S. Tsai, C.-C. Fu, T.-S. Lim, Y.-K. Tzeng, C.-Y. Fang, C.-C. Han, H.-C. Chang and W. Fann, Nat. Nanotechnol., 2008, 3, 284–288 CrossRef CAS PubMed.
- P. Maletinsky, S. Hong, M. S. Grinolds, B. Hausmann, M. D. Lukin, R. L. Walsworth, M. Loncar and A. Yacoby, Nat. Nanotechnol., 2012, 7, 320–324 CrossRef CAS PubMed.
- V. R. Horowitz, B. J. Alemán, D. J. Christle, A. N. Cleland and D. D. Awschalom, Proc. Natl. Acad. Sci. U. S. A., 2012, 109, 13493–13497 CrossRef CAS PubMed.
- K. Fu, C. Santori, P. E. Barclay and R. G. Beausoleil, Appl. Phys. Lett., 2010, 96, 121907 CrossRef PubMed.
- S. Cui and E. L. Hu, Appl. Phys. Lett., 2013, 103, 051603 CrossRef PubMed.
- R. Igarashi, Y. Yoshinari, H. Yokota, T. Sugi, F. Sugihara, K. Ikeda, H. Sumiya, S. Tsuji, I. Mori, H. Tochio, Y. Harada and M. Shirakawa, Nano Lett., 2012, 12, 5726–5732 CrossRef CAS PubMed.
Footnote |
| † Electronic supplementary information (ESI) available. See DOI: 10.1039/c4ra16482b |
| This journal is © The Royal Society of Chemistry 2015 |

