Transition metal induced switch of fluorescence and absorption response of a Zn(II)porphyrin–DNA conjugate to cysteine derivatives

Jung Kyu Choi, Gevorg Sargsyan, Breiana D. Johnson and Milan Balaz*
Department of Chemistry, University of Wyoming, 1000 E. University Avenue, Laramie, WY 82071, USA. E-mail: mbalaz@uwyo.edu

Received 16th December 2014 , Accepted 28th January 2015

First published on 28th January 2015


Abstract

We report a supramolecular zinc(II)tetraarylporphyrin–oligothymidine/metal ion system (ZnPorT8/M2+) for dual optical sensing of cysteine (Cys) and glutathione (GSH) with a tunable spectroscopic outcome. Transition metal ions (M2+ = Hg2+ or Cu2+) allow the switching of the emission and absorption response of the ZnPorT8/M2+ complex. The ZnPorT8/Hg2+ complex exhibits turn-on fluorescence sensing (fluorescence enhancement), whilst the ZnPorT8/Cu2+ system exhibits turn-off sensing (emission quenching) of Cys and GSH. The ZnPorT8/Hg2+ and ZnPorT8/Cu2+ complexes have an excellent limit of detection (LOD(em)) for Cys (5.95 nM and 11.99 nM, respectively) and GSH (3.34 nM and 13.50 nM, respectively).

Introduction

Porphyrins and metalloporphyrins have found widespread use as recognition and/or reporting components in many diverse sensing systems due to their modular electronic and structural properties.1–6 They have been successfully used for fluorescence mapping of viscosity,7,8 electrochemical detection of explosives,9 chiroptical sensing of left-handed Z-DNA,10–13 phosphorescent oxygen sensing,14 emission detection of Cu(II),15 amperometric sensing of organophosphate pesticides,16 or optical determination of bacterial exosporium sugars.17 We have recently reported highly sensitive optical detection of Hg2+ by the zinc(II)porphyrin–oligothymidine bioconjugate ZnPorT8 (Fig. 1).18 The addition of Hg(II) and Cu(II) lead to complete and partial emission quenching, respectively. The quenching was very likely caused by photoinduced electron transfer upon binding of mercury(II) to trispyridylphenyl-porphyrin. Mercury and copper ions exhibit a very high affinity for the thiol group and form stable complexes with cysteine.19,20 Interaction between Cys and Hg(II) has been utilized for turn-on21–28 or turn-off29,30 emission sensing of Cys by multicomponent supramolecular systems with excellent detection limits ranging from 2.0 to 600 nM. Similarly, Cu-complexes have been explored for spectrophotometric Cys detection.31–34 Detection of Cys and its derivative glutathione (GSH) is of high importance for diagnosing biothiol related health problems,35–39 since Cys and GSH are crucial in maintaining the physiological redox homeostasis in biological systems.40–44 Optical sensing (e.g. fluorescence and absorption) is especially attractive since it is non-destructive, inexpensive, and allows high throughput real time detection without the need for derivatization.45–47 Herein we report a supramolecular system assembled of ZnPorT8 and a transition metal ion (either Hg(II) or Cu(II)) for highly sensitive and selective optical sensing of Cys and GSH in water. Importantly, transition metal ions allow switching the emission and absorption recognition response of the ZnPorT8/metal complex. The ZnPorT8/Hg2+ complex offers a turn-on fluorescence sensing (fluorescence enhancement), while the ZnPorT8/Cu2+ system gives reversed turn-off sensing (emission quenching) of biothiols.
image file: c4ra16453a-f1.tif
Fig. 1 Structure of Zn(II)tetraarylporphyrin–octathymine conjugate ZnPorT8.

Results and discussion

ZnPorT8/Hg2+ system: Cys and GSH optical sensing

We have shown that the fluorescence of ZnPorT8 could be significantly decreased (up to 94.2% signal reduction) by Hg2+ ions upon their binding to trispyridylphenyl-porphyrin. Since Hg2+ ion also forms highly stable complexes with cysteine,48 we have decided to explore biothiols optical recognition with supramolecular ZnPorT8/Hg2+ complex. The UV-vis absorption spectrum of a mixture of ZnPorT8 (2 μM) and Hg2+ (5.0 μM) in sodium cacodylate buffer (1.0 mM, pH 7.0) showed absorption bands at 428.6 nm (Soret band) and 558.8 nm (Q-band). The fluorescence spectrum of the ZnPorT8/Hg2+ system displayed two maxima at 604.0 nm and 654.0 nm when excited at 425.0 nm.18 Addition of L-Cys (5.0 μM) to the solution of ZnPorT8/Hg2+ complex ([ZnPorT8] = 2.0 μM, [Hg2+] = 5.0 μM) caused a blue shift of the Soret band from 428.6 nm to 425.0 nm together with small hyperchromicity (Fig. 2a, red curve). The fluorescence intensity of the ZnPorT8/Hg2+ complex at 654 nm (λexc = 425.0 nm) increased 6.21-fold from 130 a.u. to 810 a.u. upon the addition of L-Cys (5.0 μM; Fig. 2b, red curve). No cysteine induced shift of the emission maximum of ZnPorT8/Hg2+ complex was detected. Addition of L-Cys caused the release of the Hg2+ from its complex with ZnPorT8 and formation of a 1[thin space (1/6-em)]:[thin space (1/6-em)]1 L-Cys:Hg2+ complex.48,49 Addition of D-Cys to ZnPorT8/Hg2+ system caused virtually identical spectroscopic changes as L-Cys and no chiral discrimination by ZnPorT8/Hg2+ system was observed (Fig. S6). Interaction of GSH with ZnPorT8/Hg2+ complex promoted very similar spectroscopic changes as did Cys. Addition of GSH (5.0 μM) to the ZnPorT8/Hg2+ complex ([ZnPorT8] = 2.0 μM, [Hg2+] = 5.0 μM) caused a blue shift of the Soret band maximum from 428.6 nm to 424.8 nm accompanied by weak hyperchromicity in the UV-vis absorption spectrum (Fig. 2a, blue curve). The emission signal at 654 nm (λexc = 425.0 nm) increased without any observable λem shift 6.35-fold from 130 a.u. to 829 a.u. upon addition of GSH (5.0 μM; Fig. 2b, blue curve). Addition of GSH caused the dissociation of the ZnPorT8/Hg2+ and formation of a GSH:Hg2+ complex with 3[thin space (1/6-em)]:[thin space (1/6-em)]2 stoichiometry.48 Addition of L-Cys (5.0 μM) or GSH (5.0 μM) to the solution of ZnPorT8 (2.0 μM) in the absence of Hg2+ did not cause detectable changes in the UV-vis absorption nor fluorescence spectra of the ZnPorT8 conjugate (Fig. S1 and S2).
image file: c4ra16453a-f2.tif
Fig. 2 (a) UV-vis absorption and (b) fluorescence spectra of the ZnPorT8 (2 μM, black dashed lines), ZnPorT8/Hg2+ complex ([ZnPorT8] = 2.0 μM, [Hg2+] = 5.0 μM, black solid lines), ZnPorT8/Hg2+ in the presence of L-Cys (5.0 μM, red solid lines), and ZnPorT8/Hg2+ in the presence of GSH (5.0 μM, blue solid lines). Conditions: Na-cacodylate buffer (1.0 mM, pH = 7.0), λexc = 425 nm. Arrows depict the biothiol induced changes of the ZnPorT8/Hg2+ spectroscopic signal.

Absorption and emission spectral changes observed upon the addition of Cys or GSH to the ZnPorT8/Hg2+ complex are strong evidence of binding of biothiols to the Hg2+ ions of the ZnPorT8/Hg2+ complex via the thiol functional group.48 Higher affinity of cysteine for Hg(II) than ZnPorT8 for Hg(II) caused the ZnPorT8/Hg2+ complex to fall apart thus releasing the strongly fluorescent ZnPorT8 conjugate. The comparison of spectroscopic characteristics of ZnPorT8/Hg2+ complex treated with biothiols (Fig. 2, red and blue curves) and ZnPorT8 conjugate (Fig. 2, black dashed lines) has provided final proof that additions of Cys and GSH released ZnPorT8 from its ZnPorT8/Hg2+ complex.

ZnPorT8/Cu2+ system: Cys and GSH optical sensing

The fluorescence of ZnPorT8 can also be quenched by Cu2+ ions, though less efficiently than with Hg2+. We have therefore explored the biomolecular detection of L-Cys and GSH by the ZnPorT8/Cu2+ supramolecular system. Fig. 3 shows the L-Cys-induced changes in absorption and fluorescence spectra of the ZnPorT8/Cu2+ system ([ZnPorT8] = 2.0 μM, [Cu2+] = 20.0 μM). Addition of L-Cys (6.0 μM) to the solution of ZnPorT8/Cu2+ complex ([ZnPorT8] = 2.0 μM, [Cu2+] = 20.0 μM) caused intense hypochromicity of the Soret band (65%), a red shift of the Soret band maximum from 425.8 nm to 428.6 nm (+2.8 nm; Fig. 3a, red curve) and appearance of a shoulder. Addition of Cys (6.0 μM; Fig. 3b, red curve) to ZnPorT8/Cu2+ complex induced fluorescence quenching as evidenced by the decrease of the emission intensity of the ZnPorT8/Cu2+ complex at 653 nm (λexc = 426.0 nm) by 87.7% from 653 a.u. to 80 a.u.
image file: c4ra16453a-f3.tif
Fig. 3 (a) UV-vis absorption and (b) fluorescence spectra of the ZnPorT8/Cu2+ complex ([ZnPorT8] = 2.0 μM, [Cu2+] = 20.0 μM) in the absence of L-Cys (green curves) and in the presence of L-Cys ([L-Cys] = 6.0 μM; red curves). Conditions: Na-cacodylate buffer (1.0 mM, pH = 7.0), λexc = 426 nm. Arrows depict the biothiol induced changes of the ZnPorT8/Cu2+ spectroscopic signal.

Similar absorption and emission spectroscopic responses were observed upon addition of GSH (6 μM) to ZnPorT8/Cu2+ system (Fig. 3, blue dashed curves). Changes in absorption and emission spectra observed upon addition of Cys or GSH to the ZnPorT8/Cu2+ complex confirmed Cys and GSH interactions with Cu2+ in ZnPorT8/Cu2+ complex. Based on literature precedence,19,50–52 we hypothesize that Cys and GSH partially reduced Cu(II) to Cu(I) with Cu(I) complex being a better quencher of ZnPorT8 emission than Cu(II).

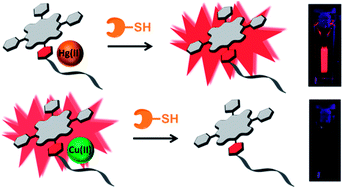
It is important to emphasize that while the addition of L-Cys and GSH caused an enhancement of emission signal of the ZnPorT8/Hg2+ system, their addition to ZnPorT8/Cu2+ decreased the emission signal. The emission output (emission recovery or emission quenching) of the ZnPorT8/M2+ system could thus be easily reversed by complexed transition metal (mercury(II) vs. copper(II)) yielding tunable optical probe with excellent selectivity and sensitivity for Cys and GSH (Fig. 4). Importantly, absorption signal of the ZnPorT8/M2+ supramolecular system is also sensitive to the addition of biothiols. Addition of L-Cys and GSH to the ZnPorT8/Hg2+ system caused a hyperchromicity and a blue shift of the Soret band, their addition to ZnPorT8/Cu2+ gave rise to hypochromicity and a red shift. Both emission and absorption signals can thus be used for sensing of Cys and GSH resulting in a dual optical probe with switchable spectroscopic outcome.


image file: c4ra16453a-f4.tif
Fig. 4 Schematic representation of transition metal induced switch of fluorescence response of ZnPorT8/Hg(II) and ZnPorT8/Cu(II) supramolecular systems to Cys and GSH.

ZnPorT8/Hg2+ and ZnPorT8/Cu2+: sensitivity of L-Cys and GSH detection using emission signals

To evaluate the sensitivity of the ZnPorT8/Hg2+ probe, we performed UV-vis absorption and fluorescence titration by adding L-Cys or GSH (1.0 μM to 10.0 μM) to the ZnPorT8/Hg2+ solution ([ZnPorT8] = 2.0 μM, [Hg2+] = 5.0 μM). Fig. 5 shows the fluorescence titration of the L-Cys to ZnPorT8/Hg2+. The fluorescence intensity gradually increased with increasing concentration of the L-Cys and reached a plateau at [L-Cys] = 5.0 μM. We observed a linear correlation of fluorescence intensity at 654 nm as a function of the L-Cys concentration in the range between [L-Cys] = 0 and 5.0 μM with a slope of 136.79 (Fig. 5b). The emission limit of detection (LOD(em)) was determined to be [Cys] = 5.95 nM (3σ/slope, σ = 0.27). All detection limits are summarized in Table 1. Similarly to the L-Cys, fluorescence intensity of the ZnPorT8/Hg2+ system increased with the increasing concentration of the GSH with a plateau at [GSH] ≥ 3.0 μM (Fig. 5c). A linear correlation of 654 nm fluorescence signal as a function of the GSH concentration was observed between [GSH] = 0 and 3.0 μM (Fig. 5d). The LOD(em) for GSH was determined to be 3.34 nM (3σ/slope, σ = 0.27) with a slope of 243.47 (Fig. 5d).
image file: c4ra16453a-f5.tif
Fig. 5 Fluorescence spectra (λexc = 425 nm) of the (ZnPorT8/Hg2+ complex ([ZnPorT8] = 2.0 μM, [Hg2+] = 5.0 μM) titrated with (a) L-Cys [L-Cys] = 1.0 μM to 10.0 μM in 1.0 μM addition steps) or (c) with GSH ([GSH] = 1.0 μM to 10.0 μM in 1.0 μM addition step). FF0 fluorescence intensity changes of the ZnPorT8/Hg2+ systems as a function of the (b) L-Cys or (d) GSH concentration (0 to 5.0 μM, black squares) detected at 654.0 nm and their linear fits (FF0, F0: fluorescence intensity of ZnPorT8/Hg2+, F: fluorescence intensity ZnPorT8/Hg2+ after addition of biothiols). Arrows depict the biothiol induced changes of the ZnPorT8/Cu2+ spectroscopic signal.
Table 1 Emission and absorption detection limits of L-Cys and GSH
Amino acida LOD ZnPorT8/Hg2+a ZnPorT8/Cu2+b
a [ZnPorT8] = 2.0 μM, [Hg2+] = 5.0 μM; sodium cacodylate buffer (1 mM, pH 7.0).b [ZnPorT8] = 2.0 μM, [Cu2+] = 20.0 μM; sodium cacodylate buffer (1 mM, pH 7.0).
L-Cys LOD(em) 5.95 nM (enhancement) 11.99 nM (quenching)
LOD(abs) 531 nM 263 nM
GSH LOD(em) 3.34 nM (enhancement) 13.50 nM (quenching)
LOD(abs) 511 nM 256 nM


Stepwise addition of L-Cys (from 1.0 to 6.0 μM in 1.0 μM increments) to the ZnPorT8/Cu2+ system ([ZnPorT8] = 2.0 μM, [Cu2+] = 20.0 μM) caused a decrease of the fluorescence intensity at 654.0 nm by 79.9% (from 401 a.u. to 80 a.u.; Fig. 6a). A linear correlation of the 654.0 nm fluorescence signal as a function of concentration yielded LOD(em) for L-Cys of 11.99 nM (3σ/slope, σ = 0.3823, slope = 95.65, Fig. 6b). All detection limits are summarized in Table 1. Similarly, incremental addition of GSH (from 1.0 to 6.0 μM in 1.0 μM steps) induced quenching of fluorescence of ZnPorT8/Cu2+. The emission signal at 654 nm dropped by 80.3% (from 400 a.u. to 79 a.u.; Fig. 6c) yielding excellent sensitivity for the detection of GSH with LOD(em)GSH = 13.50 nM (3σ/slope, σ = 0.3823, slope = 84.93, Fig. 6d).


image file: c4ra16453a-f6.tif
Fig. 6 Fluorescence spectra (λexc = 425 nm) of the (ZnPorT8/Hg2+ complex ([ZnPorT8] = 2.0 μM, [Cu2+] = 20.0 μM) titrated with (a) L-Cys [L-Cys] = 1.0 μM to 6.0 μM in 1.0 μM addition steps) or (c) with GSH ([GSH] = 1.0 μM to 6.0 μM in 1.0 μM addition step). FF0 fluorescence intensity changes of the ZnPorT8/Cu2+ systems as a function of the (b) L-Cys or (d) GSH concentrations (0 to 3.0 μM, black squares) detected at 654.0 nm and their linear fits (F0F, F0: fluorescence intensity of ZnPorT8/Cu2+, F: fluorescence intensity ZnPorT8/Cu2+ after addition of biothiols). Arrows depict the biothiol induced changes of the ZnPorT8/Cu2+ spectroscopic signal.

ZnPorT8/Hg2+ and ZnPorT8/Cu2+: sensitivity of L-Cys and GSH detection using VIS absorption signals

Since the addition of Cys or GSH also caused significant changes in the UV-vis absorption spectra of ZnPorT8/Hg2+ and ZnPorT8/Cu2+ systems, we have explored the possibility to sense biological thiols by VIS absorption spectroscopy.

ZnPorT8/Hg2+ complex showed a blue shift of the Soret band from 428.6 nm to 425.0 nm with an isosbestic point at 427.0 nm upon stepwise addition of Cys (Fig. 7). A linear response of the absorption intensity at 425.0 nm as a function of the L-Cys ([L-Cys] = 0 and 5.0 μM) concentration was observed. The LOD(abs)Cys was calculated to be 531 nM (3σ/slope, σ = 0.005, slope = 0.028, Fig. 7b). On the other hand, stepwise addition of Cys to ZnPorT8/Cu2+ system caused a red shift of the Soret band accompanied by hypochromicity (Fig. 7c). A linear response of the absorption intensity at 425.0 nm as a function of the L-Cys ([L-Cys] = 0 and 3.0 μM) yielded LOD(abs)Cys of 531 nM (3σ/slope, σ = 0.005, slope = 0.028, Fig. 7d). The GSH LOD(abs) are summarized in Table 1. The absorption data confirmed that ZnPorT8/M2+ systems (M2+ = Hg2+ or Cu2+) can be used as dual optical probes for emission as well as absorption biomolecular recognition of biothiols. Lower emission LOD(em) in comparison to absorption LOD(abs) of ZnPorT8/M2+ systems originated from a larger change of emission signal that positively benefited from Cys- and GSH-induced change of absorbance signal at excitation wavelength (425.0 nm). All LODs are summarized in Table 1.


image file: c4ra16453a-f7.tif
Fig. 7 UV-vis absorption spectra (Soret band) of the (a) ZnPorT8/Hg2+ complex ([ZnPorT8] = 2.0 μM, [Hg2+] = 5.0 μM) and (c) ZnPorT8/Cu2+ complex ([ZnPorT8] = 2.0 μM, [Cu2+] = 20.0 μM) titrated with L-Cys [L-Cys] = 1.0 μM to 10.0 μM in 1.0 μM addition steps. AA0 absorbance intensity changes of the (b) ZnPorT8/Hg2+ and (d) ZnPorT8/Cu2+ systems as a function of the L-Cys concentration (0 to 5.0 μM and 0 to 3.0 μM; black squares) detected at 425.0 nm and their linear fit (AA0, A0: absorbance of ZnPorT8/Hg2+ or ZnPorT8/Cu2+, A: absorbance ZnPorT8/Hg2+ or ZnPorT8/Cu2+ after addition of L-Cys). Arrows depict the biothiol induced changes of the ZnPorT8/Cu2+ spectroscopic signal.

We have also examined the effect of concentration of Hg2+ in ZnPorT8/Hg2+ system on fluorescence cysteine detection limits (LOD(em)Cys). Fig. S30 shows the fluorescence intensity changes detected at 654.0 nm of ZnPorT8/Hg2+ system ([ZnPorT8] = 2.0 μM) with five different concentrations of the Hg2+ ion (2.0, 3.0, 4.0, 5.0, and 6.0 μM) upon titration with Cys ([Cys] = 1.0 to 10 μM in 1.0 μM addition step). The LOD(em)Cys have been determined to be 5.16 nM ([Hg2+] = 2.0 μM), 4.48 nM ([Hg2+] = 3.0 μM), 5.51 nM ([Hg2+] = 4.0 μM), 5.95 nM ([Hg2+] = 5.0 μM), and 6.39 nM ([Hg2+] = 6.0 μM) (Fig. S30). The concentration of Hg2+ in ZnPorT8/Hg2+ system showed a clear potential to further tune the sensitivity of the supramolecular system towards biothiols.

ZnPorT8/Hg2+: selectivity of L-Cys and GSH detection

To evaluate the selectivity of ZnPorT8/Hg2+ complex for the spectroscopic detection of biothiols, the UV-vis absorption and emission spectroscopic changes were investigated with 17 other amino acids, i.e. Ala, Arg, Asn, Gln, Glu, Gly, His, Ile, Leu, Lys, Met, Pro, Phe, Ser, Thr, Tyr, and Trp. Fig. 8 illustrates the fluorescence response of ZnPorT8/Hg2+ complex at 654 nm (λexc = 425 nm) upon addition of different amino acids. UV-vis absorption and fluorescence spectra of the ZnPorT8/Hg2+ complex ([ZnPorT8] = 2.0 μM, [Hg2+] = 5.0 μM) showed very little changes upon the addition of any of these 17 amino acids, even at higher concentrations (up to 30 μM, Fig. S8–25). Although the Hg2+ ion is known to bind to N-heterocycles, our data indicated that the Hg2+ affinity for ZnPorT8 is greater than for tested N-heterocyclic amino acids (i.e. Thr, His). ZnPorT8/Hg2+ system exhibited excellent sensitivity for L-Cys and GSH over other amino acids.
image file: c4ra16453a-f8.tif
Fig. 8 Fluorescence intensity changes of solution of the ZnPorT8/Hg2+ complex ([ZnPorT8] = 2.0 μM, [Hg2+] = 5.0 μM) at 654.0 nm upon addition of amino acids ([Cys] = 5.0 μM, [GSH] = 5.0 μM, [other amino acids] = 10.0 μM).

Next, we evaluated the performance of the ZnPorT8/Hg2+ system under conditions in which several analytes were present at high concentrations (competition experiments). We prepared a mixture of amino acids containing Ala, Lys, Met, Pro and Trp, and we also made another mixture of the same amino acids that also contained L-Cys. The concentration of each amino acid was set to 5.0 μM (total amino acid concentrations were 30.0 μM and 25.0 μM, respectively). We added aliquots of these amino acid mixtures to the ZnPorT8/Hg2+ complex ([ZnPorT8] = 2.0 μM, [Hg2+] = 5.0 μM) and recorded absorption and fluorescence spectroscopic changes (ESI, Fig. S31). Addition of the amino acid mixture without L-Cys did not show any evident spectroscopic changes. On the other hand, the mixture containing L-Cys caused very similar spectroscopic changes to neat L-Cys: the blue shift of the Soret absorption band from 428.6 to 425.0 nm and an increase of the fluorescence signal recorded at 654 nm (λexc = 425.0 nm). The results of the competition experiments confirmed that non-thiol amino acids did not interfere with L-Cys sensing by using the absorption and emission spectroscopic responses of the ZnPorT8/Hg2+ complex.

Experimental

Materials

Amino acids (L-Cys, D-Cys, L-GSH, Ala, Arg, Asn, Gln, Gly, Glu, His, Ile, Leu, Lys, Met, Pro, Phe, Ser, Thr, Tyr, and Trp), Hg(ClO4)2, Cu(ClO4)2, and sodium cacodylate were purchased from Sigma-Aldrich. Ultrapure water was obtained from a Milli-Q system with a resistivity of 18.2 MΩ cm. Synthesis, purification and characterization of zinc(II)porphyrin–oligothymine conjugate ZnPorT8 has been reported previously.53,54

Methods

The stock solutions of ZnPorT8, Hg2+, Cu2+, and all amino acids were prepared in a sodium cacodylate buffer (1 mM, pH 7.0). The concentration of ZnPorT8 stock solution was determined by UV-vis absorption spectroscopy using the extinction coefficient εZnPorT8 = 2.9 × 10⁵ M−1 cm−1 at 425 nm.53,54 The fluorescence and absorption titration experiments were performed as follows: aliquots of amino acids (0.8 μL, concentration of the stock solutions = 1 mM) were added into a 800 μL solution of the ZnPorT8/M2+ complex (M2+ = Hg2+ or Cu2+, [ZnPorT8] = 2.0 μM, [Hg2+] = 5.0 μM, [Cu2+] = 20.0 μM) in the sodium cacodylate buffer (1 mM, pH = 7.0). The absorption and emission spectra were recorded upon each addition. The collected spectroscopic data have been corrected for dilution (in all cases dilution was kept below 1%).

Instrumentation

UV-vis absorption spectra were collected at 20 °C using a Jasco V-650 UV-vis double beam spectrophotometer equipped with a single position Peltier temperature control system. Fluorescence measurements were performed at 20 °C on a Varian Cary Eclipse fluorescence spectrophotometer equipped with a Peltier temperature control system. The emission spectra were collected from 500 to 800 nm with an excitation wavelength of 425.0 nm. Conditions were as follows: excitation slit 10 nm, emission slit 10 nm, scan rate 600 nm min−1. A quartz cuvette with a 1 cm path length was used for all absorption and emission experiments.

Conclusions

We have reported a tunable supramolecular system assembled from the zinc(II)porphyrin–oligothymidine conjugate (ZnPorT8) and a transition metal ion as a dual (emission/absorption) highly selective and sensitive optical probe for biothiol. We have shown that the fluorescence as well as absorption response of ZnPorT8 can be switched by a complexed metal ion (either Hg(II) or Cu(II)). The ZnPorT8/Hg2+ complex offered a turn-on fluorescence sensing of Cys and GSH (fluorescence enhancement), while the ZnPorT8/Cu2+ system exhibited reversed turn-off sensing (fluorescence quenching). Both turn-on as well as turn-off biomolecular optical detection can be achieved using the same bioorganic scaffold. Importantly, while the transition metal ions modulated the optical outcome, they had only marginal effect on the sensitivity of the ZnPorT8/M2+ supramolecular system. Both complexes (ZnPorT8/Hg2+ and ZnPorT8/Cu2+) displayed excellent limit of detection using emission signal for Cys (LOD(em) = 5.95 nM and 11.99 nM, respectively) and GSH (LOD(em) = 3.34 nM and 13.50 nM, respectively) using the 3σ/slope method. The other 17 proteinogenic amino acids did not cause any significant fluorescence or absorption signal changes when added to ZnPorT8/Hg2+.

Acknowledgements

We thank UW SER Graduate Assistantship (GS, MB), Center for Photoconversion and Catalysis (MB), Department of Chemistry Graduate Assistantship (JKC) and Wyoming INBRE undergraduate research fellowship (BDJ). We thank Prof. Ed Clennan (Department of Chemistry, UW) for acquisition of and access to the Varian Cary Eclipse fluorescence spectrophotometer.

Notes and references

  1. M. Biesaga, K. Pyrzynska and M. Trojanowicz, Talanta, 2000, 51, 209–224 CrossRef CAS.
  2. Z. J. Li and J. M. Pan, Rev. Anal. Chem., 2002, 21, 167–231 CAS.
  3. L. Lvova, C. Di Natale and R. Paolesse, Sens. Actuators, B, 2013, 179, 21–31 CrossRef CAS PubMed.
  4. T. Kerdcharoen and S. Kladsomboon, in Applications of Nanomaterials in Sensors and Diagnostics, ed. A. Tuantranont, Springer, Berlin, Heidelberg, 2013, pp. 237–255 Search PubMed.
  5. D. Papkovsky and T. O'Riordan, J. Fluoresc., 2005, 15, 569–584 CrossRef CAS PubMed.
  6. R. Purrello, S. Gurrieri and R. Lauceri, Coord. Chem. Rev., 1999, 190–192, 683–706 CrossRef CAS.
  7. M. K. Kuimova, S. W. Botchway, A. W. Parker, M. Balaz, H. A. Collins, H. L. Anderson, K. Suhling and P. R. Ogilby, Nat. Chem., 2009, 1, 69–73 CrossRef CAS PubMed.
  8. L. P. Jameson, J. D. Kimball, Z. Gryczynski, M. Balaz and S. V. Dzyuba, RSC Adv., 2013, 3, 18300–18304 RSC.
  9. C. X. Guo, Y. Lei and C. M. Li, Electroanalysis, 2011, 23, 885–893 CrossRef CAS.
  10. J. K. Choi, A. D'Urso and M. Balaz, J. Inorg. Biochem., 2013, 127, 1–6 CrossRef CAS PubMed.
  11. A. E. Holmes, J. K. Choi, J. Francis, A. D'Urso and M. Balaz, J. Inorg. Biochem., 2012, 110, 18–20 CrossRef CAS PubMed.
  12. J. K. Choi, G. Sargsyan, M. Shabbir-Hussain, A. E. Holmes and M. Balaz, J. Phys. Chem. B, 2011, 115, 10182–10188 CrossRef CAS PubMed.
  13. J. K. Choi, A. Reed and M. Balaz, Dalton Trans., 2014, 43, 563–567 RSC.
  14. X. D. Wang and O. S. Wolfbeis, Chem. Soc. Rev., 2014, 43, 3666–3761 RSC.
  15. E. Bellacchio, R. Lauceri, A. Magri, R. Purrello, S. Gurrieri, L. Monsu Scolaro and A. Romeo, Chem. Commun., 1998, 1333–1334 RSC.
  16. X.-H. Li, Z.-H. Xie, H. Min, Y.-Z. Xian and L.-T. Jin, Electroanalysis, 2007, 19, 2551–2557 CrossRef CAS.
  17. B. J. White and H. J. Harmon, IEEE Sens. J., 2005, 5, 726–732 CrossRef CAS.
  18. J. K. Choi, G. Sargsyan, A. M. Olive and M. Balaz, Chem.–Eur. J., 2013, 19, 2515–2522 CrossRef CAS PubMed.
  19. A. Rigo, A. Corazza, M. Luisa di Paolo, M. Rossetto, R. Ugolini and M. Scarpa, J. Inorg. Biochem., 2004, 98, 1495–1501 CrossRef CAS PubMed.
  20. I. Onyido, A. R. Norris and E. Buncel, Chem. Rev., 2004, 104, 5911–5930 CrossRef CAS PubMed.
  21. K.-H. Leung, H.-Z. He, V. P.-Y. Ma, D. S.-H. Chan, C.-H. Leung and D.-L. Ma, Chem. Commun., 2013, 49, 771–773 RSC.
  22. H. Xu, Y. Wang, X. Huang, Y. Li, H. Zhang and X. Zhong, Analyst, 2012, 137, 924–931 RSC.
  23. K. S. Park, M. I. Kim, M.-A. Woo and H. G. Park, Biosens. Bioelectron., 2013, 45, 65–69 CrossRef CAS PubMed.
  24. A. K. Mahapatra, J. Roy, P. Sahoo, S. K. Mukhopadhyay, A. Banik and D. Mandal, Tetrahedron Lett., 2013, 54, 2946–2951 CrossRef CAS PubMed.
  25. Q. Lin, Y. Huang, J. Fan, R. Wang and N. Fu, Talanta, 2013, 114, 66–72 CrossRef CAS PubMed.
  26. H. Xu and M. Hepel, Anal. Chem., 2011, 83, 813–819 CrossRef CAS PubMed.
  27. B. Han, J. Yuan and E. Wang, Anal. Chem., 2009, 81, 5569–5573 CrossRef CAS PubMed.
  28. N. Kaur, P. Kaur and K. Singh, RSC Adv., 2014, 4, 29340–29343 RSC.
  29. X. Jia, J. Li and E. Wang, Chem.–Eur. J., 2012, 18, 13494–13500 CrossRef CAS PubMed.
  30. Y. Gao, Y. Li, X. Zou, H. Huang and X. Su, Anal. Chim. Acta, 2012, 731, 68–74 CrossRef CAS PubMed.
  31. L. Chang, T. Wu and F. Chen, Microchim. Acta, 2012, 177, 295–300 CrossRef CAS.
  32. F. Y. Wu, W. S. Liao, Y. M. Wu and X. F. Wan, Spectrosc. Lett., 2008, 41, 393–398 CrossRef CAS.
  33. W. S. Liao, F. Y. Wu, Y. M. Wu and X. J. Wang, Microchim. Acta, 2008, 162, 147–152 CrossRef CAS.
  34. J. Zong, X. Yang, A. Trinchi, S. Hardin, I. Cole, Y. Zhu, C. Li, T. Muster and G. Wei, Biosens. Bioelectron., 2014, 51, 330–335 CrossRef CAS PubMed.
  35. S. Shahrokhian, Anal. Chem., 2001, 73, 5972–5978 CrossRef CAS.
  36. Y. Zhang, Y. Li and X.-P. Yan, Anal. Chem., 2009, 81, 5001–5007 CrossRef CAS PubMed.
  37. B. Han, J. Yuan and E. Wang, Anal. Chem., 2009, 81, 5569–5573 CrossRef CAS PubMed.
  38. A. Chauhan and V. Chauhan, Pathophysiology, 2006, 13, 171–181 CrossRef CAS PubMed.
  39. S. M. Deneke, Curr. Top. Cell. Regul., 2000, 36, 151–180 CAS.
  40. X. F. Wang and M. S. Cynader, J. Neurosci., 2001, 21, 3322–3331 CAS.
  41. S. Seshadri, A. Beiser, J. Selhub, P. F. Jacques, I. H. Rosenberg, R. B. D'Agostino, P. W. F. Wilson and P. A. Wolf, N. Engl. J. Med., 2002, 346, 476–483 CrossRef CAS PubMed.
  42. A. Meister, Science, 1983, 220, 472–477 CAS.
  43. N. Burford, M. D. Eelman, D. E. Mahony and M. Morash, Chem. Commun., 2003, 146–147 RSC.
  44. A. Levina and P. A. Lay, Inorg. Chem., 2003, 43, 324–335 CrossRef PubMed.
  45. Y. Zhou and J. Yoon, Chem. Soc. Rev., 2012, 41, 52–67 RSC.
  46. X. Dai, Q.-H. Wu, P.-C. Wang, J. Tian, Y. Xu, S.-Q. Wang, J.-Y. Miao and B.-X. Zhao, Biosens. Bioelectron., 2014, 59, 35–39 CrossRef CAS PubMed.
  47. J. Zhu, X. Song, L. Gao, Z. Li, Z. Liu, S. Ding, S. Zou and Y. He, Biosens. Bioelectron., 2014, 53, 71–75 CrossRef CAS PubMed.
  48. W. Stricks and I. M. Kolthoff, J. Am. Chem. Soc., 1953, 75, 5673–5681 CrossRef CAS.
  49. K. K. Divine, F. Ayala-Fierro, D. S. Barber and D. E. Carter, J. Toxicol. Environ. Health, Part A, 1999, 57, 489–505 CrossRef CAS.
  50. L. Pecci, G. Montefoschi, G. Musci and D. Cavallini, Amino Acids, 1997, 13, 355–367 CrossRef CAS.
  51. T. Wen, S. Hou, J. Yan, H. Zhang, W. Liu, Y. Ji and X. Wu, RSC Adv., 2014, 4, 45159–45162 RSC.
  52. J. H. Freedman, M. R. Ciriolo and J. Peisach, J. Biol. Chem., 1989, 264, 5598–5605 CAS.
  53. G. Sargsyan and M. Balaz, Org. Biomol. Chem., 2012, 10, 5533–5540 CAS.
  54. G. Sargsyan, B. L. MacLeod, U. Tohgha and M. Balaz, Tetrahedron, 2012, 68, 2093–2099 CrossRef CAS PubMed.

Footnote

Electronic supplementary information (ESI) available: UV-vis absorption and emission spectra of ZnPorT8/Hg2+ and ZnPorT8/Cu2+ complexes titrated with different amino acids. See DOI: 10.1039/c4ra16453a

This journal is © The Royal Society of Chemistry 2015
Click here to see how this site uses Cookies. View our privacy policy here.