DOI:
10.1039/C4RA16268D
(Paper)
RSC Adv., 2015,
5, 18615-18621
One step synthesis cadmium sulphide/reduced graphene oxide sandwiched film modified electrode for simultaneous electrochemical determination of hydroquinone, catechol and resorcinol
Received
12th December 2014
, Accepted 2nd February 2015
First published on 3rd February 2015
Abstract
In this work, a novel sandwiched film of cadmium sulphide/reduced graphene oxide (CdS/r-GO) was synthesized via one step hydro-thermal reaction and electrodes modified with this composite were successfully used to simultaneously determine hydroquinone (HQ), catechol (CC) and resorcinol (RC). Additionally, some kinetic parameters, such as the charge transfer coefficient (α) and the electron transfer rate constant (ks) were calculated. Differential pulse voltammetry (DPV) was used for the simultaneous determination of HQ, CC and RC in their ternary mixture. The calibration curves of HQ, CC and RC were obtained in the ranges of 0.2 to 2300 μM, 0.5 to 1350 μM and 1.0 to 500 μM, respectively. The detection limits for HQ, CC and RC were 0.054 μM, 0.09 μM and 0.23 μM, respectively (S/N = 3). The modified electrode was then used to analyse tap water, well water and river water and the results show its significance for practical applications in the aquatic environment.
1. Introduction
Hydroquinone (HQ), catechol (CC) and resorcinol (RC) are three isomers of dihydroxybenzene, which are widely used in metallurgy, pharmacy, the petroleum chemical industry, plastic and other related industries.1–3 Moreover, they have low degradability and can have deleterious effects on vegetation, animals and humans, if inadvertently released into the environment during the manufacturing processes of industrial compounds. Research shows that human health, animals, plants and aquatic life may be threatened certain amounts of dihydroxybenzene isomers are ingested.4–6 So they are considered as environmental pollutants by the US Environmental Protection Agency (EPA) and the European Union (EU).7 Thus, the development of fast and convenient analytical methods for the determination of dihydroxybenzene isomers is imperative. However, the similar structures and properties of HQ, CC and RC make it hard to identify each of them, so the determination of specific dihydroxybenzene isomers is of great practical significance.8
So far, various techniques have been employed for the simultaneous determination of dihydroxybenzene isomers including chromatography,9,10 spectrophotometry,11 synchronous fluorescence,12,13 electrochemical methods,14 and so on. Among these methods, the electrochemical technique is the most efficient method in the simultaneous determination of dihydroxybenzene isomers due to its excellent properties such as simple operation, high sensitivity and low cost. As far as we know, the simultaneous determination of HQ, CC and RC with a wide linear range is still a big problem because they have very similar structures and overlapping oxidation potentials.15,16 Thus, we design appropriate materials to improve the selectivity of the working electrode and widen the linear range.
Carbon nanocomposites such as carbon nanotubes,17 carbon nanofibers18 and functionalized graphene are considered as ideal matrices in the fabrication of electrochemical sensors. Among them, graphene, as a class of ‘two-dimensional’ (2D) carbon nanomaterial, has recently received considerable attention because of its advantageous characteristics of uniform and tailored pore structure, high theoretical surface area and excellent electronic conductivity.19–21 Moreover, integrating graphene into self-assembled graphene-based composites can not only promote the electron transfer rate, but also strengthen the synergistic interactions in graphene-based composites. For example, Huang and coworkers synthesized (AgNPs)–polydopamine@graphene composites and used these for high-performance electrochemical detection,22 Yu and coworkers synthesized graphene/MoS2 nanoflakes for lithium-ion batteries,23 Li et al. introduced CdS-cluster–graphene into photocatalytic hydrogen production,24 etc. These reports demonstrate well that the combination of graphene and other different materials has the possibility to form different types of graphene-based hybrid materials. As part of the class of transition-metal dichalcogenides, cadmium sulfide (CdS) has recently received considerable attention because of its advantageous bandgap and quantum size characteristics. The electron–hole species can efficiently transport electrons on the surface of CdS.25,26 Specifically, high-quality CdS nanoparticles are of great interest to develop biosensors.27,28
In this paper, we applied a one-step reaction to fabricate sandwiched structured cadmium sulphide/reduced graphene oxide (CdS/r-GO) films and modified electrodes were used for the simultaneous detection of dihydroxybenzene isomers for the first time. The calibration curves for HQ, CC and RC were obtained in the wide ranges of 0.2 to 2300 μM, 0.5 to 1350 μM and 1.0 to 500 μM, respectively. Low limits of detection were found for HQ, CC and RC of 0.054 μM, 0.09 μM and 0.23 μM (S/N = 3), respectively. Then the CdS/r-GO was further applied for the determination of dihydroxybenzene isomers in the practical aquatic environment.
2. Experimental
2.1. Reagents and apparatus
Graphite powder, sodium nitrate, potassium permanganate, hydrochloric acid, sulfuric acid, hydrogen peroxide (30%) and phosphate buffer solution were purchased from Sinopharm Chemical Reagent Co., Ltd. Hydroquinone (HQ), catechol (CC), resorcinol (RC), cadmium carbonate and acetic acid were purchased from Xilong Chemical Co., Ltd. All other reagents are analytical reagents. All aqueous solutions were prepared using ultrapure water (18 MΩ cm) from a Milli-Q system (Millipore).
Scanning electron microscopy (SEM) and energy dispersive X-ray spectroscopy (EDS) were conducted on JEM-6010La. Atomic force microscope (AFM) images were obtained with a CSPM 5500 scanning probe microscope (China). All electrochemical measurements were performed on a CHI660E electrochemical workstation (Chenhua Co., Shanghai, China). A glassy carbon electrode (CHI104, d = 3 mm) was used as the working electrode. A Ag/AgCl electrode and platinum wire were used as the reference and auxiliary electrodes, respectively.
2.2. Synthesis of cadmium sulphide/reduced graphene oxide composite materials
The graphene oxide (GO) was synthesized from natural graphite by a modified Hummers’ method, which has been reported previously.29 The GO was dispersed in water (10 g L−1), then cadmium acetate was synthesized with 0.2 mM L−1 CdCO3 and a certain amount of ethylic acid solution. Then GO (4 mL) and cadmium acetate were dispersed in 30 mL dimethylsulfoxide (DMSO) under vigorous ultrasonication (40 kHz, 500 W) for 20 min until the solution was homogeneously mixed. It was then transferred into a 45 mL autoclave and heated at 180 °C for 6 h. This caused the reduction of GO into r-GO by high temperature and high pressure during the reaction. The brownish-green cadmium sulphide/reduced graphene oxide (CdS/r-GO) products were obtained and washed several times with water and ethanol and then oven dried at 80 °C.
2.3. Modification of electrodes
First, the glassy carbon electrode was polished to a mirror-like finish with 1.0, 0.3 and 0.05 μm alumina powder, respectively and thoroughly cleaned before use. Then, 6.0 μL of CdS/r-GO solution was dropped onto the surface of the working electrode, and dried on the surface of the CdS/r-GO glassy carbon electrode at room temperature.
3. Results and discussion
3.1. Characterization of GO and the CdS/r-GO composite material
The surface morphologies of graphene oxide (GO) and the CdS/r-GO film were investigated by scanning electron microscopy (SEM). As shown in Fig. 1A, the GO product had a sheet morphology, which was in agreement with that reported previously.30,31 The CdS/r-GO consisted of layer–layer graphene sheets decorated with CdS. Wrinkles of CdS/r-GO, a characteristic feature of the graphene sheets, were observed in Fig. 1B. In addition, the EDS results indicated that the CdS/r-GO contained mainly carbon, oxygen, sulphur and cadmium without any observable impurities, as shown in Fig. 1C, which indicated that a CdS decorated r-GO film had been successfully synthesized by a one-step process.
 |
| | Fig. 1 SEM images of GO (A) and CdS/r-GO (B), and EDS of the CdS/r-GO composite material (C). | |
Atomic force microscope (AFM) images of the r-GO/GCE and the CdS/r-GO/GCE film are shown in Fig. 2. It is observed that the r-GO/GCE has a layer structure and is relatively smooth with an average roughness of 35.7 nm (Fig. 2A). However, on CdS/r-GO/GCE (Fig. 2B), the surface showed irregular spinous islands and lots of adjacent peaks with an average roughness of 146 nm, which was obviously larger than that (35.7 nm) on bare r-GO/GCE, indicating the morphology of the modified electrode had changed. The profile line showed the highest and lowest peaks of r-GO/GCE were 615.5 nm and 470.8 nm, respectively. Those of the CdS/r-GO/GCE were 1191.2 nm and 475.5 nm, respectively. The differences in roughness and section features demonstrated that the r-GO and CdS/r-GO had been successfully modified on the electrode and improved the surface effect of the electrode interface.
 |
| | Fig. 2 AFM images and profile line of the bare r-GO/GCE (A) and the CdS/r-GO/GCE (B). | |
3.2. Characterization of the electrochemical behavior of the CdS/r-GO/GCE
The electrochemical properties of the different electrodes of GCE, r-GO/GCE and CdS/r-GO/GC were determined by cyclic voltammetry (CV). As illustrated in Fig. 3, the oxidation peak current of dihydroxybenzene isomers increased significantly on CdS/r-GO/GCE. A possible reaction mechanism is discussed here, as shown in Scheme 1. It is generally known that the transition-metal CdS not only has the excellent electrical conductivity of the semiconductor materials, but also acts as an electron transfer channel, accelerating the electron transfer between the surface of r-GO and the CdS. The sp2 and sp3 hybridized carbon–carbon bonds of r-GO provided a high level of conductivity and redox in the electrochemical reaction.32–35 By chemical combining of CdS/r-GO sandwiched film would be possessed the good electron conductivity, low diffusion resistance to protons/cations, easy electrolyte penetration, and high electroactive areas to provide a homogenous environment for the fabrication of high performance electrochemical sensors.36–38 Therefore the CdS/r-GO modified electrode had a more stable electrical signal, and higher specificity and repeatability for dihydroxybenzene isomers.
 |
| | Fig. 3 Cyclic voltammograms of 0.2 mM HQ, CC and RC in pH 7.0 at (A) GCE, (B) r-GO/GCE, (C) CdS/r-GO/GCE. | |
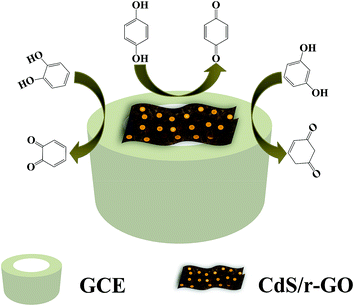 |
| | Scheme 1 The reaction mechanism of CdS/r-GO/GCE with dihydroxybenzene isomers. | |
3.3. Effect of pH
The effect of the pH value on the electrochemical behavior of 0.2 mM HQ, 0.2 mM CC and 0.2 mM RC in a mixed solution at the CdS/r-GO/GCE was investigated by CV in increasing pH ranging from 4.0 to 8.5. As shown in Fig. 4, it could be seen that the oxidation peak currents of HQ, CC and RC increased with increasing pH value until this reached 7.0, and then the oxidation peak currents decreased when the pH increased further. In weak acid, the CdS/r-GO would be protonated and the hydroxyl in dihydroxybenzene would not be ionized, which decreases the adsorption capacity of dihydroxybenzene isomers and produces a high overpotential. In alkaline solution, the dihydroxybenzene isomers were unstable, which could easily be oxidized and affect the detection of target molecules. Therefore, a pH of 7.0 was chosen as the optimum for subsequent analytical experiments.
 |
| | Fig. 4 The oxidation peak currents of 0.2 mM HQ, CC and RC on the CdS/r-GO/GCE at different pH values (5.5, 6.0, 6.5, 7.0, 7.5, 8.0, 8.5) (scan rate: 0.1 V s−1). Inset: the plots of Epa with pH values. | |
The relationship between the peak potential Epa and pH on the CdS/r-GO/GCE was also investigated and the results were shown in Fig. 4. For HQ, the linear equation was Epa/V = −0.0574 pH + 0.518 (R = 0.9968); the CC linear equation was Epa/V = −0.0623 pH + 0.6412 (R = 0.9982); for RC, the equation was Epa/V = −0.0652 pH + 1.057 (R = 0.9987). The slopes of the three regression equations were approximate with the theoretical value −0.059 V pH−1 of Nernst. This indicated that the electrochemical oxidation of HQ, CC and RC on CdS/r-GO/GCE should be a two electron and two proton process.39
3.4. Effects of scan rate
In the following experiment, the scan rate of HQ, CC and RC (CV of 0.2 mM on the CdS/r-GO/GCE with different scan rates) was investigated to better understand the electrochemical mechanism on CdS/r-GO/GCE. As shown in Fig. 5, the redox peak current of the dihydroxybenzene isomers increased linearly with scan rate in the range of 0.01–0.4 V s−1. Moreover, with the increase of scan rate, the redox potential of HQ, CC and RC shifted positively. For HQ, the linear relationship between the redox potential and the scan rate were Ipa (μA) = −112.88ν (V s−1) − 2.341 (R = 0.9972) and Ipc (μA) = 121.73ν (V s−1) + 5.592 (R = 0.9972). For CC, the linear equations were Ipa (μA) = −125.47ν (V s−1) − 6.926 (R = 0.9965) and Ipc (μA) = 83.12ν (V s−1) + 2.149 (R = 0.9976). But for RC there was only an oxidation peak, which showed the oxidation process was an irreversible electrode process, the linear regression equation of RC could be expressed as Ipa (μA) = −136.9ν (V s−1) − 9.784 (R = 0.9973), which indicated that the redox of HQ, CC and RC on CdS/r-GO/GCE were typical adsorption-controlled processes.40
 |
| | Fig. 5 Cyclic voltammograms of 0.2 mM HQ, CC and RC on the CdS/r-GO/GCE at different scan rates (0.01, 0.03, 0.05, 0.075, 0.10, 0.15, 0.20, 0.25, 0.30, 0.35, 0.40 V s−1). Inset: the relationship of the redox peak current with the scan rate. | |
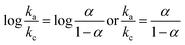
For the reversible electrochemical process, the dependence of the potential and scan rate could be described according to Laviron theory:41
| |
 | (1) |
where
ka and
kc are the slope of the straight lines for
Epa versus log
![[thin space (1/6-em)]](https://www.rsc.org/images/entities/char_2009.gif) ν
ν and
Epc versus log
ν, respectively. In this work, the
Epa and
Epc were linearly dependent on the log
ν with the regression equations of
Epa (V) = 0.027
log
ν (V s
−1) + 0.133 (
R = 0.9989) and
Epc (V) = −0.021
log
ν (V s
−1) − 0.015 (
R = 0.995) for HQ, and
Epa (V) = 0.026
log
ν (V s
−1) + 0.239 (
R = 0.9945) and
Epc (V) = −0.012
log
ν (V s
−1) − 0.0153 (
R = 0.9947) for CC. Thus,
α was calculated to be 0.563 and 0.684 for HQ and CC. The apparent heterogeneous electron transfer rate constant (
ks) could also be obtained according to the
Eq:
42,43| |
 | (2) |
where
n is the number of electrons involved in the reaction, and Δ
Ep was the peak-to-peak potential separation of 0.11, the other symbols have their usual meanings. The number of electrons involved in the reaction of HQ and CC was 2. Thus, the values of
ks were calculated to be 0.462 cm s
−1 and 0.539 cm s
−1 for HQ and CC, respectively. These results indicated that the CdS/r-GO composite material can effectively promote the electron transfer.
For RC, the relationship between the anodic peak potential (Epa) and the natural logarithm of the scan rate (lnν) was constructed and followed the linear regression equation of Epa (V) = 0.012 lnν (mV s−1) + 0.65 (R = 0.9969). For an irreversible electrode process, the relationship between Epa and lnν was expressed as follows by Laviron:
| |
 | (3) |
where
E0 is the standard electrode potential,
α is the charge transfer coefficient,
n is the transfer electron number, and
R,
T and
F have their usual meanings. Because the number of electrons involved in the oxidation process is 2,
α was calculated to be 0.35.
3.5. Differential pulse voltammetry for the simultaneous determination of HQ, CC and RC
Differential pulse voltammetry (DPV) was used for the quantitative determination of HQ, CC and RC. As shown in Fig. 6, under the optimal conditions, the individual determination of HQ, CC, or RC in their mixtures were investigated when the concentration of one species changed, whereas those of the other two species remained constant. Fig. 6A shows the DPV of HQ with different concentrations in the presence of 0.2 mM CC and 0.2 mM RC. Two linear regression equations were also obtained which were calculated as Ipa (μA) = −0.0897C (μM) − 21.08 (0.2 to 60 μM, R = 0.9956) and Ipa (μA) = −0.0123C (μM) − 27.186 (60 to 2300 μM, R = 0.9979). Similarly, as shown in Fig. 6B, when keeping the concentration of HQ and RC constant (0.2 mM), the oxidation peak current increased linearly with an increasing concentration of CC in the range of Ipa (μA) = −0.0327C (μM) − 18.57 (0.5 to 1350 μM, R = 0.9965). Fig. 6C shows the DPV of RC with different concentrations in the presence of 0.2 mM HQ and 0.2 mM CC, the linear regression equation was calibrated as Ipa (μA) = −0.0398C (μM) − 8.489 (1.0 to 500 μM, R = 0.9947). The detection limits of blank (S/N = 3) for the determination of HQ, CC and RC were evaluated as 0.054 μM, 0.09 μM and 0.23 μM. Thus, the selective and sensitive determination of HQ, CC and RC were achieved simultaneously with the CdS/r-GO/GCE.
 |
| | Fig. 6 (A) DPV of HQ concentrations: 0, 0.2 μM, 1.0 μM, 10 μM, 20 μM, 40 μM, 70 μM, 130 μM, 190 μM, 250 μM, 340 μM, 450 μM, 580 μM, 700 μM, 850 μM, 1000 μM, (B) DPV of CC concentrations: 0, 0.5 μM, 5 μM, 15 μM, 40 μM, 60 μM, 160 μM, 280 μM, 460 μM, 700 μM, 1000 μM, 1350 μM and (C) DPV of RC concentrations: 0, 1 μM, 5 μM, 15 μM, 25 μM, 60 μM, 100 μM, 180 μM, 300 μM, 500 μM at the CdS/r-GO/GCE in the presence of the two other interfering substances (concentration: 0.2 μM). | |
3.6. Interference and repeatability studies
Some common interferents for the simultaneous determination of HQ, CC and RC were investigated, such as NaCl, K2SO4, and MgCl2 solutions (150 fold), and phenol, nitrophenol and glucose solutions (100 fold). The oxidation peak potential and current of HQ, CC and RC were observed almost constantly. In addition, the modified electrode was used to determine dihydroxybenzene isomer samples every four days. Fig. 7 shows that electrochemical sensor could keep its activity for almost a month. Moreover, the comparison of the proposed method with other electrochemical methods reported for the determination of dihydroxybenzene isomers is summarized in Table 1. Compared to HPLC methods, this sensor has a wider detection range and lower detection limits.44 Thus, our simple and inexpensive method is very promising in the determination of dihydroxybenzene isomers. Thus, the results indicated that the CdS/r-GO/GCE exhibited good selectivity for the detection of dihydroxybenzene isomers.
 |
| | Fig. 7 CV of 0.2 mM HQ, CC and RC recorded on the CdS/r-GO/GCE with increasing time. | |
Table 1 Comparison of different electrochemical sensors for the determination of dihydroxybenzene isomers
| Electrode |
Linear (μM) |
Detection limit (μM) |
Ref. |
| HQ |
CC |
RC |
HQ |
CC |
RC |
| Pyridinic-NG/GCE |
5.0–200 |
5.0–200 |
— |
0.38 |
1 |
— |
3 |
| Graphene–chitosan/GCE |
1.0–400 |
1.0–550 |
1.0–300 |
0.75 |
0.75 |
0.75 |
7 |
| PTH/GCE |
0.5–25 |
100–200 |
— |
0.03 |
0.025 |
— |
8 |
| CNP–chitosan/GCE |
0.8–100 |
0.8–100 |
8.0–1000 |
0.2 |
0.2 |
3 |
15 |
| AgNPs–Pdop@Gr/GCE |
— |
0.5–240 |
— |
— |
0.1 |
— |
40 |
| WS2–Gr/GCE |
1–100 |
1–100 |
1–100 |
0.1 |
0.2 |
0.1 |
42 |
| CdS/r-GO/GCE |
0.2–2300 |
0.5–1350 |
1.0–500 |
0.054 |
0.09 |
0.23 |
This work |
3.7. Application of the method to analysis samples
For further evaluation of the applicability of the method, tap water, well water and local river water samples were used for quantitative analysis after filtering with a cellulose membrane filter (pore size 0.25 μm) several times. Then, 5 mL of the real samples were diluted to 10 mL with 0.1 mM PBS solutions. The results are shown in Table 2. The recovery of the spiked samples ranged between 96.8% and 102.7% (n = 6). The results indicated the practical applicability of the CdS/r-GO/GCE for the simultaneous determination of HQ, CC and RC in practical water samples.
Table 2 Results of determination of dihydroxybenzene isomers in the real samples
| Samples |
Original (μM) |
Added (μM) |
Found (μM) |
Recovery (%) |
| HQ |
CC |
RC |
HQ |
CC |
RC |
HQ |
CC |
RC |
| Tap water |
— |
50 |
50 |
50 |
50.3 ± 0.7 |
49.6 ± 0.5 |
50.9 ± 0.8 |
100.9 |
98.6 |
102.8 |
| 100 |
100 |
100 |
99.2 ± 0.5 |
100.9 ± 0.6 |
100.7 ± 0.9 |
98.9 |
101.4 |
101.6 |
| Well water |
— |
50 |
50 |
50 |
50.6 ± 0.5 |
50.9 ± 0.4 |
49.3 ± 0.8 |
101.9 |
102.2 |
97.8 |
| 100 |
100 |
100 |
100.6 ± 0.3 |
98.9 ± 0.7 |
101.5 ± 1.1 |
100.8 |
98.6 |
102.1 |
| River water |
— |
50 |
50 |
50 |
49.3 ± 0.7 |
50.4 ± 0.5 |
48.8 ± 1.0 |
98.1 |
101.8 |
96.8 |
| 100 |
100 |
100 |
100.2 ± 0.5 |
100.9 ± 0.4 |
98.7 ± 1.2 |
100.5 |
101.2 |
98.3 |
4. Conclusions
In summary, the CdS/r-GO sandwiched film composites were firstly designed as a support matrix for the construction of electrochemical sensors for the simultaneous determination of HQ, CC and RC. Three pairs of independent redox peaks were obtained. The value of the charge transfer coefficient (α) and the electron transfer rate constant (ks) were calculated. The CdS/r-GO/GCE exhibited a low detection limit and wide linear range, and the detection limits for HQ, CC, and RC were 0.054 μM, 0.09 μM and 0.23 μM (S/N = 3), respectively. The recovery of the water samples ranged between 96.8% and 102.7%, which could provide a promising platform for the quantitative determination of HQ, CC and RC at micromole levels in practical water samples.
Acknowledgements
This project was supported by Fujian Province Natural Science Foundation (2012D136), National Undergraduate Innovative Training Program (201410402002), and The Science and Technology Foundation of Fujian Provincial Bureau Quality and Technical Supervision (no. FJQI 2013108).
References
- D. Zhao, X. Zhang, L. Feng, L. Jia and S. Wang, Colloids Surf., B, 2009, 74, 317–321 CrossRef CAS PubMed.
- Y. Du, M. Zhou and L. Lei, J. Hazard. Mater., 2006, 136, 859–865 CrossRef CAS PubMed.
- H. L. Guo, S. Peng, J. H. Xu, Y. Q. Zhao and X. Kang, Sens. Actuators, B, 2014, 193, 623–629 CrossRef CAS PubMed.
- Y. Quan, Z. Xue, H. Shi, X. Zhou, J. Du and X. Lu, Analyst, 2012, 137, 944–952 RSC.
- A. T. E. Vilian, M. Rajkumar, S. M. Chen, C. C. Hu and S. Piraman, RSC Adv., 2014, 4, 48522–48534 RSC.
- B. Kaur and R. Srivastava, Electroanalysis, 2014, 26, 1739–1750 CrossRef CAS.
- H. Wang, Y. Wu and X. Yan, Anal. Chem., 2013, 85, 1920–1925 CrossRef CAS PubMed.
- A. J. S. Ahammad, M. M. Rahman, G. Xu, S. Kim and J. Lee, Electrochim. Acta, 2011, 56, 5266–5272 CrossRef CAS PubMed.
- M. A. Ghanem, Electrochem. Commun., 2007, 9, 2501–2506 CrossRef CAS PubMed.
- A. Kumar and A. Pamwar, Microchim. Acta, 1993, 111, 177–182 CrossRef CAS.
- S. P. Wang and T. H. Huang, Anal. Chim. Acta, 2005, 534, 207–214 CrossRef CAS PubMed.
- P. Nagaraja, R. A. Vasantha and K. R. Sunitha, Talanta, 2011, 55, 1039–1046 CrossRef.
- W. Zhang, D. L. Lin, Z. X. Zou and Y. Q. Li, Talanta, 2007, 71, 1481–1486 CrossRef CAS PubMed.
- J. T. Han, K. J. Huang, J. Li, Y. M. Liu and M. Yu, Colloids Surf., B, 2012, 98, 58–62 CrossRef CAS PubMed.
- M. Amiri, S. Ghaffari, A. Bezaatpour and F. Marken, Sens. Actuators, B, 2012, 162, 194–200 CrossRef CAS PubMed.
- W. Xiong, M. Wu, L. Zhou and S. Liu, RSC Adv., 2014, 4, 32092–32099 RSC.
- K. J. Huang, Y. J. Liu, H. B. Wang, Y. Y. Wang and Y. M. Liu, Biosens. Bioelectron., 2014, 55, 195–202 CrossRef CAS PubMed.
- M. A. Guillorn, T. E. McKnight, A. Melechko, V. I. Merkulov, P. F. Britt, D. W. Austin, D. H. Lowndes and M. L. Simpson, J. Appl. Phys., 2002, 91, 3824–3828 CrossRef CAS PubMed.
- X. R. Wang, X. L. Li, L. Zhang, Y. K. Yoon, P. K. Weber, H. L. Wang, J. Guo and H. J. Dai, Science, 2009, 324, 768–771 CrossRef CAS PubMed.
- X. M. Chen, G. H. Wu, Y. Q. Jiang, Y. R. Wang and X. Chen, Analyst, 2011, 136, 4631–4640 RSC.
- L. A. Mashat, K. Shin, K. Kalantar-zadeh, J. D. Plessis, S. H. Han, R. W. Kojima, R. B. Kaner, D. Li, X. Gou, S. J. Ippolito and W. Wlodarski, J. Phys. Chem. C, 2010, 114, 16168–16173 Search PubMed.
- K. J. Huang, L. Wang, H. B. Wang, T. Gan, Y. Y. Wu, J. Li and Y. M. Liu, Talanta, 2013, 114, 43–48 CrossRef CAS PubMed.
- H. Yu, C. Ma, B. Ge, Y. Chen, Z. Xu, C. Zhu, C. Li, Q. Ouyang, P. Gao, J. Li, C. Sun, L. Qi, Y. Wang and F. Li, Chem.–Eur. J., 2013, 19, 5818–5823 CrossRef CAS PubMed.
- Q. Li, B. Guo, J. Yu, J. Ran, B. Zhang, H. Yan and J. R. Gong, J. Am. Chem. Soc., 2011, 133, 10878–10884 CrossRef CAS PubMed.
- X. Chen, X. J. Huang, L. G. Kong, Z. Guo, X. C. Fu, M. Q. Li and J. H. Liu, J. Mater. Chem., 2010, 20, 352–359 RSC.
- L. Sheeney-Haj-Ichia, J. Wasserman and I. Willner, Adv. Mater., 2002, 14, 1323–1326 CrossRef CAS.
- I. Willner, F. Patolsky and J. Wasserman, Angew. Chem., Int. Ed., 2001, 40, 1861–1864 CrossRef CAS.
- B. X. F. Wang, Y. Zhou, J. J. Xu and H. Y. Chen, Adv. Funct. Mater., 2009, 19, 1444–1450 CrossRef.
- W. S. Hummers and R. E. Offeman, J. Am. Chem. Soc., 1958, 80, 1339 CrossRef CAS.
- A. C. Ferrari, J. C. Meyer and V. Scardaci, Phys. Rev. Lett., 2006, 97, 7404–7410 Search PubMed.
- Y. Zhu, S. Murali, W. Cai, X. Li, J. W. Suk, J. R. Potts and R. S. Ruoff, Adv. Mater., 2010, 35, 3906–3924 CrossRef PubMed.
- A. Martín, J. Hernández-Ferrer, L. Vázquez, M. T. Martínez and A. Escarpa, RSC Adv., 2014, 4, 132–139 RSC.
- S. Park and R. S. Ruoff, Nat. Nanotechnol., 2009, 4, 217–224 CrossRef CAS PubMed.
- S. Zhang, S. Tang, J. Lei, H. Dong and H. Ju, J. Electroanal. Chem., 2011, 656, 285–288 CrossRef CAS PubMed.
- X. Chen, H. Ye, W. Wang, B. Qiu, Z. Lin and G. Chen, Electroanalysis, 2010, 22, 2347–2352 CrossRef CAS.
- B. Z. Fan, J. Yan, L. Zhi, Q. Zhang, T. Wei, J. Feng, M. Zhang, W. Qian and F. Wei, Adv. Mater., 2010, 22, 3723–3728 CrossRef PubMed.
- J. Wu, X. Shen, L. Jiang, K. Wang and K. Chen, Appl. Surf. Sci., 2010, 256, 2826–2830 CrossRef CAS PubMed.
- Q. Qu, S. Yang and X. Feng, Adv. Mater., 2011, 23, 5574–5580 CrossRef CAS PubMed.
- Y. Zhao, Y. Gao, D. Zhan, H. Liu, Q. Zhao, Y. Kou, Y. Shao, M. Li, Q. Zhuang and Z. Zhu, Talanta, 2005, 66, 51–57 CrossRef CAS PubMed.
- K. J. Huang, L. Wang, J. Li, M. Yu and Y. M. Liu, Microchim. Acta, 2013, 180, 751–757 CrossRef CAS.
- J. H. Li, D. Z. Kuang, Y. L. Feng, F. X. Zhang, Z. F. Xu and M. Q. Liu, J. Hazard. Mater., 2012, 250, 201–202 Search PubMed.
- K. J. Huang, L. Wang, Y. J. Liu, T. Gan, Y. M. Liu, L. L. Wang and Y. Fan, Electrochim. Acta, 2013, 107, 379–387 CrossRef CAS PubMed.
- E. Laviron, J. Electroanal. Chem., 1979, 101, 19–28 CrossRef CAS.
- N. A. Penner and P. N. Nesterenko, Analyst, 2000, 125, 1249–1254 RSC.
|
| This journal is © The Royal Society of Chemistry 2015 |
Click here to see how this site uses Cookies. View our privacy policy here. 


