Ceria nanoparticles for the treatment of Parkinson-like diseases induced by chronic manganese intoxication

Alessandra Pinnaa, Luca Malfattia, Grazia Gallerib, Roberto Manettib, Sara Cossub, Gaia Rocchittab, Rossana Mighelib, Pier Andrea Serra*b and Plinio Innocenzi*a
aLaboratorio di Scienza dei Materiali e Nanotecnologie, CR-INSTM, Università di Sassari, Palazzo Pou Salid, Piazza Duomo 6, 07041 Alghero, SS, Italy. E-mail: plinio@uniss.it; Fax: +39 079 9720420
bDipartimento di Medicina Clinica e Sperimentale, Università di Sassari, Viale S. Pietro 43 B, 07100 Sassari, Italy. E-mail: paserra@gmail.com; Fax: +39 079 228525

Received 17th December 2014 , Accepted 12th February 2015

First published on 12th February 2015


Abstract

Ceria nanoparticles with controlled size have been studied as antioxidant agents for the in vitro protection of catecholaminergic cells (PC12) exposed to manganese, which is responsible for an occupational form of Parkinson-like disease. The nanoparticle internalization has been followed by Raman and confocal microscopy while the effect of nanoceria concentration in the cell metabolism has been assessed by MTT and trypan blue assay. With the perspective to develop an innovative combined treatment, nanoceria has been tested either alone or in association with L-DOPA showing a significant effect in reducing the oxidative stress due to manganese chloride. Finally, to study the protective role of nanoceria on the metabolism of catecholamines, the intracellular concentration of dopamine and its metabolites have been monitored by liquid chromatography with electro-chemical detection in control and nanoparticle-exposed cells as a function of the nanoceria dosing. The results show a protective role of nanoceria both on PC12 cells survival and dopamine metabolism, which makes this class of nanoparticles a potential candidate for the treatment of Parkinson-like diseases induced by chronic manganese intoxication.
1. Introduction

Parkinson like disease (PLD) symptoms are produced by severe neurodegenerative processes caused by the interplay of a number of factors, such as environmental or genetic risk, age, mitochondrial dysfunction and other conditions leading to a reactive oxygen species (ROS) overproduction.1 Among the different causes, oxidative stress has been widely believed to be an important pathogenetic mechanism of neuronal death in the disease, although it is still not clear whether it is an initial event causing cell death or a consequence of the disease. The causes of the oxidative stress can be found in a large variety of sources and, in some cases, the presence of PLD symptoms can be correlated with the exposure to transition metals such as copper, lead and manganese.2 In particular, chronic manganese intoxication in humans is responsible for early psychotic disorder that is later followed by permanent degenerative damage in the nigrostriatal system, resulting in a PLD. It is well known that manganese may stimulate dopamine (DA) autoxidation in the dopaminergic neuron, resulting in an increase of the quinones levels. The generated quinones are thought to mediate toxicity by covalently binding to nucleophilic groups of biological macromolecules.3

In virtue of the multiplicity of its oxidation states (commonly +2, +3, +4, +6 and +7), manganese shows a wide range of chemical interactions which becomes even more complex in a biological environment. This means that Mn can mimic other ions and enter into the brain through different carriers. As well as damage to the dopaminergic system, Mn induces mitochondrial dysfunction, impairment of cellular energy metabolism, glial activation, neuroinflammation and deep changes in synaptic transmission and astrocytes-neurons cross-talk;4 all these factors contribute to the onset of the PLD.

The administration of L-3,4-dihydroxyphenylalanine (L-DOPA), the natural precursor of dopamine in catecholaminergic neurons, is the most widely used treatment for PD-like syndrome; the alleviation of the symptoms related to the disease are due to a replenishment of DA in the surviving neurons. However, although many of the symptoms of PLD can be relieved, the therapy is not curative and dopaminergic cells continue to die in patients receiving L-DOPA. In fact L-DOPA can undergo autoxidation and enzymatic oxidation, generating a variety of cytotoxic ROS, including superoxide, hydrogen peroxide, semiquinones, and quinones5,6 which may further load the preexisting condition of oxidative stress. Since L-DOPA induces oxidative stress-mediated apoptosis in cultured neuronal cells, the inappropriate L-DOPA-induced activation of apoptosis might have a role in neuronal death in PLD syndrome.7

In the last years, cerium oxide (CeO2) gained increasing interest for its capability of neutralizing and reducing ROS; this property is related to the presence of oxygen vacancies on the CeO2 surface, which allows Ce ions to flip-flop between two oxidation states.8 When ROS interact with CeO2 surface, the Ce3+ ions are oxidized to Ce4+ neutralizing the radicals; afterwards, Ce4+ centers reduce again their oxidation state to Ce3+ by reaction with H+.9,10 Since the antioxidant process is strictly correlated to the surface property, this effect becomes of extreme relevance when cerium oxide is used in form of nanosized particles, also called nanoceria.11,12,13 When nanoceria is used in a biological environment, such as in cell cultures or animal models, the nanoparticles act as radical scavengers mimicking the role of superoxide dismutase and catalase.

Compared to organic exogenous antioxidants, which are limited by chemical instability,14 nanoceria shows the major advantage of an auto-regenerative process.15 In fact, the switching of cerium oxidation states allows restoring the radical scavenging properties without continuously dosing the drug, as in the case of organic exogenous antioxidants. In addition, antioxidant processes triggered by nanoceria provide an effective protection not only against ROS, but also towards other reactive molecules, such as nitrogen-based species (RNS)16 enabling a simultaneous quenching of dangerous metabolic byproducts.

In this work, nanoceria has been tested as an adjuvant drug in the treatment of PLD syndrome which is an ideal model to test the nanoceria properties applied to neurodegenerative syndromes. The protective effects of nanoceria on manganese- and L-DOPA-induced cytotoxicity have been evaluated in nerve pheochromocytoma cell line, PC12 cells. This cell line exhibits several physiological properties which are characteristic of dopaminergic neurons and therefore it is a good system for the study of oxidative stress in dopamine-containing cells.

2. Materials and methods

2.1. Materials

Cerium(III) nitrate hexahydrate (Ce(NO3)3·6H2O, ABCR 99.9%), urea (CH4N2O, Aldrich 99%), 2-propanol (99.7%, Carlo Erba), 1 M hydrochloric acid (HCl, Aldrich), 5 M aqueous ammonia (NH4OH, Aldrich), 3-aminopropyltriethoxysilane (APTES, NH2(CH2)3Si(OC2H5)3, 99%, Aldrich), fluorescein isothiocyanate isomer I (FITC, C21H11NO5S, 90%, Aldrich), ethanol (EtOH, Fluka 99.8%), acetone (Aldrich 99.5%) and N,N-dimethylformamide (DMF, C3H7NO, Aldrich) were used as received without further purification.

Dulbecco's modified Eagle's medium (DMEM/F-12, HEPES, no phenol red), horse and fetal bovine (FBS) serum were purchased from Life Technologies, L-3,4,dihydroxyphenylalanine (L-DOPA, 98%) from Sigma-Aldrich (Milan, Italy) and manganese chloride (MnCl2) from Merck (Darmstadt, Germany).

3-(4,5-Dimethyl-thiazol-2-yl)-2,5,diphenyltetrazolium bromide for MTT assay (97.5%), phosphate buffer saline solution (PBS, 0.2 μm filtered), trypan blue (0.4%), gelatin, 4,6-diamidino-2-phenylindole dihydrochloride (DAPI, 98%), 0.5 M citric acid (99.5%), 1.0 M sodium acetate (NaAc, 99%), 12.5 mM ethylenediaminetetraacetic acid (EDTA, 98.5%), methanol 10% (MeOH, 99.93%), sodium octylsulphate (CH3(CH2)7OSO3Na, pH 3.0, 95%), annexin V-fluorescein isothiocyanate (FITC) propidium iodide (PI), annexine V-FITC kit (MACS Mylteny Biotec), and trypan blue 0.4% were purchased from Sigma Aldrich.

2.2. Methods

2.2.1. Synthesis of nanoceria. Urea was used as coordinating agent, NH4OH and Ce(NO3)3 as inorganic precursors. 7 × 10³ mg of Ce(NO3)3·6H2O were dissolved in 20 ml of 2-propanol, then 0.5 ml of hydrochloric acid were added to it and left under stirring until a homogeneous solution was obtained. In a separate vial, 2 × 10³ mg of urea and 0.5 ml of HCl were dissolved in 20 ml of 2-propanol and left under stirring for 5 min. The urea solution was then added, dropwise, to the Ce(NO3)3 solution under stirring, and soon after 14 ml of NH4OH(aq.) were added to the mixture to form a precipitate that was exposed to microwaves (4 times at 600 W for 10 s), washed with water and centrifuged at 10[thin space (1/6-em)]000 rpm. A light yellow milky dispersion was obtained that was then diluted with water to reach a concentration of 56 mg CeO2 per ml (nanoceria stock suspension).
2.2.2. Functionalization of ceria nanoparticles with fluorescein isothiocyanate (FITC). Nanoceria was firstly functionalized with 3-aminopropyltriethoxysilane by mixing 200 mg of nanoceria with 3 ml of APTES and 50 ml of EtOH at room temperature under stirring. The amino-functionalized nanoceria (NH2-nanoceria) was washed with EtOH and centrifuged at 10[thin space (1/6-em)]000 rpm. 4 mg of nanoceria were then re-suspended in 0.5 ml of DMF, mixed with 0.5 ml of 2 mg ml−1 FITC in DMF and stirred at room temperature for 4 h. The FITC–NH2 nanoceria were washed once with acetone and twice with water and centrifuged at 10[thin space (1/6-em)]000 rpm. The orange precipitate was diluted with water to reach a concentration of 22 mg ml−1 (FITC–NH2-nanoceria).
2.2.3. Nanoparticles characterization. A Vertex 70 Bruker spectrophotometer in the 400–4000 cm−1 range, with a resolution of 4 cm−1 was used for Fourier transform infrared (FTIR) spectroscopy. Nanoceria, NH2-nanoceria and FITC–NH2-nanoceria solutions were casted onto a silicon wafer and then measured in transmission; bare silicon was used as a background reference. The FTIR spectra were analyzed in the 3700–400 cm−1 region; the baseline was corrected using a concave rubberband function with OPUS 7 software.

X-ray diffraction (XRD) pattern of CeO2 nanoparticles was collected by a Bruker D8 “Discover” in grazing incidence geometry with a Cu Kα line (λ = 1.54056 Å); the X-ray generator worked at a power of 40 kV and 40 mA. The patterns were recorded in 2θ mode ranging from 20 to 80° with a step size of 0.02° and a scan speed of 0.5 s until an optimal signal-to-noise ratio was achieved. The average crystallite size D was calculated from the broadening of the X-ray line (1 1 1) using Scherrer's equation17 and EVA program.

Transmission electron microscopy (TEM) images were obtained by using a Hitachi H-70000 microscope equipped with a tungsten cathode operating at 125 kV. For sample measurements, few drops of nanoceria were cast on a carbon coated copper grid and dried for observations.

2.2.4. Cell culture and viability assay. PC12 cells (ATCC CRL-1721), derived from a transplantable rat pheochromocytoma, are a valuable model for neuronal differentiation, mimicking any features of central dopaminergic neurons including dopamine production.18

PC12 cells were maintained at 37 °C in 60 mm plastic culture plates in an atmosphere of 5% CO2/95% humidified air. The formulation of the culture medium was prepared as follows: Dulbecco's modified Eagle's medium (DMEM) – F12 supplemented with 10% horse serum and 5% fetal bovine serum.

For viability testing PC12 cells were exposed or not exposed (control) for 48 hours to different concentrations of ceria nanoparticles (5–5000 μg ml−1) in 24-well plates (105 cells per well).

To evaluate ceria neuroprotective effect, PC12 cells were pretreated for 24 h with 10, 20 and 50 μg ml−1 of ceria and then MnCl2 and/or L-DOPA were added at the concentration of 750 μM and 20 μM respectively for further 24 h. All experiments were done in triplicate. Cell viability was then assessed by the 3-(4,5-dimethyl-thiazol-2-yl)-2,5,diphenyltetrazolium bromide (MTT) assay. In this assay, viable cells convert the soluble dye MTT to insoluble (in aqueous media) blue formazan crystals. In details, 200 μl of MTT [5 mg ml−1 stock solution in phosphate buffered saline (PBS)] was added to 1 ml of medium and incubated at 37 °C for 4 h. The MTT was removed and the cells rinsed with PBS and centrifuged at 4000 rpm for 20 min. The resulting pellet was dissolved in 2 ml of isopropanol and centrifuged at 4000 rpm for 5 min. Finally the supernatant color was read at 600 nm using a Bauty Diagnostic Microplate Reader. A calibration standard curve was achieved before each experiment using different cells concentration.

2.2.5. PC12 apoptosis assessment. PC12 cells were seeded in a 24-well plate, pretreated for 24 h with 10, 20, 50 and 100 μg ml−1 of ceria, at concentration of 1.2 × 10⁵ cells per well and cultured overnight. Then MnCl2 (750 μM) and/or L-DOPA (20 μM) were added to cells and incubated for further 24 h. After incubation the cells were washed with annexin binding buffer. Cell apoptosis was assessed using annexin V-fluorescein isothiocyanate (FITC) apoptosis detection kit (BD Biosciences, San Diego, USA). Cells were incubated with FITC-labeled annexin V and propidium iodide (PI) for 15 minutes in dark at room temperature (20–25 °C). The cell percentage showing annexin V+/PI− and annexin V+/PI+ was used to evaluate apoptotic cells by a FACS Calibur with Cell Quest 6.0 software (BD Bioscience); 10[thin space (1/6-em)]000 events were collected for each experiment.
2.2.6. Evaluation of ceria uptake into PC12 cells. PC12 cells were exposed or not exposed (control) for 48 hours to different concentrations of FITC–NH2-nanoceria (20–50–100 μg ml−1) in 24-well plates (1.2 × 10⁵ cells per well). After incubation, the cells were washed 3 times with PBS and resuspended in Dulbecco's modified Eagle's medium containing 0.25% w/w of trypan blue.

The uptake of FITC–NH2-nanoceria into PC12 cells was evaluated by FACS Calibur flow cytometer (Becton Dickinson, FACScalibur™, USA) and Raman spectroscopy. The side scatter data obtained by flow cytometry were analyzed using CELL Quest 6.0 software (BD Bioscience).19

For Raman analysis PC12 cells were seeded on gelatin (1 mg ml−1 in sterile milliQ water) coated glass coverslips at 105 cells per ml and cultured overnight. Then cells were treated with ceria nanoparticles (40 μg ml−1) for another 24 h. After that, cells were rinsed two times with PBS and glass coverslips were placed and sealed on a microscope slide. The intracellular localization was detected by a Bruker Senterra confocal Raman microscope (50× magnification for optical images) working with a laser excitation wavelength of 532 nm at 12 mW of nominal power. Raman imaging maps were obtained by selecting the 50× objective, and an defining an array of 598 points in order to cover an area of 25 × 22 μm with a step of 1.0 μm. Each spectrum of the map was recorded by averaging 10 acquisitions of 3 s.

2.2.7. Confocal microscopy. PC12 cells were seeded on gelatin (1 mg ml−1 in sterile milliQ water) coated glass coverslips at 105 cells per ml and cultured overnight. Then, the cells were treated with FITC–NH2 nanoceria (10 or 20 μg ml−1) for another 24 h. Afterwards, the cells were rinsed two times with PBS and stained with DAPI (5 μg ml−1 in PBS) for 15 minutes, protecting them from light. Cells were then rinsed one time with PBS and sealed on microscope slides.

Samples were observed with a Leica Microscope, equipped with a Leica Confocal Laser System C2s. The images were analyses by Leica Application Suite Advance Fluorescence Lite (LAS AF) program.

2.2.8. Chromatographic analysis. High performance liquid chromatography with electro-chemical detection (HPLC-EC) was used to quantify DA, dihydroxyphenylacetic acid (DOPAC), homovanillic acid (HVA), 3-methoxytyramine (3-MT) using an Alltech 426 HPLC pump equipped with a Rheodyne injector, column 15 cm 64.6 mm i.d. Alltech Adsorbsphere C18 5U, electrochemical detector Antec CU-04-AZ and Varian Star Chromatographic Workstation. Citric acid 0.5 M, Na acetate 1.0 M, EDTA 12.5 mM, MeOH 10% and sodium octylsulphate 650 mg l71 (pH 3.0) was the mobile phase; the flow rate was 1 × 3 ml min−1.20
2.2.9. Statistical analysis. All in vitro data derive from at least three independent experiments and results are expressed as mean values with 95% confidence intervals. The statistical significance of differential findings between experimental and control groups was estimated by paired or unpaired t-test in Graph-Pad Prism 5.0 software (GraphPad Software, Inc, San Diego, CA, USA). These findings were considered significant if two-tailed P values were <0.05.

3. Results and discussion

3.1. Nanoceria characterization and functionalization

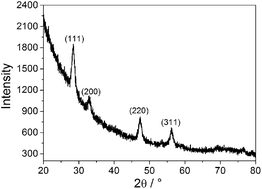
Nanoceria has been synthesized by a microwave treatment, a process that allows for a fast fabrication of well-dispersed nanoparticles in water without using thermal annealing.21 After synthesis, the nanoparticles (NPs) have been characterized by XRD and TEM to correlate their chemical–physical features with the functional properties. The XRD pattern in the 20°–80° 2θ angular range (Fig. 1) has been indexed according to the cubic fluorite structure of cerianite (JCPDS: 34-0394). The crystal size of nanoparticle, calculated by Schererr's equation, is around 9 ± 1 nm. The size is in accordance with nanoparticle diameter as measured by bright field TEM characterization (8.5 ± 1.3 nm) suggesting that the nanoparticles are formed by single crystals. (see ESI, Fig. S1).
image file: c4ra16265j-f1.tif
Fig. 1 XRD pattern in the 20–80° 2θ range of ceria nanoparticles synthesized by microwave treatment. The peaks have been indexed according to the cerianite structure.

Infrared spectroscopy has been used to characterize the functionalization of ceria NPs with the fluorophore FITC. Fig. 2a shows the spectrum of pure NPs in the 3700–400 cm−1 range; the broad band peaked at 3450 cm−1 is assigned to the symmetric stretching of the hydroxyl group on the nanoparticle surface22 while the band at 1600 cm−1 is due to residual water. The bands below 1460 cm−1 (1465, 1319 and 1045 cm−1 respectively) have been attributed to the formation of CO32− on the particle surface as a consequence of the interaction between CeO2 and atmospheric CO2.23 Remarkably, the presence of these bands is strongly reduced if the particles are kept in solution.


image file: c4ra16265j-f2.tif
Fig. 2 FTIR absorption spectra in the 3700–400 cm−1 range: (a) nanoceria (black line); (b) nanoceria functionalized with APTES (red line); (c) FITC (blue line) and (d) nanoceria functionalized with APTES and FITC (green line).

Functionalization with FITC has been obtained through chemical modification of the NPs surface with an organosilane linker (aminopropyl trimethoxysilane, APTES) containing a –NH2 terminal group. Fig. 2b shows the change induced in the infrared spectra by the successful APTES modification. The broad band peaked at 3450 cm−1 decreases in absorbance, in accordance to the reduced amount of hydroxyls available on the NPs surface, while the introduction of aminosilane groups is confirmed by the appearance of three bands: the first one, at 1556 cm−1, attributed to NH bending of the amide bond; the second one, peaked at 2966 cm−1, due to CH3 stretching mode and the third one, at 2932 cm−1, related to CH2 stretching. The broad band at 952 cm−1 has been assigned to the Ce–O–Si stretching vibration as a consequence of the covalent bond between APTES and nanoceria.24 Fig. 2d shows the spectrum of the NH2 modified nanoceria after functionalization with FITC. By comparing the spectrum of the pure fluorophore, Fig. 2c, with that one of the FITC-functionalized nanoparticles, we observe the disappearance of the band relative to the isothiocyanate group N[double bond, length as m-dash]C[double bond, length as m-dash]S (at 2069 cm−1) as a result of the coupling with the amine. A comparison between the spectra of Fig. 2d and c allows highlighting an increase of the CH2 stretching band at 2930 cm−1 attributed to the fluorescent molecule linked to the ceria NPS.24

3.2. Evaluation of nanoceria uptake and toxicity in PC12 cells

To assess the toxicity of nanoceria, PC12 cells have been exposed to increasing concentrations of nanoparticles (from 0 to 5000 μg ml−1) and their viability has been assessed by MTT assay. Fig. 3 shows that nanoceria has not affected cells viability when administered in concentrations from 5 to 100 μg ml−1 but starts to become toxic at concentrations higher than 100 μg ml−1. This results in a statistically significant reduction (p < 0.05) of cell viability which gradually decreases in comparison with controls from 75%, at a concentration of 500 μg ml−1, down to 57% at a concentration of 4000 μg ml−1.
image file: c4ra16265j-f3.tif
Fig. 3 The effect of nanoceria (5–5000 μg ml−1) on viability of PC12 for 48 h by MTT assay. § = p < 0.05 versus control group.

MTT assay has allowed evaluating the maximum concentration of nanoparticles that does not induce cellular toxicity. According to these results, a range between 20 and 100 μg ml−1 has been chosen to evaluate the NPs antioxidant effect by apoptosis assay on a cell culture previously exposed to an oxidative insult.

MnCl2 at a concentration of 750 μM has been selected as the oxidant agent to simulate the degenerative processes occurring in PDL syndrome caused by chronic manganese intoxication. Fig. 4 shows a representative flow cytometry profile PI/annexinV performed on cell cultures treated with CeO2 and MnCl2. The oxidative insult causes a 27.7% cell apoptosis (Fig. 4b) with respect not-treated cells (Fig. 4a). However, if cells previously treated with 20 μg ml−1 of nanoceria, the apoptotic cell percentage dramatically drops to 3.8% (Fig. 4d). Fig. 4c shows the effect of nanoceria administration compared to the control; the data show no significant variations in the cell apoptosis, in accordance to the MTT assay and previous studies.25 The experiments have been reproduced in triplicate as a function of the NPs concentration and the averaged results have been reported in a bar plot (Fig. 4e). MnCl2 causes 28 ± 3.5% of apoptosis, while the injury decreases in the cells pre-treated with nanoceria; the PC12 cultures treated with 10, 20, 50 and 100 μg ml−1 of CeO2, in fact, show a percentage in apoptosis of 3% ± 0.5, 4.5% ± 0.5, 2.8% ± 0.5 and 3% ± 0.4, respectively. The addition of L-DOPA to the treatment groups does not cause significant changes in the percentages of cell apoptosis (data not shown).


image file: c4ra16265j-f4.tif
Fig. 4 Flow cytometry profile PI/annexinV performed on PC12 cell culture. (a) PC12 control cells. (b) PC12 cells treated with MnCl2. (c) PC12 cells treated with nanoceria in a concentration of 20 μg ml−1 and with MnCl2 insult. (d) PC12 cells treated with nanoceria. (e) Average results of apoptotic PC12 cells treated with different concentration of nanoceria and exposed to MnCl2 insult. Asterisks indicate statistically significant differences between CeO2-treated PC12 cells vs. MnCl2 CTRL (p < 0.01).

Flow cytometry with fluorescent nanoceria has been used to assess whether the CeO2 antioxidant effect occurred indirectly, through ROS quenching in the extracellular environment, or directly, as a consequence of intracellular uptake. Fig. 5 shows the fluorescence intensity of the cells as a function of the nanoceria concentration; the median fluorescence intensity (MFI) increases from 9.97 to 137.16 a.u. with the increase of NPs concentration from 20 μg ml−1 up to 100 μg ml−1. The cell cultures have been treated with trypan blue before cytometry, so that the fluorescence signal can be univocally attributed to NPs inside the cells. A higher nanoceria concentration causes an increase in the median fluorescence intensity of the cells; this indicates that there is an almost linear correlation between the amount of NPs incubated with the PC12 cultures and the number of nanoparticles uptaken by the cells.


image file: c4ra16265j-f5.tif
Fig. 5 Median fluorescence intensity (MFI) histogram of the cells as a function of the nanoceria concentration.

PC12 cells, fixed on a glass with a gelatin from bovine skin, have been analyzed by Raman imaging to confirm the ceria uptake (Fig. 6a). The image in false color scale has been obtained by sampling the area shown in Fig. 6b with a Raman microscope and integrating the band peaked at 465 cm−1, which is the main absorption band of nanoceria in water Fig. 6c.26 Fig. 6d shows the difference in the Raman spectrum when the microscope is sampling an area containing nanoceria (black line), in comparison with the extracellular area, where no particles are detected (red line). The imaging clearly shows the presence of cerium oxide inside the cell due to nanoparticles uptake while no signals attributed to nanoceria are visible in the extracellular environment.


image file: c4ra16265j-f6.tif
Fig. 6 Raman imaging of PC12 cells incubated with nanoceria. (a) Raman spectra in the 1300–200 cm−1 range of extracellular environment (red line) and cellular environment (black line); (b) optical image of single PC12 cell; (c) Raman spectrum in the 1300–200 cm−1 of ceria NPs in water solution and (d) Raman image obtained by integrating the active mode of cerium oxide at 465 cm−1. The integrated intensity is reported in false color scale.

Confocal microscopy has also confirmed the internalization of cerium oxide NPs into PC12 cells Fig. 7. After 24 h of incubation with 20 μg ml−1 of FITC-nanoceria, the highly fluorescent green spots inside the cytoplasm cells prove the successful internalization. Z-stack and 3D rendering have confirmed that the NPs are effectively inside the cells and not on the cell surface (see Movie) while no evidence of NPs in the cell nuclei has been observed.


image file: c4ra16265j-f7.tif
Fig. 7 3D rendering through side projections of confocal Z-stack confirming ceria nanoparticles (green spots) internalization in PC12, as highlighted in the 4× zoom crop.

3.3. Effect of nanoceria against MnCl2 and MnCl2 + L-DOPA oxidative stress

The most common treatment of PLD syndromes is the administration of L-DOPA, which is the natural precursor of dopamine, however the auto- and enzymatic oxidation of this compound contributes to further increase of the oxidative stress in the cells. We have decided, therefore, to test the effect of administration of nanoceria on PC12 cells previously exposed to oxidative stress induced by MnCl2 and potentiated by L-DOPA. The cell viability has been measured both by MTT and trypan blue assay to cross correlate the results obtained by the two techniques (Fig. 8). After the MnCl2 insult, the viability is 55% and 65% compared to control, as shown by MTT and TB assays, respectively. The difference in these two values can be justified by considering the different outputs of the techniques; MTT measures, in fact, the mitochondrial dehydrogenase activity while the TB assay allows direct staining of the dead cells. A live cell with reduced dehydrogenase activity, therefore, is accounted as “healthy cell” by TB assay although providing a lower contribution in the cell viability as assessed by MTT.
image file: c4ra16265j-f8.tif
Fig. 8 The effect of nanoceria on viability of cells treated with MnCl2 (0.75 mM) and MnCl2 + L-DOPA (0.75 mM + 0.02 mM) evaluated by MTT and trypan blue (TB) assays. Several concentrations of ceria nanoparticles have been used and the statistically significant relative protection has been calculated against MnCl2 alone (* = p < 0.05) and MnCl2 + L-DOPA (# = p < 0.05).

When PC12 cells are pre-treated with increasing amounts of nanoceria, their viability after the MnCl2 injury results enhanced. In particular, the cell viability raises of 15% with respect to the control after pretreatment with 10 and 20 μg ml−1 of cerium oxide NPs (p < 0.05).

The simultaneous administration of MnCl2 and L-DOPA shows a cell viability slightly lower but not statistically different from MnCl2 alone (60% of control) while nanoceria pre-treatement gives a relative protection. However, the range of protective concentrations of ceria is lower during MnCl2 exposure (10–20 μg ml−1) than MnCl2 + L-DOPA (20–50 μg ml−1). Although the ceria-related increase in cell viability is around 10%, both the assays (MTT and TP) give a similar value, indicating that the both cell activity and viability are statistically enhanced (p < 0.05).

To evaluate the dopamine (DA) concentration in untreated and nanoceria-treated PC12 cells, we have measured its intracellular concentration and that of its metabolites dihydroxyphenylacetic acid (DOPAC), 3-methoxytyramine (3-MT) and homovanillic acid (HVA) by high performance liquid chromatography with electro-chemical detection. Fig. 9 shows the changes of the intracellular DA and metabolites content after treatments with nanoceria (20 μg ml−1), L-DOPA (0.02 mM), MnCl2 (750 μM) and their combinations. Remarkably, the treatment with ceria does not cause any change in the intracellular amount of neurochemicals. On the contrary, the MnCl2 insult causes a strong decrease of the neurochemical catabolities which is around 60%, 73% and 68% for DA, DOPAC and 3-MT, respectively. The HVA content appears almost constant, suggesting a strong resistance towards oxidation; an explanation of these responses can be provided considering the oxy-methylation reaction of the molecule. On the contrary, another oxy-methylated molecule (3-MT) showed a significant decrease after MnCl2 exposure; this behavior could be in relationship with the increased auto-oxidation of its metabolic precursor (DA). Similar decrease in DA, DOPAC and 3-MT concentrations has been also observed when MnCl2 is used in association with L-DOPA.


image file: c4ra16265j-f9.tif
Fig. 9 Effects of nanoceria on manganese- and L-DOPA-induced changes in DA, 3-MT, HVA and DOPAC concentrations in PC12 tissue after 48 h exposure. Results are the means ± SEM of three experiments performed in triplicate. # p < 0.05 versus MnCl2 group, * p < 0.05 versus control group.

The co-treatment of MnCl2 with nanoceria induces a significant protection on DA content, resulting in a 29% decrease with respect to the control value, while the DOPAC and 3-MT contents decrease. The protection of nanoceria against oxidation is still present but less pronounced when is used in association L-DOPA; in fact, the simultaneous treatment with MnCl2 + nanoceria + L-DOPA causes a loss in DA, DOPAC and 3-MT content of 41%, 69% and 76%, respectively.

The results have shown that the use of nanoceria to neutralize ROS in PLD oxidative processes enhances the therapeutic effects of L-DOPA delaying neuronal cell degeneration. Although the antioxidant properties of nanoceria are not significantly influenced by the pH,27 its role largely depends on the dimension and concentration. These parameters have to be carefully controlled to achieve protective effects. In fact, nanoceria at concentration of 20 μg ml−1 has a high protective action towards oxidative stress caused by Mn2+ ions and auto-oxidation of L-DOPA, while, at concentration higher than 100 μg ml−1, the cell viability is compromised. On the other hand, previous studies have shown the importance of controlling the nanoceria dimension; in fact, particles larger than 10 nm exhibit a lower antioxidant activity and enhanced photocatalytic properties.28 This is the reason why we have carefully kept the nanoparticle dimension below this critical size.

Understanding nanoceria uptake mechanism is also of paramount importance, for this reason we have used two different techniques to observe the nanoparticles within the cellular environment. At the optimized nanoceria concentration, the nanoparticles result efficiently internalized in the cytoplasm of PC12 cells. However no evidence of nanoparticles uptake in the cell nuclei has been observed, avoiding potential damaging of the DNA.

Interestingly, the results of flow cytometry indicate that nanoceria itself is likely able of reducing the natural apoptosis ratio of the untreated cells; in fact the nanoceria pre-treated cells insulted by MnCl2 show an even lower percentage apoptosis than the control. On the other hand, it is also remarkable that L-DOPA does not protect the cells against the same oxidative insult. This fact is not surprising, indeed in a previous study3 we observed that the L-DOPA enhances the pro-oxidative effect of manganese and an antioxidant (N-acetyl-cysteine) is only able to partially revert its negative effects on PC12 cells. A similar enhancement of the pro-oxidative process has been also observed in vivo, in particular in the striatum of freely-moving rats treated with manganese and L-DOPA.29 This observation has important implications about the role of nanoceria during L-DOPA treatment; in fact, the protective effect of nanoceria on MnCl2 + L-DOPA-exposed cells confirms that the auto-oxidation of L-DOPA enhances the Mn-related oxidative stress.3

4. Conclusions

The present work shows that ceria nanoparticles are effective for the treatment of neurodegenerative Parkinson-like diseases induced by chronic manganese intoxication. For the first time the antioxidant capability of nanoceria has been tested in PC12 cells by using MnCl2 instead of H2O2. The protective role of nanoceria depends on nanoparticles size and concentration and affects both the cells viability and metabolism; a nanoceria concentration of 20 μg ml−1 provides the highest antioxidant effect on cell cultures pre-treated with MnCl2, however to reach the maximum antioxidant effect in PC12 cells the nanoceria dimension and the concentration should be kept under 10 nm and 100 μg ml−1, respectively. Nanoceria is also able to reduce the oxidative stress caused by auto-oxidation in a simultaneous treatment with L-DOPA, envisaging an innovative therapeutic application. Further studies are ongoing for a better understanding of the CeO2 antioxidant biochemical mechanisms in the intracellular environment and a further in vivo investigation is necessary for exploring the potential role of these nanoparticles in the treatment of Parkinson like diseases.

Acknowledgements

M. F. Casula, D. Loche are acknowledged for TEM characterization of the nanoparticles. A. Pinna acknowledges INSTM for financial support.

References

  1. P. M. A. Antony, N. J. Diederich, R. Kruger and R. Balling, FEBS J., 2013, 280, 5981–5993 CrossRef CAS PubMed.
  2. A. W. Willis, B. A. Evanoff, M. Lian, A. Galarza, A. Wegrzyn, M. Schootman and B. A. Racette, Am. J. Epidemiol., 2010, 172, 1357–1363 CrossRef PubMed.
  3. R. Migheli, C. Godani, L. Sciola, M. R. Delogu, P. A. Serra, D. Zangani, G. De Natale, E. Miele and M. S. Desole, J. Neurochem., 1999, 73, 1155–1163 CrossRef CAS.
  4. M. Aschner, K. M. Erikson, E. Herrero Hernández and R. Tjalkens, NeuroMol. Med., 2009, 11, 252–266 CrossRef CAS PubMed.
  5. J. J. Lee, Y. M. Kim, S. Y. Yin, H. D. Park, M. H. Kang, J. T. Hong and M. K. Lee, Biochem. Pharmacol., 2003, 66, 1787–1795 CrossRef CAS.
  6. A. N. Basma, E. J. Morris, W. J. Nicklas and H. M. Geller, J. Neurochem., 1995, 64, 825–832 CrossRef CAS.
  7. M. Y. Lee, E. J. Choi, M. K. Lee and J. J. Lee, Nutr. Res. Pract., 2013, 7, 249–255 CrossRef CAS PubMed.
  8. B. M. Reddy and A. Khan, Catal. Surv. Asia, 2005, 9, 155–171 CrossRef CAS PubMed.
  9. M. Dasa, S. Patilb, N. Bhargava, J. F. Kanga, L. M. Riedela, S. Sealb and J. J. Hickmana, Biomaterials, 2007, 28, 1918–1925 CrossRef PubMed.
  10. I. Celardo, J. Z. Pedersen, E. Traversa and L. Ghibelli, Nanoscale, 2011, 3, 1–10 RSC.
  11. F. Esch, S. Fabris, L. Zhou, T. Montini, C. Africh, P. Fornasiero, G. Comelli and R. Rosei, Science, 2005, 309, 752–755 CrossRef CAS PubMed.
  12. A. Pinna, C. Figus, B. Lasio, M. Piccinini, L. Malfatti and P. Innocenzi, ACS Appl. Mater. Interfaces, 2012, 4, 3916–3922 CAS.
  13. A. Pinna, B. Lasio, M. Piccinini, B. Marmiroli, H. Amenitsch, P. Falcaro, Y. Tokudome, L. Malfatti and P. Innocenzi, ACS Appl. Mater. Interfaces, 2013, 5, 3168–3175 CAS.
  14. M. Stevanovíc, J. Savíc, Br. Jordovíc and D. Uskokovíc, Colloids Surf., B, 2007, 59, 215–223 CrossRef PubMed.
  15. L. Yang, G. Sundaresan, M. Sun, P. Jose, D. Hoffman, P. R. McDonagh, N. Lamichhane, C. S. Cutler, J. M. Perezc and J. Zweit, J. Mater. Chem. B, 2013, 1, 1421–1431 RSC.
  16. J. M. Dowding, T. Dosani, A. Kumar, S. Seal and W. T. Self, Chem. Commun., 2012, 48, 4896–4898 RSC.
  17. (a) A. A. Athawale, M. S. Bapat and P. A. Desai, J. Alloys Compd., 2009, 484, 211–217 CrossRef CAS PubMed; (b) S. Samiee and E. K. Goharshadi, Mater. Res. Bull., 2012, 47, 1089–1095 CrossRef CAS PubMed.
  18. G. Ciofani, G. Genchi, I. Liakos, V. Cappello, M. Gemmi, A. Athanassiou, B. Mazzolai and V. Mattoli, Pharm. Res., 2013, 30, 2133–2145 CrossRef CAS PubMed.
  19. H. Suzuki, T. Toyooka and Y. Ibuki, Environ. Sci. Technol., 2007, 41, 3018–3024 CrossRef CAS.
  20. P. A. Serra, G. Rocchitta, G. Esposito, M. R. Delogu, R. Migheli, E. Miele, M. S. Desole and M. Miele, Br. J. Pharmacol., 2001, 134, 275–282 CrossRef CAS PubMed.
  21. S. Samiee and E. K. Goharshadi, Mater. Res. Bull., 2012, 47, 1089–1095 CrossRef CAS PubMed.
  22. M. S. Lord, M. S. Jung, W. Y. Teoh, C. Gunawan, J. A. Vassie, R. Amal and J. M. Whitelock, Biomaterials, 2012, 33, 7915–7924 CrossRef CAS PubMed.
  23. M. I. Zaki, G. A. M. Hussein, S. A. A. Mansour and H. A. El-Ammawy, J. Mol. Catal., 1989, 51, 209–220 CrossRef CAS.
  24. Z. Zhang, L. Yu, W. Liu and Z. Song, Appl. Surf. Sci., 2010, 256, 3856–3861 CrossRef CAS PubMed.
  25. S. Chen, Y. Hou, G. Cheng, C. Zhang, S. Wang and J. Zhang, Biol. Trace Elem. Res., 2013, 154, 156–166 CrossRef CAS PubMed.
  26. G. Wang, Q. Mu, T. Chen and Y. J. Wang, J. Alloys Compd., 2010, 493, 202–207 CrossRef CAS PubMed.
  27. S. Singh, T. Dosani, A. S. Karakoti, A. Kumar, S. Seal and W. T. Self, Biomaterials, 2011, 32, 6745–6753 CrossRef CAS PubMed.
  28. N. Singh, C. A. Cohen and B. A. Rzigalinski, Ann. N. Y. Acad. Sci., 2007, 1122, 219–230 CrossRef CAS PubMed.
  29. P. A. Serra, G. Esposito, P. Enrico, M. A. Mura, R. Migheli, M. R. Delogu, M. Miele, M. S. Desole, G. Grella and E. Miele, Br. J. Pharmacol., 2000, 130, 937–945 CrossRef CAS PubMed.

Footnote

Electronic supplementary information (ESI) available. See DOI: 10.1039/c4ra16265j

This journal is © The Royal Society of Chemistry 2015
Click here to see how this site uses Cookies. View our privacy policy here.