Tianle Zhou*a,
Shijo Nagaob,
Tohru Sugaharab,
Hirotaka Kogab,
Masaya Nogib,
Katsuaki Suganumab,
Thi Thi Ngec and
Yuta Nishinad
aSchool of Materials Science and Engineering, Nanjing University of Science and Technology, Nanjing 210094, China. E-mail: ztltianle999@hotmail.com; Tel: +86-025-52748295
bThe Institute of Scientific and Industrial Research, Osaka University, Mihogaoka 8-1, Ibaraki, Osaka 567-0047, Japan
cWood Chemistry Laboratory, Department of Biomass Chemistry, Forestry and Forest Products Research Institute, 1 Matsunosato, Tsukuba, Ibaraki 305-8687, Japan
dResearch Core for Interdisciplinary Science, Okayama University, Tsushimanaka, Kita-ku, Okayama 700-8530, Japan
First published on 3rd February 2015
Multi-layer graphene oxide (MGO) has attracted considerable interest in conductive polymer composites. However, in most cases the optimal MGO content is determined using a complex procedure. Avoiding the complicated work of processing polymerized samples followed by testing various properties, here a facile strategy is proposed to directly identify the critical MGO content among formulations for epoxy composites with optimal thermal properties, simply by monitoring the “unusual” nonlinear MGO content-dependent cure behaviors, as well as the “unusual” pattern of double-peak curing curves. The formation mechanism of the double-peak pattern was explored, with emphasis on studying the epoxy/MGO reaction using a modified Shrinking Core Model. The optimal content determined in this work (2 wt% MGO) was verified by the thermal properties (thermal conductivity, structural thermal stability and coefficient of thermal expansion) of MGO/epoxy composites. Based on the inherent relationship between the effect of MGO percolating chains on the thermal polymerization behavior and the resulting thermal properties, this strategy can be easily extended to different kinds of conductive MGO/polymer composites.
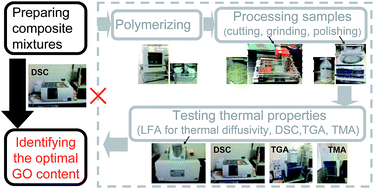
Apart from the guidance of numerical methods (molecular dynamics simulation;9 statistical, thermodynamic and structure-oriented percolation models,10,11 etc.), so far the most widely applied procedure in determining the optimal GO content for polymer composites involves:12–15 (a) preparing composite mixtures with different GO content, (b) polymerizing, (c) processing polymerized samples (cutting, grinding, finely polishing, etc.), (d) testing various properties, and finally (e) identifying the critical GO content among formulations for polymer composites with the optimal properties. This procedure, especially steps (c and d), is complicated and time-consuming, severely hindering the rapid development of GO/polymer composites.
It is worth noting that step (b) plays an important role in determining the final properties of GO/polymer composites. Great effort has been undertaken to describe the influences of GO on the polymerization processes, e.g. those of benzoxazine,16 ethylene-propylene-diene rubber,17 cyanate ester resin,18 poly(L-lactic acid),19 tetrafunctional tetraglycidyl-4,4′-diaminodiphenylmethane,20 epoxy/amine,21 epoxy/anhydride,22 poly(3-hydroxybutyrate),23,24 photocured epoxy25,26 and poly(3,4-ethylenedioxythiophene)-block-poly(ethylene glycol)/polyvinylidenefluoride.27 As a result, the influence mechanisms of GO on the structural,16–18,23–25 thermal,16,20,22,23,27 dielectric25 and mechanical22,25,26 properties of GO/polymer composites were clarified. Optimized polymerization strategies were accordingly further proposed in order to obtain composites with higher performance,18,25,26 but no strategy for determining the optimal GO content has yet been developed.
To address this problem, here, for the first time, we propose an effective strategy to directly identify the critical multi-layer GO (MGO) content for an epoxy composite with optimal thermal properties by monitoring “unusual” effects of MGO on the thermal curing process of epoxy. Based on a solid basis, i.e. the inherent relationship between the effect of MGO percolating chains on the thermal polymerization behavior and the resulting thermal properties, this strategy has great potential for widespread use in conductive MGO/polymer composites.
Diglycidyl ether of the bisphenol-A (DGEBA)/2-ethyl-4-methylimidazole (EMI-2,4) system, a widely used epoxy system in industries, was employed herein. Epon 828, supplied by Shanghai Resin Co. Ltd., China, is basically DGEBA with an epoxy value of 0.48–0.52 mol/100 g. Curing agent EMI-2,4 was supplied by Wako Pure Chemical Industries, Ltd., Japan. The employed weight ratio of DGEBA and EMI-2,4 was 100:
6. Graphite particles (size ∼500 μm, carbon content >99%) were supplied by Xinfangyuan Co. Ltd., China. Other agents utilized were analytically pure grade and supplied by Wako Pure Chemical Industries, Ltd., Japan.
Infrared spectra were tested using an FT-IR spectrometer (Perkin-Elmer frontier, Perkin-Elmer Japan Co., Ltd.) to evaluating the functional groups of MGO, the hydrogen bonds at the MGO/epoxy interface, as well as the whole epoxy curing degree (αIR). The spectra were obtained by averaging 16 scans in the frequency range from 4000 to 700 cm−1 with a resolution of 4 cm−1 followed by subtracting the background curve. Attenuated total reflectance spectra were collected from the polymeric films. αIR was obtained by measuring the reactive absorbance of the epoxy band (914 cm−1) against the absorbance of the benzene ring band (1610 cm−1), which acts as a reference. These absorbances were calculated in the spectra processed by a base-line correction to obtain comparable results. A set of three specimens was tested for each material after being pre-dried in air at 373 K for 12 h.
Approximately 4 mg of MGO/DGEBA/EMI-2,4 mixture was weighed accurately into an aluminum differential scanning calorimetry (DSC) sample pan and then covered with an aluminum lid. DSC measurements were carried out using a NETZSCH DSC 204 F1 system (NETZSCH Instruments Japan Co., Ltd.). The DSC was calibrated with high purity indium; α-Al2O3 was used as the reference material. Dynamic experiments were carried out under an argon flow rate of 25 mL min−1 and temperature ranging from 313 to 623 K at different heating rates of 10, 15, 20, 25 K min−1. The reaction was considered to be complete when the curve leveled off to a baseline. The cured sample was left in the DSC cell and cooled to room temperature. To determine the glass transition temperature (Tg) of the reacted product, the cured sample was scanned again to 623 K at 10 K min−1. The intermediate point of the heat flow step of the second diagram was defined as DSC Tg. A set of three specimens was tested for each material.
Thermal diffusivity (δ, mm2 s−1) at room temperature was measured on square plate samples (10 × 10 × 1 mm3) by a laser flash method (nanoflash LFA 447 system, NETZSCH Instruments Japan Co., Ltd., a total of 5 shots were taken per sample set), specific heat (C, J g−1 K−1) at room temperature was measured on disk samples (6 mm diameter, 1 mm thickness) by DSC (NETZSCH DSC 204 F1 system, NETZSCH Instruments Japan Co., Ltd.), and the bulk density (ρ, g cm−3) of the specimen was measured by water displacement. For each measurement, three samples were tested five times. After that, thermal conductivity (λ, W m K−1) was calculated using the equation: λ = δ × C × ρ.
Thermal degradation behavior was characterized by a TGA (TG-DTA200se/h/24/1 system, NETZSCH Instruments Japan Co., Ltd.) at a scan rate of 10 K min−1 to 1023 K in N2. A set of three specimens was tested for each material. Specimens were pre-dried in air at 373 K for 12 h to remove absorbed water.
The coefficient of thermal expansion (CTE) was tested on square plate samples (25 × 5 × 1 mm3) by SII TMA/SS7100 (Hitachi High-Tech Science Co., Japan, tensile mode with a 5 mN load) at a heating rate of 5 K min−1 in N2 atmosphere. The CTE values were determined from the second run of 303–443 K profiles. A set of three specimens was tested for each material.
Wide angle X-ray diffractometry (WXRD) (Rigaku RINT RAPID II) with Cu-Kα radiation (k = 0.154 nm) at a generator voltage of 40 kV and current of 30 mA was used to examine the crystal structure of samples in a 0–50° range of diffraction angles. A set of three specimens was tested for each material.
SED gave an unambiguous local identification of the monolayer. Nevertheless, this is not a reliable method of estimating the proportion of multi-layers in the as-received product, since SED can provide a monolayer-like pattern for the multi-layers, as the beam is incident on a protruding monolayer; a better qualitative evaluation method is to observe the product by FE-SEM.29 The dimension of MGO sheets in Fig. 1(c) is found from submicron to several micrometers, and the inserted image presents ∼14.3 nm in thickness, indicating that many MGO sheets utilized in this work are composed of ∼29 stacked single-layer sheets, since the average thickness of an individually exfoliated GO sheet is ∼0.486 nm.30 Furthermore, the FTIR spectrum of MGO in Fig. 1(d) shows the presence of –OH and CO groups16,17 which facilitate the chemical interactions of the MGO sheets with the epoxy matrix, thus the as-received MGO product is confirmed to have desirable functional groups.
![]() | ||
Fig. 2 Dynamic DSC curves of (a) neat epoxy (line) and 1 wt% MGO/epoxy system (line + symbols) at different heating rates, (b) all the systems at a heating rate of 10 K min−1. |
Cured system | Tp (K) | ΔH (J g−1) | αIR |
---|---|---|---|
Neat epoxy | 398.28 ± 0.20 | 495.2 ± 1.2 | 0.92 ± 0.01 |
0.5 wt% MGO/epoxy | 400.61 ± 0.10 | 512.1 ± 2.5 | 0.92 ± 0.01 |
1 wt% MGO/epoxy | 416.27 ± 0.15 | 582.2 ± 2.7 | 0.94 ± 0.01 |
2 wt% MGO/epoxy | 411.27 ± 0.13 | 544.2 ± 2.9 | 0.99 ± 0.01 |
3 wt% MGO/epoxy | 430.60 ± 0.07 | 656.3 ± 1.5 | 0.97 ± 0.01 |
For an in-depth analysis, an effective method is employed herein, specifically α vs. T at different heating rates of all the systems investigated is presented in Fig. 4(a). For each formulation all the curves have the same functional form, only shifting along the temperature axis, and should be superposable by simply shifting each curve along the temperature axis relative to a curve at an arbitrary reference heating rate by a shift factor, φ(β) = Tref − Tβ, where β is the heating rate.33
![]() | ||
Fig. 4 (a) Reaction extent α vs. T and (b) superposed curves of α vs. T of neat epoxy and MGO/epoxy systems. Dotted lines are given only to show the trend. |
Fig. 4(b) shows the superposed curves of α vs. T for all the systems, taking the curve of 25 K min−1 heating rate as the master curve. The master curve represents the progression of the reaction for a material cured at a reference heating rate.
The phenomenological reaction rate, dα/dt, has the general expression:33
dα/dt = Ae−E/RTf(α), | (1) |
Let T = βt, then dα/dT can be expressed as:
dα/dT = Ae−E/RTf(α)/βln(dα/dT) − ln[Af(α)] = −E/RT − ln![]() | (2) |
As far as some arbitrary reaction extent α is concerned, the values of ln[Af(α)] at different heating rates are equal while the values of dα/dTβ, the tangent slope at the point corresponding to α in the curves at different heating rates, are not always equal to that of the reference curve i.e. dα/dTref. Previous work33 demonstrated that if the reaction is kinetically controlled, dα/dTβ > dα/dTref, as taking the curve of maximum heating rate as the master curve, that is to say the curves of α vs. T should branch off from the master curve, and the shift factor φ(β) = Tref − Tβ will increase as α increases.
During the curing, the system undergoes gelation (liquid-to-rubber) and vitrification (rubber-to-glass) transitions. As Tg increases over the curing temperature Tc, the system vitrifies, the reaction becomes diffusion controlled and the values of dα/dTβ decrease, i.e. the curves of α vs. T do not shift enough from the master curve; although we do not know the exact degree to which the curves should shift from the master curve, a qualitative comparison can be made.33 As far as the curves in Fig. 4(b) are concerned, the vitrification degree follows the sequence 3 wt% MGO < 1 wt% MGO < 0.5 wt% MGO < 2 wt% MGO < neat epoxy, highlighting an “unusual” promotion effect of 2 wt% MGO on vitrification.
The “unusual” promoted vitrification was also supported by the “unusual” increase effect of 2 wt% MGO on Tg, as shown in Fig. 5.
Tg decreases with increasing MGO content (0.5, 1, 3 wt%), which can be due to an antagonistic competition of two effects. So far the increased Tg for epoxy resins in the presence of a small amount of GO (≤0.5 wt% GO34,35) is mainly attributed to the reaction of epoxide with functional groups of GO,36 herein the chemical bonding in the MGO/epoxy interface as well as the physical hindrance of MGO hampers the epoxy motion, contributing to an enhancing effect on Tg, since Tg increases with the increasing restriction imposed by crosslinking on the epoxy motion.33 On the other hand, massive MGO sheets disrupt the crosslinking of the epoxy matrix,36 the –OH concentration gradient originating from the –OH groups of the MGO sheets exerts a driving force on the diffusion of unreacted epoxy for the epoxy/MGO reaction. What is more, the diffusion is facilitated by the extra free volume derived from the tremendous MGO/epoxy interface,33 as a result a final lowering effect of MGO (0.5, 1, 3 wt%) on Tg occurs. Inhibited vitrification keeps the cure reaction under long-term kinetic control until it reaches the higher temperature zone, resulting in increased heat of reaction ΔH (see Table 1), e.g. the lowest Tg but the highest ΔH of 3 wt% MGO/epoxy composite.
More importantly, the “unusual” increase effect of 2 wt% MGO on Tg confirms the existence of 2 wt% MGO chains percolating throughout the matrix. The steep temperature gradient caused by these heat-flow preferred percolating chains intensively promotes the epoxy/MGO reaction as well as epoxy crosslinking, leading to a strong MGO/epoxy interfacial bonding (will be discussed below) and the highest epoxy curing degree αIR (see Table 1), thus producing a predominant restriction on epoxy motion and the “unusual” increase effect on Tg.
![]() | ||
Fig. 6 (a) FTIR spectra of all the cured systems, showing the vibration of the –OH groups at wavenumbers 3100–3700 cm−1, (b) illustration of modified Shrinking Core Model. |
The epoxy/MGO reaction can be studied using the Shrinking Core Model, the best simple representation for the majority of reacting fluid–particle systems.38–40 Here, the original sphere–shell model was modified with a cylinder–shell model customized for the special layered structure of the MGO sheet (see Fig. 6(b)). The epoxy/MGO reaction occurs first at the outer skin of the MGO sheet, and then the reaction zone moves into the intersheet and leaves behind the reacted cylindrical zone, i.e. three steps occur in succession: (1) diffusion of the DGEBA molecule through the liquid film surrounding the MGO sheet to the surface of the MGO sheet, (2) penetration into the intersheet space of MGO and diffusion of the DGEBA molecule through the reacted region to the surface of the unreacted cylinder core part, and (3) reaction of the DGEBA molecule with the unreacted cylinder core at the interface of the reacted region and unreacted core region. The resistance of different steps usually varies greatly; in this case the step with the highest resistance is the rate-controlling step. The progress of the epoxy/MGO reaction is controlled in turn by chemical reaction, reacted region diffusion, and liquid film diffusion.
The whole reaction, including the epoxy crosslinking and the epoxy/MGO reaction, can therefore be simply divided into two stages i.e. chemical reaction-controlling and diffusion-controlling stages, reflected as the double-peak pattern.41
The amount of curing heat released during the two stages determines the peak-area proportion. As MGO content is low, the second peak tends to overlap with the first one (0.5 wt%) or is only a negligible small peak (1 wt%), as shown in Fig. 2(b). However, as 2 wt% MGO is added, an obvious double-peak pattern starts to appear, indicating an unprecedented amount of curing heat released at the diffusion-controlling stage. Such a qualitative change reconfirms the existence of MGO percolating chains with 2 wt% MGO sheets present, which promotes unprecedented diffusion of epoxy for the curing reaction.
Further increasing the MGO content e.g. to 3 wt%, leads to more reactions being inhibited until the diffusion-controlling stage. As a result the second peak gets stronger, with the first peak diminishing, as shown in Fig. 2(b). However, a sharply increased viscosity had already been noted in preparing the 2 wt% MGO/epoxy composite mixture, which means MGO agglomerates will be impossible to be cleared at higher MGO contents. Therefore, among the formulations in this work, 2 wt% MGO is finally identified as the critical content with the optimal strengthening effect on the thermal conductivity of epoxy, considering the unavoidable MGO agglomerates in the 3 wt% MGO/epoxy composite.
Furthermore, 2 wt% MGO also led to the highest Tg, which has a key role in determining the structural thermal stability and the CTE value, therefore 2 wt% MGO is identified as the critical content among the formulations here for the epoxy composite with the optimal thermal properties.
Apparently, further research is needed to identify the percolating threshold within 1–2 wt% MGO, or more precisely identify the optimal MGO content by extending the formulations such as 2.1, 2.2, 2.3, …, 2.8, 2.9 wt% MGO, but this is beyond the scope of this study.
![]() | ||
Fig. 8 TGA curves of neat epoxy, MGO sheets and MGO/epoxy composites (insets: enlargement of the boxed regions). |
![]() | ||
Fig. 9 CTE values of neat epoxy and MGO/epoxy composites (inset: FE-SEM image of the fracture surface of 2 wt% MGO/epoxy composite). |
Sample | Thalf (K) | Char yield (%) |
---|---|---|
Neat epoxy | 706.8 ± 0.1 | 9.1 ± 0.1 |
MGO sheets | — | 52.2 ± 0.2 |
0.5 wt% MGO/epoxy composite | 708.8 ± 0.1 | 12.9 ± 0.1 |
1 wt% MGO/epoxy composite | 708.4 ± 0.1 | 14.2 ± 0.1 |
2 wt% MGO/epoxy composite | 711.8 ± 0.2 | 13.2 ± 0.1 |
3 wt% MGO/epoxy composite | 710.4 ± 0.1 | 14.8 ± 0.1 |
The critical MGO content for the optimal thermal conductivity was verified by two facts: (1) as shown in Fig. 7, thermal conductivity rises slowly at low MGO contents (0.5, 1 wt%), then exhibits a sharp rise at the 2 wt% MGO, reaching a maximum (2.03 times that of the epoxy); (2) at the initial and the later thermal degradation stages (see the insets in Fig. 8), accelerated thermal degradation is noticed with the 2 wt% MGO, evidencing the existence of thermally conductive 2 wt% MGO percolating chains, which markedly promote the thermal degradation, especially after structural decomposition commences, and consequently result in a relatively low char yield of 2 wt% MGO/epoxy composite, compared to that of the 1 wt% MGO/epoxy composite (see Table 2).
The critical MGO content for the optimal structural thermal stability is proved, based on the fact that the maximum Thalf is achieved at the 2 wt% MGO (see Table 2), which can be due to the highest structure-determined Tg of the 2 wt% MGO/epoxy composite among all the formulations investigated,42,43 as well as the effective barrier-effect of 2 wt% MGO, which retards the decomposition of epoxy by the even dispersion of MGO sheets (will be discussed below).30
Also, the critical MGO content for the optimal CTE is supported by the remarkable reduction in CTE, 23% reduction in CTE, at the 2 wt% MGO content shown in Fig. 9. CTE of MGO/epoxy composites originates in three parts: MGO, epoxy matrix and MGO/epoxy interface. Besides the relative rigidity of the MGO sheets, the reduction in CTE of the 2 wt% MGO/epoxy composite can be attributed to the strongly enhanced MGO/epoxy interface by the intensively promoted epoxy/MGO reaction, with heat-flow preferred 2 wt% MGO percolating chains. Normally, neat epoxy is a featureless smooth area with a typical brittle fracture process, whereas improved surface roughness (see the insert) is accompanied by the creation of plastic deformation of the matrix, confirming the existence of the strongly bonded MGO/epoxy interface.
Additionally, as expected, a further increase in thermal properties was not achieved at 3 wt% MGO, and the supposed MGO agglomerates that significantly reduce the effectiveness of MGO for forming a conductive network are also confirmed by WXRD, FE-SEM and TEM results (see Fig. 10): (i) the WXRD pattern of graphite particles exhibits a sharp characteristic peak centered at 2θ = 26.6° and a small characteristic peak centered at 2θ = 43.3° (see Fig. 10(a)), which are assigned to the diffraction of (002) and (100) planes of well-ordered graphenes, respectively.36 The as-received MGO sheets keep the small peak and the sharp characteristic peak disappears, which is associated with a high disorder in the direction perpendicular to the MGO layers36 (the sharp peak at 2θ = 26.6° in graphite usually shifts to 14.1–14.9° in graphite oxide, however, the peak would disappear as graphite oxide exfoliates into single sheets.44 The small peak centered at 2θ = 43.3° usually remains in graphite oxide36 or MGO sheets45). Notably, after being dispersed in epoxy, WXRD patterns of 0.5, 1, 2 wt% MGO/epoxy composites only show a broad diffraction peak originating from amorphous epoxy centered at 2θ = 18.5°; the small peak disappears, which indicates complete disorder in the direction perpendicular to the GO layers, clearly demonstrating the highly exfoliated level of MGO in the matrix as MGO content is up to 2 wt%.36,44,46,47 Subsequently a small diffraction peak of MGO appears, verifying that MGO restacks in the matrix at 3 wt% content; (ii) it can be observed in FE-SEM images (Fig. 10(b)) that numerous tortuous and fine river-like structures with hackles and ribbons exist on the fracture surface, suggesting the highly dispersed state of 0.5, 1 and 2 wt% MGO in the matrix.30,34 Comparatively, bigger tortuous and river-like structures, especially the agglomerates circled in Fig. 10(b), clearly confirms that MGO restacks in 3 wt% MGO/epoxy composite; (iii) TEM images (Fig. 10(c)) further confirm the highly dispersed state of 0.5, 1 and 2 wt% MGO in the matrix, while the large MGO agglomerate emerges in the 3 wt% MGO/epoxy composite.
This journal is © The Royal Society of Chemistry 2015 |