A sensitive electrochemical sensor for direct phoxim detection based on an electrodeposited reduced graphene oxide–gold nanocomposite†
Yuhong Zhengb,
Aiwu Wangc,
Haitao Lin*a,
Li Fu*b and
Wen Caic
aYunnan University of TCM, Kunming, Yunnan 650500, P. R. China. E-mail: haitaolinyutcm@yahoo.com
bInstitute of Botany, Jiangsu Province and Chinese Academy of Sciences, Nanjing Botanical Garden, Mem. Sun Yat-Sen, Nanjing, 210014 P. R. China. E-mail: lifugyt@gmail.com
cDepartment of Physics and Materials Science, City University of Hong Kong, P. R. China
First published on 28th January 2015
Abstract
The principal objective of this study was to develop a sensitive and selective electrochemical sensor for phoxim detection based on a reduced graphene oxide–gold nanocomposite (RGO–Au) modified grassy carbon electrode (GCE). The proposed sensor was fabricated by pulsed electrodeposition of reduced graphene oxide followed by chronoamperometric deposition of Au nanoparticles, and applied for the electrochemical detection of phoxim. The modified electrode was characterized by SEM, UV-vis spectroscopy, Raman spectroscopy and XRD. The electrocatalytic activity of RGO–Au/GCE towards reduction of phoxim was evaluated using cyclic voltammetry and differential pulse voltammetry. The results showed that the RGO–Au nanocomposite could greatly enhance the electrochemical reduction of phoxim. Under optimal conditions, the reduction peak current was proportional to phoxim concentration over a wide range between 0.01 and 10 μM, and the detection limit was 0.003 μM (S/N = 3). The proposed phoxim biosensor also exhibited excellent stability and reproducibility. In addition, the sensor was successfully employed for determining phoxim in a variety of food samples.
1. Introduction
Organophosphate pesticides have been widely used to control unwanted organisms in agricultural activities. They could be found in food products due to their overuse and accumulation in the food chain. They are well known as highly toxic compounds which can pose a risk to human neurological health. These neurotoxic compounds could irreversibly inhibit the enzyme acetylcholinesterase resulting in the buildup of the neurotransmitter acetylcholine which interferes with muscular responses and in vital organs produce serious symptoms and eventually death.1–3 Phoxim (phenylgloxylonitrile-oxime-o,o-diethyl-phosphorothionate, also known as Sebacil EC 50® and Byemite®, Fig. S1†) is one of the most common organophosphate pesticides used for controlling a variety of ectoparasites in pigs, sheep and chickens.4 Study showed that the phoxim can undergo a photodegradation process and produce the thiono–thiolo rearranged compound, o,o-diethyl-cyanobenzylideneamino-thiophosphonate (DCTP), a highly active acetylcholinesterase inhibitor, when exposed to natural sunlight.5 Therefore, it is necessary to develop a highly sensitive, selective, rapid and reliable analytical method to determine phoxim for food quality control purposes. At present, some methods have been established for detection of phoxim such as high-performance liquid chromatography (HPLC),4,6–9 liquid chromatography-mass spectrometry,10 enzymatic kinetic methods,11 near-infrared spectroscopy12,13 and spectrophotometry.11 However, these reported methods require expensive and complicated instruments, time-consuming pretreatment steps and skilled operators. In order to avoid these problems, electrochemical methods have attracted more attention due to their sensitivity, accuracy, lower cost and simplicity.14–18 Studies demonstrated acetylcholinesterase immobilized electrochemical sensors for phoxim determination.19,20 However, enzyme based electrochemical sensors have some drawbacks, such as complicated and multi-step immobilization procedures, high cost and instability.21–23 Therefore, considerable attention has been paid to the fabrication of non-enzymatic sensors for specific target molecule detection. So far, only two studies have been reported regarding the direct electrochemical detection of phoxim and development of a selective, sensitive and rapid electrochemical sensor still remains a challenge.14,24Graphene, a two-dimensional one-atom-thick planar carbon sheets, has attracted a great deal of interest since it has been discovered in 2004 due to its extraordinary properties, such as excellent electronic conductivity and large specific surface area.25,26 Therefore, graphene consider as an excellent candidate for electrode surface modification for specific target molecule detection. On the other hand, gold nanoparticles are widely used nanomaterials for the fabrication of electrochemical biosensors because they can provide suitable microenvironments for immobilization of biomolecules with excellent electrocatalytic property.27–30 Up to date, several examples for Au–graphene nanocomposites have been reported for electro-determination applications.31–33 For example, Liu and co-workers demonstrated the fabrication of a novel electrochemical DNA biosensor based on graphene-three dimensional nanostructure gold nanocomposite modified glassy carbon electrode.34 Sun and co-workers reported a three-dimensional macroporous gold nanoparticles–graphene composites for electrochemically sensitive detection of carcinoembryonic antigen in human serum.35 However, most of the graphene–Au composites were synthesized by in situ method, only a small number of reports on growing Au nanoparticles on graphene surface by electrodeposition method.36
The aim of this work was to develop a fast, simple, stabile and highly sensitive phoxim biosensor based on reduced graphene oxide–gold nanocomposite (RGO–Au) using pulsed electrodeposition combine with chronoamperometric deposition methods. The electrochemical behavior of phoxim at the RGO–Au nanocomposite modified grassy carbon electrode (GCE) was investigated. Several factors affecting the electrocatalytic performances of the proposed phoxim sensor were also further optimized. In addition, the proposed phoxim sensor was successfully employed for determination phoxim in a variety of food samples.
2. Experimental
2.1. Chemicals and materials
Phoxim, synthetic graphite (average particle diameter < 20 μm), glutamic acid, ascorbic acid, uric acid, parathion, methyl parathion, malathion, methyl isofenphos, thimet, methamidophos and HAuCl4·3H2O were purchased from Sigma-Aldrich. All other chemicals used were analytical grade reagents without further purification. Milli-Q water (18.2 MΩ cm) was used throughout the experiments.2.2. Electrodeposition of RGO–Au nanocomposite
Graphene oxide (GO) was prepared according to the modified Hummers method with little modifications.37,38 The prepared GO was dispersed in to water (0.5 mg mL−1) with the 0.25 M NaCl and then used for the following electrodeposition process. For electrodeposition of RGO film, a GCE (3 mm in diameter) was polished with alumina–water slurry followed by rinsing with ethanol and water. A platinum wire was used as the auxiliary electrode and an Ag/AgCl (3 M KCl) as the reference electrode. The electrodeposition of RGO was carried out under pulsed electrodeposition technique of 500 cycles in the GO dispersion with N2 bubbling (Fig. S2†). Next, electrochemical deposition of Au nanoparticles on RGO modified GCE was performed in 0.5 M H2SO4 solution containing 1% HAuCl4 using chronoamperometry at an applied potential of −0.2 V for 60 s.2.3. Characterization
The morphology of as-synthesized nanocomposite was observed using a ZEISS, SUPRA 55 field emission scanning electron microscopy (FESEM) measurements. The optical analysis was obtained by UV-vis spectrophotometer (Perkin Elmer Lambda 950). Raman spectroscopy was performed at room temperature using a Raman Microprobe (Renishaw RM1000) with 514 nm laser light. The crystal phase information of sample was characterized from 5° to 80° in 2θ by a XRD with Cu Kα (λ = 0.1546 nm) radiation (D8-Advanced, Bruker).2.4. Real sample preparation
Food samples were purchased from the Carrefour supermarket. The pre-treatment of food samples are according to the literature with some modifications.14 50 g of each sample was cleaned by and homogenized using a grinder. The samples were then extracted with 100 mL of acetone. The supernatants were filtered to remove the solids and then evaporated to dryness. The residue was then dissolved and diluted to 50 mL with water.3. Results and discussion
3.1. Characterization of RGO–Au nanocomposite
The surface morphology of the resulting samples were observed by SEM. Fig. 1A–C display the typical SEM images of electrodeposited RGO and RGO–Au nanocomposite. As shown in Fig. 1A, electrodeposited RGO film displays a flake-like shape with many wrinkles. After chronoamperometric deposition of Au nanoparticles (Fig. 1B), the surface and interlayers of RGO sheets have shown the decoration of many spherical Au nanoparticles with an average diameter of 35 nm (based on more than 200 Au nanoparticles). The uniformity of Au nanoparticles deposition was observed under high EHT voltage level. As shown in Fig. 1C and S3,† the observation indicates our proposed method could uniformly deposit Au nanoparticles on the RGO film without aggregation.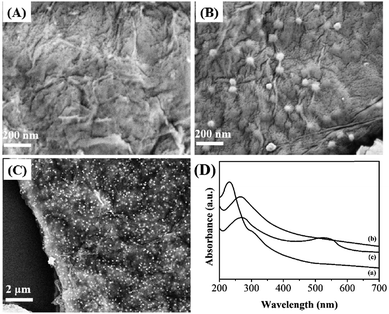 | ||
| Fig. 1 SEM images of (A) RGO and (B and C) RGO–Au nanocomposite. (D) UV-vis spectra of (a) GO, (b) RGO and (c) RGO–Au nanocomposite. | ||
Fig. 1D displays the UV-vis spectra of GO, RGO and RGO–Au dispersions. The spectrum of GO exhibits a maximum absorption peak at 228 nm and a shoulder peak at about 302 nm, which assign to the π–π* transitions of aromatic C–C bonds and n–π* transitions of C![[double bond, length as m-dash]](https://www.rsc.org/images/entities/char_e001.gif) O bonds.39 After pulsed electrodeposition, the absorption peak at 226 nm shows a shift to 272 nm and the shoulder absorption peak disappears, suggesting the GO has been successfully reduced during the pulsed electrodeposition process. After chronoamperometric deposition of Au nanoparticles, the spectrum of the sample exhibits a new broad absorption peak centred at about 540 nm, corresponding to the surface plasmon absorption of Au nanoparticles, confirming the existence of Au nanoparticles in the sample.40
O bonds.39 After pulsed electrodeposition, the absorption peak at 226 nm shows a shift to 272 nm and the shoulder absorption peak disappears, suggesting the GO has been successfully reduced during the pulsed electrodeposition process. After chronoamperometric deposition of Au nanoparticles, the spectrum of the sample exhibits a new broad absorption peak centred at about 540 nm, corresponding to the surface plasmon absorption of Au nanoparticles, confirming the existence of Au nanoparticles in the sample.40
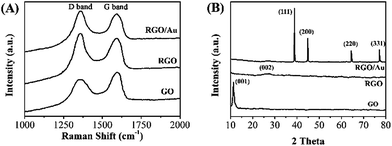
Raman scattering is a highly sensitive tool for the characterization of carbon based materials. Fig. 2A shows the Raman spectra of the GO, RGO and RGO–Au nanocomposite. The spectrum of GO shows two characteristic bands at 1310 cm−1 (D band) and 1596 cm−1 (G band), which are corresponded to sp3 and sp2 carbon hybridization, respectively.41 After the electrodeposition, the ID/IG ratio in RGO (1.31) shows a significant increase compared with the GO (0.91), indicating the increase in the average size of the sp2 sites. According to literatures, it suggests the reduction reaction has taken place.42,43 The spectrum of RGO–Au nanocomposite shows a similar scattering profile with RGO, except the G band has a small upshift (from 1596 to 1601 cm−1), which can be attributed to the doping of Au nanoparticles on RGO sheets.44,45
The interlayer changes and crystalline structure of GO, RGO and RGO–Au nanocomposite were analyzed by XRD and depicted in Fig. 2B. As expected, the XRD pattern of GO shows a characteristic (001) peak at 11.1° with a d-spacing value of 0.81 nm.46 However, the RGO displays an almost featureless XRD pattern, suggesting the occurrence of reduction of GO. A small peak centred at 23.0° is due to the presence of stacked graphene layers of RGO.47 The XRD spectrum of In RGO–Au nanocomposite shows diffraction peaks located at 39.5°, 46.2°, 67.4° and 81.5°, which are assigned to (111), (200), (220) and (311) planes of face-centered-cubic (fcc) crystallographic structure of Au (JCPDS 4-0783), respectively, confirming the successful electrodeposition of Au nanoparticles.
3.2. Electrochemical behavior of phoxim at RGO–Au/GCE
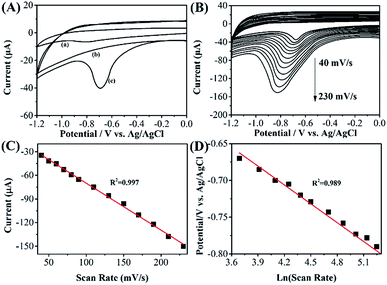
Fig. 3A shows the CV profiles of bare GCE and RGO–Au/GCE toward reduction of 10 μM phoxim at scan rate of 50 mV s−1 in the potential range of 0 to −1.2 V. It can be seen that a small peak is observed at the potential of −0.81 V with a peak current of −6.53 μA in bare GCE, corresponding to the electro-reduction of phoxim (curve a). While at RGO–Au/GCE, a clear reduction peak with peak current about −40.26 μA is observed at −0.69 V (curve c). Moreover, no reduction peak is observed on the CV of RGO–Au/GCE without phoxim (curve b), confirming the reduction peak in curve c is belonging to the reaction of phoxim. The enhancement of current response and lower the overpotential of phoxim reduction in RGO–Au/GCE could ascribe to the high specific surface area, the excellent electrocatalytic property of nanocomposite and the synergistic effect between RGO sheets and Au nanoparticles.Fig. 3B shows the CVs of 10 μM phoxim in a pH 7.0 PBS at the RGO–Au/GCE using different scan rates. The results show that the reduction peak current increases gradually with the increase of scan rate in the ranged from 40 to 230 mV s−1. A linear relationship is obtained between the peak currents and the scan rates (Fig. 3C), indicating the reduction of phoxim on RGO–Au/GCE is controlled by adsorption.14 The linear regression equation can be represented as: Ipa (μA) = −0.59657v (mV s−1) − 10.24289 (R2 = 0.997). On the other hand, the reduction peak potential shifts negatively when the scan rate increases. Epc shows a linear relationship with ln![[thin space (1/6-em)]](https://www.rsc.org/images/entities/char_2009.gif) ν (Fig. 3D), indicating the electrochemical reaction is irreversible. The linear regression equation can be expressed as: Epc (V) = −0.08548 ln
ν (Fig. 3D), indicating the electrochemical reaction is irreversible. The linear regression equation can be expressed as: Epc (V) = −0.08548 ln![[thin space (1/6-em)]](https://www.rsc.org/images/entities/char_2009.gif) ν (mV s−1) − 0.34717 (R2 = 0.989). Because the adsorbed phoxim is reduced in a totally irreversible one-step reaction, the following Laviron's equation48,49 can be used:
ν (mV s−1) − 0.34717 (R2 = 0.989). Because the adsorbed phoxim is reduced in a totally irreversible one-step reaction, the following Laviron's equation48,49 can be used:
Epc = E0 + (RT/αnF)ln(RTk0/αnF) + (RT/αnF)ln![[thin space (1/6-em)]](https://www.rsc.org/images/entities/char_2009.gif) ν ν |
![[thin space (1/6-em)]](https://www.rsc.org/images/entities/char_2009.gif) ν, and Laviron's equation, we obtain the following:
ν, and Laviron's equation, we obtain the following:| −RT/αnF = −0.08548 |
As the α exhibits the symmetry of energy barrier, lies between 0.3 and 0.7 in most systems, and is approximated as 0.5.50 The total number of electrons involved in the reduction of phoxim is found equal to 1. A possible reaction mechanism of phoxim at the RGO–Au/GCE is represented in Fig. S4.†14
It is a known fact that pH of the electrolyte has a significant effect on the electrochemical determination of target molecules. Fig. 4A shows the current responses of reduction phoxim using RGO–Au/GCE at pH range from 4.0 to 9.0. It can be seen that the reduction peak current of phoxim increases gradually with increasing the pH up to 7.0, and then decreases in strongly alkaline conditions. Therefore, optimum pH for phoxim detection is 7.0.
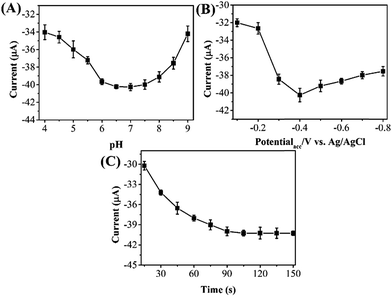 | ||
| Fig. 4 Effect of the (A) pH of PBS, (B) accumulation potential and (C) accumulation time on the current response of 10 μM phoxim at RGO–Au/GCE. | ||
Because the reduction of phoxim at RGO–Au/GCE is controlled by adsorption, accumulation may exert great influence on the analytic sensitivity and the intensity of peak current. Therefore, the reduction peak current of phoxim at different potentials was measured individually. As shown in Fig. 4B, the peak current increases gradually with the increasing accumulation potential from −0.1 to −0.4 V and then decrease with further increasing potential. Fig. 4C depicts the effect of accumulation time on the reduction peak current of 10 μM phoxim. As extending the accumulation time from 15 to 90 s, the reduction peak current of phoxim increases greatly, indicating that accumulation process could improve the determining sensitivity. When further prolonging the accumulation time from 90 to 150 s, the peak current remains unchanged. Therefore, the accumulation conditions of −0.4 V and 90 s were used in further measurements.
Differential pulse voltammetric (DPV) was employed for determining phoxim under the optimum experimental conditions. Fig. 5 shows the DPV profiles of different concentrations of phoxim at RGO–Au/GCE. The reduction currents gradually increase along with the increasing of phoxim concentration from 0.01 to 10 μM. The insert of Fig. 5 displays that the current response of RGO–Au/GCE has a linear relationship with the concentrations of phoxim. The obtained linear regression equation can be expressed as I (μA) = −8.04894 (μM) − 5.49344 (R2 = 0.994). The detection limit for phoxim is estimated to be 0.003 μM based on a signal-to-noise ratio of 3. The analytical performance of this phoxim sensor was compared with that of other phoxim determination method reported previously as shown in Table S1.†
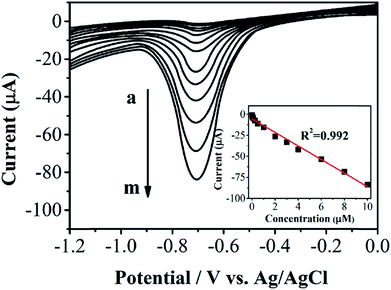 | ||
| Fig. 5 DPV curves for phoxim at RGO–Au/GCE with different concentrations of phoxim (from a to m: 0.008, 0.02, 0.05, 0.1, 0.25, 0.5, 1, 2, 3, 4, 6, 8, 10 μM). | ||
Potential interference to the reduction current response of phoxim from many foreign species was investigated using DPV under optimal experimental conditions. Experimental results showed that 500-fold excess of Na+, Zn2+, Fe3+, Ca2+, K+, Mg2+, glutamic acid, glucose, ascorbic acid and uric acid have no influence on the signals of phoxim with the deviation below 5%. 100-fold excess of parathion, methyl parathion, malathion, methyl isofenphos, thimet, and methamidophos have also no influence on the signals of phoxim with the deviation below 4%. The results of the interference study were summarized in Table S2.†
3.3. Repeatability, stability and real sample analysis
In order to evaluate the repeatability of the RGO–Au/GCE, a 5 μM phoxim PBS solution was successively measured for 12 times using one RGO–Au/GCE. The RSD values were found to be 1.31%. On the other hand, five fresh fabricated RGO–Au/GCE were also used for determining 5 μM phoxim. The RSD was calculated to be 2.71%. Therefore, our proposed phoxim electrochemical sensor has a satisfactory repeatability. The storage stability was tested by storing the RGO–Au/GCE in refrigerator for one month. The result showed that the reduction peak potential of phoxim had no shift and the current response only showed 3.21% decrease compared with the original test. Therefore, our proposed sensor also has a satisfactory stability. The robustness of the proposed phoxim sensor was investigated by studying the effect of small variations in PBS's pH (6.8–7.2), accumulation potential (−0.38 to −0.42 V) and accumulation time (88–92 s) on the recovery of phoxim. The results indicated no significant changes in the current response. The recovery for phoxim under variable conditions was in the range of 96.5–101.1%. Therefore, the RGO–Au/GCE also exhibits very good robustness.The proposed sensor was used for the determination of phoxim in broccoli, celery, egg, pork sausage and ham. DPV results showed no peak current of phoxim in all samples, indicating no phoxim is contained in these food. The standard addition method was then applied, by adding successive concentrations of phoxim. As shown in Table 1, the recovery for the determination of phoxim was in the range of 97.2–101.0%. In order to evaluate the accuracy, the contents of phoxim in these samples were also analyzed by GC-MS and listed in Table 1 as well. The results obtained by GC-MS and RGO–Au/GCE were in good agreement, confirming the proposed electrochemical sensor is capable for determining phoxim in various food samples.
| Sample | Added (μM) | Found (μM) | Recovery (%) | RSD (%) |
|---|---|---|---|---|
| a Data collected from RGO–Au/GCE electrochemical sensor.b Data collected from GC-MS. | ||||
| Broccoli | — | Not founda,b | — | — |
| 0.1 | 0.0998a, 0.0997b | 99.8a, 99.7b | 1.98a, 2.00b | |
| 1 | 0.9887a, 1.0012b | 98.87a, 100.12b | 2.15a, 2.03b | |
| Celery | — | Not founda,b | — | — |
| 0.1 | 0.0996a, 0.0963b | 99.6a, 96.3b | 1.22a, 2.21b | |
| 1 | 1.0099a, 0.9721b | 100.99a, 97.21b | 1.99a, 1.02b | |
| Egg | — | Not founda,b | — | — |
| 0.05 | 0.0502a, 0.0487b | 100.4a, 97.4b | 2.28a, 2.65b | |
| 2 | 2.0047a, 1.9744b | 100.23a, 98.72b | 3.01a, 1.47b | |
| Pork sausage | — | Not founda,b | — | — |
| 0.05 | 0.0486a, 0.0502b | 97.2a, 100.4b | 1.92a, 4.56b | |
| 2 | 1.9770a, 2.0237b | 98.85a, 101.19b | 0.74a, 1.45b | |
| Ham | — | Not founda,b | — | — |
| 0.01 | 0.0101a, 0.0089b | 101.0a, 89.0b | 2.52a, 3.07b | |
| 5 | 5.0336a, 4.9881b | 100.67a, 99.76b | 2.69a, 3.99b | |
4. Conclusions
In this study, a RGO–Au/GCE was successfully fabricated via sequential electrodeposition of RGO and Au nanoparticles on GCE. The synthesized RGO–Au nanocomposite was characterized by SEM, XRD, Raman spectroscopy and UV-vis spectroscopy, and then employed successfully in the sensitive electrochemical determination of phoxim. The RGO–Au/GCE displays a wide detection linear range (0.01 to 10 μM) and a low detection limit (0.003 μM) for phoxim sensing. In addition, the proposed sensor was successfully employed for deterring the content of phoxim in different types of food samples. The accuracy was confirmed by GC-MS.References
- W. J. Donarski, D. P. Dumas, D. P. Heitmeyer, V. E. Lewis and F. M. Raushel, Biochemistry, 1989, 28, 4650–4655 CrossRef CAS
.
- S. Chapalamadugu and G. R. Chaudhry, Crit. Rev. Biotechnol., 1992, 12, 357–389 CrossRef CAS PubMed
.
- A. Mulchandani, W. Chen, P. Mulchandani, J. Wang and K. R. Rogers, Biosens. Bioelectron., 2001, 16, 225–230 CrossRef CAS
.
- G. Hamscher, B. Prieß and H. Nau, Anal. Chim. Acta, 2007, 586, 330–335 CrossRef CAS PubMed
.
- T. R. Roberts, D. H. Hutson, P. W. Lee, P. H. Nicholls and J. R. Plimmer, Metabolic Pathways of Agrochemicals, JSC International Ltd., Harrogte, UK, 1999, p. 447 Search PubMed
.
- P. Liang, L. Guo, Y. Liu, S. Liu and T.-Z. Zhang, Microchem. J., 2005, 80, 19–23 CrossRef CAS PubMed
.
- L. Guo, P. Liang, T. Zhang, Y. Liu and S. Liu, Chromatographia, 2005, 61, 523–526 CAS
.
- P. Liang, J. Xu, L. Guo and F. Song, J. Sep. Sci., 2006, 29, 366–370 CrossRef CAS
.
- Z. Lv, L. Gao, H. Gao, Z. Hou and B. Zhang, J. Food Sci., 2009, 74, T37–T41 CrossRef CAS PubMed
.
- J. H. Lee, S. Park, W. Y. Jeong, H. J. Park, H. G. Kim, S.-J. Lee, J.-H. Shim, S. T. Kim, A. M. Abd El-Aty, M. H. Im, O. J. Choi and S. C. Shin, Anal. Chim. Acta, 2010, 674, 64–70 CrossRef CAS PubMed
.
- Y. Ni, D. Cao and S. Kokot, Anal. Chim. Acta, 2007, 588, 131–139 CrossRef CAS PubMed
.
- C. Gu, B. Xiang and J. Xu, Spectrochim. Acta, Part A, 2012, 97, 594–599 CrossRef CAS PubMed
.
- F. Shen, Z.-K. Yan, Z.-Z. Ye and Y.-B. Ying, Spectrosc. Spectral Anal., 2009, 29, 2421–2424 CAS
.
- M. Chao and M. Chen, Food Anal. Method, 2014, 7, 1729–1736 CrossRef
.
- S. Chandran, L. Lonappan, D. Thomas, T. Jos and K. Girish Kumar, Food Anal. Method, 2014, 7, 741–746 CrossRef
.
- T. Wang, D. Zhao, X. Guo, J. Correa, B. L. Riehl and W. R. Heineman, Anal. Chem., 2014, 86, 4354–4361 CrossRef CAS PubMed
.
- L. Fu, W. Cai, A. Wang and Y. Zheng, Mater. Lett., 2015, 142, 201–203 CrossRef CAS PubMed
.
- L. Fu, A. Wang, Y. Zheng, W. Cai and Z. Fu, Mater. Lett., 2015, 142, 119–121 CrossRef CAS PubMed
.
- C. Zhang, J. Zhang, K. Wang and Z. Dai, Acta Chim. Sin., 2012, 70, 1008–1012 CrossRef CAS
.
- H. Yin, S. Ai, J. Xu, W. Shi and L. Zhu, J. Electroanal. Chem., 2009, 637, 21–27 CrossRef CAS PubMed
.
- S. Liu, B. Yu and T. Zhang, Electrochim. Acta, 2013, 102, 104–107 CrossRef CAS PubMed
.
- L. Fu and Z. Fu, Ceram. Int., 2015, 41, 2492–2496 CrossRef CAS PubMed
.
- L. Fu, Y. Zheng, Q. Ren, A. Wang and B. Deng, J. Ovonic Res., 2015, 11, 21–26 Search PubMed
.
- X. Lu, H. Bai, Q. Ruan, M. Yang, G. Yang, L. Tan and Y. Yang, Int. J. Environ. Anal. Chem., 2008, 88, 813–824 CrossRef CAS
.
- K. S. Novoselov, A. K. Geim, S. V. Morozov, D. Jiang, Y. Zhang, S. V. Dubonos, I. V. Grigorieva and A. A. Firsov, Science, 2004, 306, 666–669 CrossRef CAS PubMed
.
- X. Ma, M. Chao and Z. Wang, Anal. Methods, 2012, 4, 1687–1692 RSC
.
- C. Shan, H. Yang, D. Han, Q. Zhang, A. Ivaska and L. Niu, Biosens. Bioelectron., 2010, 25, 1070–1074 CrossRef CAS PubMed
.
- J. M. Pingarrón, P. Yáñez-Sedeño and A. González-Cortés, Electrochim. Acta, 2008, 53, 5848–5866 CrossRef PubMed
.
- A. Afkhami, F. Soltani-Felehgari and T. Madrakian, Talanta, 2014, 128, 203–210 CrossRef CAS PubMed
.
- X. Wang, Y. Wen, L. Lu, J. Xu, L. Zhang, Y. Yao and H. He, Electroanalysis, 2014, 26, 648–655 CrossRef CAS
.
- F. Cui and X. Zhang, J. Electroanal. Chem., 2012, 669, 35–41 CrossRef CAS PubMed
.
- Y. Chen, Y. Li, D. Sun, D. Tian, J. Zhang and J.-J. Zhu, J. Mater. Chem., 2011, 21, 7604–7611 RSC
.
- P. T. Do, P. Q. Do, H. B. Nguyen, V. C. Nguyen, D. L. Tran, T. H. Le, L. H. Nguyen, H. V. Pham, T. L. Nguyen and Q. H. Tran, J. Mol. Liq., 2014, 198, 307–312 CrossRef CAS PubMed
.
- A.-L. Liu, G.-X. Zhong, J.-Y. Chen, S.-H. Weng, H.-N. Huang, W. Chen, L.-Q. Lin, Y. Lei, F.-H. Fu, Z.-L. Sun, X.-H. Lin, J.-H. Lin and S.-Y. Yang, Anal. Chim. Acta, 2013, 767, 50–58 CrossRef CAS PubMed
.
- G. Sun, J. Lu, S. Ge, X. Song, J. Yu, M. Yan and J. Huang, Anal. Chim. Acta, 2013, 775, 85–92 CrossRef CAS PubMed
.
- Y. Hu, J. Jin, P. Wu, H. Zhang and C. Cai, Electrochim. Acta, 2010, 56, 491–500 CrossRef CAS PubMed
.
- W. S. Hummers and R. E. Offeman, J. Am. Chem. Soc., 1958, 80, 1339 CrossRef CAS
.
- T. Gan and S. Hu, Microchim. Acta, 2011, 175, 1–19 CrossRef CAS
.
- J. I. Paredes, S. Villar-Rodil, A. Martínez-Alonso and J. M. D. Tascón, Langmuir, 2008, 24, 10560–10564 CrossRef CAS PubMed
.
- X. C. Lv and J. Weng, Sci. Rep., 2013, 3, 3285 Search PubMed
.
- D. Graf, F. Molitor, K. Ensslin, C. Stampfer, A. Jungen, C. Hierold and L. Wirtz, Nano Lett., 2007, 7, 238–242 CrossRef CAS PubMed
.
- X. Li, Q. Wang, Y. Zhao, W. Wu, J. Chen and H. Meng, J. Colloid Interface Sci., 2013, 411, 69–75 CrossRef CAS PubMed
.
- H. N. Tien, V. H. Luan, L. T. Hoa, N. T. Khoa, S. H. Hahn, J. S. Chung, E. W. Shin and S. H. Hur, Chem. Eng. J., 2013, 229, 126–133 CrossRef CAS PubMed
.
- R. K. Shervedani and A. Amini, Electrochim. Acta, 2014, 121, 376–385 CrossRef CAS PubMed
.
- J. Lee, K. S. Novoselov and H. S. Shin, ACS Nano, 2010, 5, 608–612 CrossRef PubMed
.
- T. Nakajima, A. Mabuchi and R. Hagiwara, Carbon, 1988, 26, 357–361 CrossRef CAS
.
- D. Chen, L. Li and L. Guo, Nanotechnology, 2011, 22, 055705 CrossRef PubMed
.
- E. Laviron, J. Electroanal. Chem., 1979, 101, 19–28 CrossRef CAS
.
- E. Laviron, J. Electroanal. Chem., 1974, 52, 355–393 CrossRef CAS
.
- A. J. Bard and L. R. Faulkner, Electrochemical Methods: Fundamentals and Applications, Wiley, 2nd edn, 1980 Search PubMed
.
Footnote |
| † Electronic supplementary information (ESI) available. See DOI: 10.1039/c4ra15872e |
| This journal is © The Royal Society of Chemistry 2015 |

