
Low-temperature synthesis and electrophoretic deposition of shape-controlled titanium dioxide nanocrystals†
Vincent Jouenne,
Jean-Luc Duvail,
Luc Brohan,
Eric Gautron and
Mireille Richard-Plouet*
Institut des Matériaux Jean Rouxel, Université de Nantes, CNRS, 2 rue de la Houssinière, BP 32229, 44322 Nantes cedex 3, France. E-mail: Mireille.Richard@cnrs-imn.fr
First published on 26th January 2015
Abstract
A comprehensive, low-temperature strategy for obtaining optimized, dense and nanostructured TiO2 thin films is proposed. The nanocrystals of anatase-TiO2 were prepared from highly reactive crystals of [Ti8O12(H2O)24]Cl8, HCl, 7H2O, a preferred titanium precursor for replacing alkoxides. Oleic acid and oleylamine were employed as capping ligands in order to control the shape and the size of TiO2 nanocrystals during solvothermal treatment. Following an acid treatment, the ligands were removed from the surface of the nanocrystals, thereby enabling their re-dispersion in an ethanol-based charging solution. The stable transparent colloidal solutions were suitable for electrophoretic deposition of the nanocrystals (<15 nm in size) on conductive substrates. Transparent layers of TiO2 nanocrystals, without post-annealing, were successfully prepared under low bias voltage (10 V) with thicknesses of up to 2 μm within a mere 10 min.
Introduction
In the past few decades, research on titanium dioxide (TiO2) nanomaterials has been largely motivated by their unique and tunable photoactive properties, which allow for many applications in a wide range of fields, such as photocatalysis, photochromic devices, energy storage, gas sensing, self-cleaning agents and photovoltaics.1–6 Particularly with respect to thin film preparation, the control of its thickness, microstructure and crystallinity is crucial to enhancing the density of reactive sites, as well as the charge transport across the TiO2 network.7 Amongst the different techniques used to grow titania layers, such as sol–gel technology,8 evaporation self-assembly,9 electrodeposition10 or spray-pyrolysis,11 electrophoretic deposition (EPD) has gained ever-increasing interest in recent years for its simple apparatus, versatility, low cost and high potential for scaling up to suit industry needs.12–17 Under an electric field, the progressive accumulation and agglomeration of charged NPs at the opposite charged electrode allow for the elaboration of the film. Unlike common coating methods, which generally require post-annealing to crystallize TiO2 (T > 450 °C) and to eliminate organic residues, EPD is performed at room temperature from colloidal suspensions with crystallized nanocrystals (NCs) and post-treatments do not exceed 150 °C.18,19EPD became the focus of much attention with the advent of colloidal suspensions, and initially with commercial TiO2 nanopowders.20–25 Generally, this approach leads to polydisperse colloidal suspensions containing mostly TiO2 agglomerates (up to the micron scale) of primary NCs (5–50 nm).26 After EPD, the resulting films may exhibit high roughness and low transparency. More recently, using bio-inspired modifying agents was proven to provide a stable suspension that is suitable for EPD.27 However, there are very few reports to date that investigate both the synthesis and the redispersion of TiO2 nanocrystals as stable colloidal suspensions for EPD.28 Since it is possible to achieve accurate control over the surface charge of the NCs throughout the process, a higher degree of dispersion and stability is expected.29
Moreover, the size, shape and phase of TiO2 NCs can be tailored. In particular, surfactant-assisted solution-based approaches have been reported as an efficient method to control hydrolysis and condensation of the most common Ti(IV) precursors, including titanium alkoxides, under mild conditions.16–23 In this approach, surfactants selectively adsorb on specific crystal facets and control the polycondensation of the titania network by inhibiting certain growth directions, thereby leading to anisotropic NCs.30,31 Cozzoli and co-workers32–34 and Joo et al.35 developed low-temperature processes to form TiO2 NCs of various shapes with the help of structure-directing agents like oleic acid (OA) and oleylamine (OM). Recently, Dinh et al. recounted the synthesis of shape-tailored monodisperse titania NCs with Ti butoxide, under mild solvothermal conditions and in the presence of OA and OM.36 Nevertheless, developing a simple, low-temperature and cost-effective process for elaborating TiO2 thin films containing well-crystallized TiO2 NCs remains challenging.
In previous investigations, TiO2 NCs were obtained by hydrolysing the laboratory-made Ti precursor, titanium oxychloride hydrate [Ti8O12(H2O)24]Cl8·HCl·7H2O (hereafter denoted by Ti8O12) with tetramethylammonium hydroxide under autogenous conditions at 120 °C.37 In comparison with commonly used Ti sources, Ti8O12 has added advantages in that it is also moisture-resistant, easy to handle and soluble in polar solvents. Therefore, the use of inert atmosphere is not necessary. Herein we explore a low-temperature approach for elaborating dense and nanostructured TiO2 films on tin-doped indium oxide (ITO) deposited on glass. A new synthesis strategy involving the surfactant-assisted hydrolysis of Ti8O12 under mild solvothermal conditions is investigated. Optimized solvothermal parameters lead to shape-controlled and monodispersed TiO2 anatase NCs. This method also involves a simple procedure to remove surfactants, i.e. OA and OM, which are adsorbed at the surface of the as-synthesized NCs. These nanocrystals are successfully used to process TiO2 coatings by EPD at unusually low voltage (10 V) from stable colloidal solutions, prepared by dispersing the uncapped NCs in polar solvents.
Experimental section
Synthesis of shape-controlled TiO2 nanocrystals, NCs
Centimetric crystals of [Ti8O12(H2O)24]Cl8·HCl·7H2O were obtained over a five-week period by slow hydrolysis of a commercial TiOCl2 solution (Cristal Global-Millennium Inorganic Chemical), and by fixing the relative humidity at 50%. A detailed synthesis of this precursor has already been reported elsewhere.37,38 In the present study, a surfactant-assisted solvothermal process is optimized by using [Ti8O12(H2O)24]Cl8·HCl·7H2O as the titanium precursor, oleic acid (OA) and oleylamine (OM) as surfactants, and ethanol as solvent. According to previous studies on this precursor, its decomposition can be written as follows:| [Ti8O12(H2O)24]Cl8·HCl·7H2O → 8TiO2 + 9HCl + 27H2O | (1) |
After consideration of this equation, the initial amount of ethanol was calculated to achieve an azeotropic mixture39 (ethanol–water, 96% ethanol by volume), taking the expected water release into account. Typically, 6.25 × 10⁻⁴ mol (0.909 g) of [Ti8O12(H2O)24]Cl8·HCl·7H2O is dissolved in 1.44 × 10⁻¹ mol (6.647 g) of absolute ethanol by stirring for 1 h 30 min at room temperature, in a 40 mL closed vessel. Oleylamine (OM) is introduced into the initial mixture to neutralise the acidity of the precursor, according to eqn (1). Appropriate amounts of oleic acid and oleylamine are then added to the precursor solution, thereby yielding a white precipitate. The influence of the surfactants was evaluated through adjustment of the molar ratio R = OA/OM. The obtained solution is vigorously stirred for 30 min and then transferred to a PTFE-liner stainless steel autoclave. The solvothermal treatment is conducted at 120–180 °C for 18 h. The resulting off-white precipitate, obtained after the solvothermal treatment, is then collected by centrifugation and washed several times with a mixture of ethanol–acetone (50/50, v/v) in order to remove the excess non-reacting surfactants, and is finally air-dried at 100 °C for 12 h.
Preparation of stable colloidal TiO2 solutions
Firstly, each sample of the as-synthesized powder is dispersed in nitric acid (100 mL, 0.1 mol L−1 HNO3), set in an ultrasonic bath for 1 h, and then magnetically stirred for at least 48 h at room temperature. The white, milky solution containing the NCs progressively turns into a white, opalescent, colloidal suspension. The resulting solution is washed twice by extraction with n-decane (>99%, CARLO ERBA) to remove the remaining surfactants from the TiO2 suspension. The aqueous phase of TiO2 is collected and kept for 1 night before redispersion. The as-obtained colloidal suspension is translucent, indicating that a stable colloidal suspension of TiO2 has been formed in a diluted acidic solution (see Fig. S1(a) as ESI†).To produce a stable colloidal solution for EPD, an excess of acetone (25 mL) is added to few millilitres of the latter solution to allow its flocculation. In the next step, the TiO2 powder is collected by centrifugation (10![[thin space (1/6-em)]](https://www.rsc.org/images/entities/char_2009.gif) 000 rpm, 10 min) and washed twice with acetone, before being redispersed in 30 mL of an ethanol-based charging solution.18,23 Iodine (54 mg), Milli-Q water (4 mL) and acetone (8 mL) are mixed together in absolute ethanol (200 mL) and vigorously stirred for at least 2 days. The initial dark orange solution becomes progressively uncoloured, indicating that the reaction between acetone and iodine is complete. Finally, mixing the obtained charging solution with titania NCs, followed by an ultrasonic treatment for 2 h with a probe, yields a translucent and stable colloidal solution (see Fig. S1(b) in ESI†). The stability of the suspensions containing the TiO2 NCs is sustainable for over 1 month.
000 rpm, 10 min) and washed twice with acetone, before being redispersed in 30 mL of an ethanol-based charging solution.18,23 Iodine (54 mg), Milli-Q water (4 mL) and acetone (8 mL) are mixed together in absolute ethanol (200 mL) and vigorously stirred for at least 2 days. The initial dark orange solution becomes progressively uncoloured, indicating that the reaction between acetone and iodine is complete. Finally, mixing the obtained charging solution with titania NCs, followed by an ultrasonic treatment for 2 h with a probe, yields a translucent and stable colloidal solution (see Fig. S1(b) in ESI†). The stability of the suspensions containing the TiO2 NCs is sustainable for over 1 month.
Electrophoretic deposition (EPD) of TiO2 NCs
The EPD setup consisted of one ITO/glass substrates (RMS = 1 nm) and a Pt-foil as cathode and anode, respectively, which were arranged in a parallel configuration with a separation distance of 0.8 cm. The colloidal TiO2 solution was poured inside a glass vessel. The electric field was applied through a potentiostat/galvanostat (PARSTAT 2273, Princeton Applied Research) in a two-electrode constant voltage mode. The EPD duration ranged from 30 s to 10 min, and the constant applied voltage was 10 V. After EPD, the thus coated substrates were carefully removed (withdrawal rate ≈ 60 mm min−1) from the solution while maintaining the applied voltage. Next, the coatings were first air-dried at room temperature overnight and then heated to 120 °C for 6 h to completely remove the residual solvents. The latter low-temperature drying process helps to minimize strain induced by the capillary forces generated during this step, and thus prevents cracking, particularly so in the case of thick deposits.16Characterisation
The morphology and crystallinity of TiO2 NCs were determined by analysing the images recorded with a Hitachi H9000NAR High Resolution Transmission Electron Microscope (HRTEM) operating at 300 kV with a Scherzer resolution of 1.8 Å. TiO2 suspensions were obtained from the dried powders after dispersing in toluene and ultrasonicating for 15 min. A copper grid covered with a holey carbon film was dipped in the selected suspension and dried at room temperature.XRD data was collected using a Bruker D8 Advance diffractometer (Cu Kα radiation) in Bragg–Brentano geometry (2θ = 5 to 80°, step 0.01°, 1 s per step). XRD pattern refinements were carried out with the JANA2006 program.40 This program permits the estimation the average crystallite size of the samples. For each pattern, Rietveld refinement was performed by using the fundamental approach, and Lorentzian peak-shape functions for fitting. A Raman spectroscopy study was performed under excitation at 1064 nm with a Bruker RFS 100 FT-Raman spectrometer.
The presence of residual surfactants was checked by performing thermogravimetric analyses (TGA) under air at a 5 K min−1 heating rate, using a Setaram TG 92. The nature of capping ligands was also determined from infrared spectra recorded with a FTIR Nicolet 20 SXC spectrometer in the 400–4000 cm−1 range. After air-drying at 100 °C overnight, the powder was ground with dried KBr and then pressed into a pellet (1.3 cm in diameter) suitable for transmission mode. The stability of colloidal solutions was examined by dynamic light scattering, DLS, using a Malvern Zetasizer Nano instrument. This equipment allows one to determine both the size and the zeta potential of colloidal solutions. The morphology of the deposits was studied by Scanning Electron Microscopy (SEM) using a JEOL 7600F operating at 5 kV. Thicknesses were measured from films which were fixed onto dedicated sample holders, and positioned so that their surfaces were parallel to the incident beam. Topography images were recorded in the tapping mode in air using an atomic force microscope (Multimode 8, Nanoscope V, Brüker). The Image Processing software (Nanoscope v.9) from Bruker was used to evaluate the surface RMS roughness (analyzed area at the films surface: 500 × 500 nm2). UV-vis spectra were recorded in transmission mode using a Perkin Elmer Lambda 1050 UV-vis-NIR spectrophotometer.
Results and discussion
Effect of the surfactants on the morphology of anatase nanoparticles
In a preliminary study aimed at selecting the optimal solvothermal temperature, the effect of the temperature on the crystallinity of the anatase TiO2 NCs was studied for the sample R = 0/5 (i.e. without OA as R = OA/OM) from 120 to 180 °C (see Fig. S2, ESI†). It appears that the crystallinity is improved with increasing temperature. In particular, no crystalline TiO2 can be identified at the XRD scale for T = 120 °C. The temperature of the solvothermal treatment was, therefore, fixed at 180 °C. Fig. 1 shows the XRD patterns obtained from powders synthesized with different molar ratios, R = OA/OM at T = 180 °C for 18 h. | ||
| Fig. 1 XRD patterns obtained from powders with different molar ratios, R = OA/OM at T = 180 °C: (a) 0/5, (b) 3/7, (c) 5/5 and (d) 5/0, and, by way of comparison, theoretical diffracted intensities for randomly-oriented anatase powder (e) (JCPDF 89-4921). | ||
The reflection peaks of all the samples are characteristic of pure anatase (Fig. 1), which is confirmed by Raman spectroscopy experiments (Fig. S3, ESI†). As seen in Fig. 1, the XRD patterns exhibit a gradual decrease in the relative intensity and a broadening of diffraction peaks when R increases, which can be attributed to a decrease of the mean crystallite domain size. Structural parameters obtained from Rietveld refinements with JANA are summarised in Table 1. As shown in Table 1, the crystallite size along the [100] or [010] axis is smaller than in other directions, especially for low R values. It is worth noting that the average crystallite sizes are in good agreement with the crystal width estimated from TEM images (see TEM study and Table S1, ESI†).
Fig. 2 shows the distinct types of morphology of TiO2 NCs achievable for different R values at T = 180 °C, from a HRTEM study. When the amount of OA is high, the reaction leads to the formation of ellipsoidal-shaped anatase NCs (Fig. S4(a)†). However, for an equimolar ratio between both surfactants, NCs exhibit uniform truncated rhombic morphology (Fig. S4(b)†). With only oleylamine in the reaction mixture (R = 0/5), larger NCs with a rhombic shape are obtained (Fig. S4(c)†). A similar evolution of the morphology of TiO2 NCs as a function of R = OA/OM with titanium butoxide as the Ti precursor, was reported by Dinh et al.36 The particle size distribution was plotted by measuring around 100 individual NCs from TEM images, and was fitted with a Gaussian distribution. The mean particle sizes (see Table S2†) obtained by TEM are similar to those extracted from XRD data: centred at 4.5 nm, 7.5 nm, 11 nm and 19 nm for R = 7/3, 5/5, 3/7 and 0/5, respectively. Significantly, a good monodispersity for all samples is obtained, particularly for low R values as shown in Fig. S4(d).† Indeed, the TiO2 NCs obtained in more acidic conditions with a majority of OA, exhibit a narrow size distribution in the range of 3 to 6 nm. However, an increase in the amount of OM in the reaction medium produces a broader size distribution with a progressive increase of the mean NC diameter from 4.5 (R = 7/3) to 19.1 nm (R = 0/5) (see Fig. S4(d)†). These observations could be attributed to an increase in the pH when R is low. It is proposed that a higher basicity of the initial solution favours the condensation/dissolution processes by providing more OH− ions, originally released by the reaction between OM and water.
 | ||
| Fig. 2 Representative HRTEM images (yellow: {101} planes), corresponding FFT and simulated electron diffraction patterns for R = 7/3 along the [111] zone axis (a–c), R = 5/5 (d–f) and R = 0/5 (g–i) along the [100] zone axis. | ||
In order to obtain local characterisation, high resolution TEM images of individual NCs for different R values were collected, as shown in Fig. 2. The corresponding fast Fourier transformed (FFT) and theoretical electron diffraction (ED) patterns are also grouped in Fig. 2. This study provides insight into the exposed facets and the crystallinity of TiO2 NCs. The FFT patterns of each image (Fig. 2b, e and h) are no different from the theoretical ED pattern of standard anatase, indicating that the particles are single crystals. Fig. 2a–c show that in an excess of oleic acid, the crystals are mainly oriented along the [111] zone axis, therefore exposing the {111} facets perpendicularly. These platelets are laterally limited by the {110} and {101} faces. Such morphologies were attributed to the ability of OA and OM to attach to high-energy surfaces, leading to their preservation during growth.36 Their attachment was confirmed by IR spectrometry of the stretching vibrations: at 1550 & 1610 cm−1 for NH2 and NH3+, respectively, and νs COO− at 1410 and 1429 cm−1, νas COO− at 1525 cm−1. The difference, Δν = νas − νs, in the range of 100 cm−1 indicates that oleate anions are coordinated to the Ti cation in a bidendate manner.41 The Ti4+ cations terminating the {110} and {111} faces are 4-fold coordinated, and their octahedral coordination may be completed by carboxylate species, as schematically depicted in Fig. 3. The HRTEM images for higher R values (Fig. 2d–i) exhibit well-facetted truncated rhombic NCs with mainly {101} and {001} exposed crystallographic planes and a growth direction along the c-axis. All these samples present NCs which are mostly oriented along the [100] zone axis, as is expected when OM is the major structuring agent. Based on the HRTEM analysis, the relative percentages of exposed {001} and {101} faces as a function of R were calculated (see ESI for details, Fig. S5†). These calculations reveal that the exposed {101} faces become more dominant than the {001} crystal facets when R decreases, with a relative percentage for {001} which changes from 11 to 5% for R = 5/5 and R = 0/5, respectively. The change of the crystal facet orientation as function of R could be due to the difference in the nature and amount of surfactants in the solution, since OA and OM have distinctive binding abilities. Indeed, for TiO2, OA and OM tend to bind preferentially to the anatase {001} and {101} planes, respectively.36 Depending on the R value, OA and/or OM molecules remain attached to TiO2 after the first washing step, demonstrating their strong bonds (see FTIR spectroscopy and TGA study). Thus, the selective adsorption of these surfactants to different facets could promote growth in perpendicular directions. This clearly indicates the crucial role of the ratio, R, in the control of particle morphology. These results show the efficiency of OA and OM as shape controllers for the synthesis of TiO2 nanocrystals, starting with the inorganic precursor [Ti8O12(H2O)24]Cl8·HCl·7H2O. The positions and attributions of the FT-IR bands for powders prepared with different synthetic conditions and post-treatments are grouped in Table S3 and plotted in Fig. S6 (see ESI†). The fact that the characteristic peaks of the surfactants (νs COO− at 1410 and 1429 cm−1, νas COO− at 1525 cm−1 and 1550 & 1610 cm−1 for NH2 and NH2+, respectively) are no longer detected after acid treatment, whereas an intense peak (νas NO3− at 1385 cm−1) exists together with the increase of the relative intensity of the peaks attributed to absorbed water (i.e. 3400, 3200 and 1620 cm−1), indicates that the adsorbed surfactants are mostly replaced by adsorbed nitrate and water molecules during the acid treatment. This analysis was confirmed by thermogravimetry (Fig. S7 in ESI†).
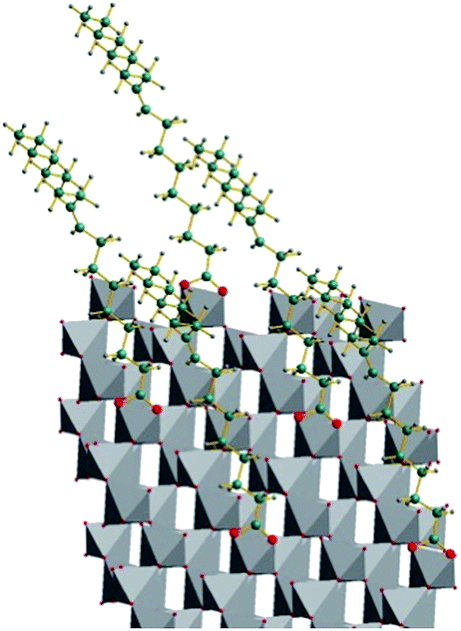 | ||
| Fig. 3 Schematic view of the possible complexation of oleates at the (111) surface of anatase. | ||
Size distribution and stability of colloidal solutions for EPD
In order to obtain coatings by EPD, a stabilized colloidal solution, with the presence of only small aggregates or particles and a low ionic strength, is required, and this is ideally achieved in organic solvents such as alcohols or ketones.19 Ethanol-based solutions containing appropriate amounts of iodine, acetone and water are able to tune the charge of particles owing to the presence of free H+ in solution which allows for cathodic EPD, as has been widely reported.12,18,23,42Fig. 4 illustrates the 2-step redispersion process for making TiO2 colloidal solutions containing TiO2 NCs (R = 0/5, T = 180 °C) for EPD. The hydrophobic shell of the as-prepared NCs, originating from the adsorbed oleylamine, hinders their stabilisation as a colloidal solution in polar solvents and leads to sedimentation. Then, as already stated above, the adsorbed oleylamine molecules are removed from the NCs surface during the acidic treatment. The resulting colloidal solutions are stable in acidic media. In the last step, the resulting surfactant-free and hydrophilic TiO2 NCs are stabilized as a colloidal solution in the EtOH-based charging solution. The stability of the colloidal solution is proven by the value of the zeta potential (ξ) at around +40 mV. As expected, the adsorption of protons at the surface of TiO2 NCs confers a positive charge to the NCs that is higher than the accepted limit of stability (i.e. ±30 mV) for colloidal solutions. Nevertheless, as determined from the DLS study, the distribution of particle sizes is broad and centred around 50 nm (Fig. S8, ESI†), which is larger than the size deduced from TEM and XRD on as-prepared NCs. In fact, for the same sample, the size distribution is centered at 27 nm, indicating that the degree of agglomeration in suspension is limited to six particles. Thus, a small aggregation of the NCs occurred during the redispersion process, and this fact is confirmed by TEM analysis (see Fig. S9, ESI†). The resulting colloidal solutions remain stable after one month of storage, which is beneficial with respect to application in coating processes.
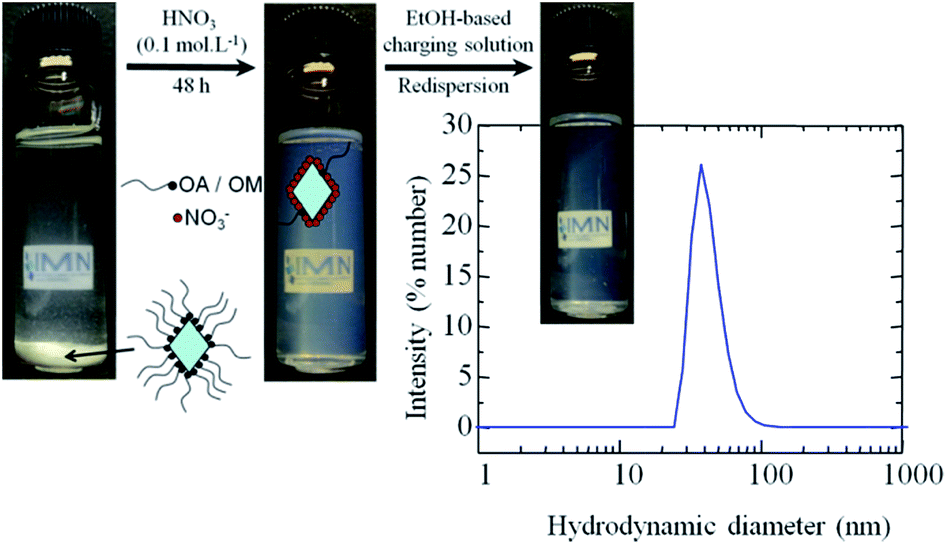 | ||
| Fig. 4 Schematic representation of the redispersion process: aspect of colloidal solutions with oleylamine-capped TiO2 nanocrystals (R = 0/5), after acid and after redispersion in the EtOH-based solution. For the latter, the corresponding distribution of particle sizes measured by dynamic light scattering measurement is also shown. | ||
Electrophoretic deposition of TiO2 NCs
The colloidal solution obtained after acid treatment and redispersion in the EtOH-based solution was used to perform electrophoretic deposition under an applied voltage of +10 V, between an ITO cathode and a platinum foil as counter electrode, which were separated by 0.8 cm. Fig. 5 shows SEM images of the TiO2 films obtained by EPD on ITO/glass after drying. From these images, we can note that the EPD layer exhibits a dense, yet porous morphology, which consists of tightly packed TiO2 NCs with an approximate film thickness of 550 nm after 4 min of deposition (Fig. 5a and b). The thickness is uniform over the deposit, in agreement with the flatness of the surface. The NCs are clearly distinguishable in the cross-section view, with a size distribution corresponding well to that determined by DLS study. | ||
| Fig. 5 SEM images for deposits prepared from TiO2 colloidal solutions (R = 0/5) by EPD (10 V, 4 min) on ITO/glass substrate (a) top view, (b) cross-section, and (c) evolution of the film thickness with deposition time. | ||
As expected, the thickness of the layer increases quite linearly along with the deposition time in this range. According to Sarkar and Nicholson14 and Anné et al.,43 the deposit growth behaviour can be approximated by a linear model at short deposition times, similar to Hamaker's description.12,44 Here, the deposition rate is about 2 nm s−1 during the first five minutes. For longer deposition times, an increase of the deposition rate is observed, which is not predicted by the models cited above. This is accompanied by the appearance of a translucent cloudy zone in the vicinity of the working electrode, and could be ascribed to a slight field-induced re-aggregation of particles over time, related to a higher concentration of particles near the cathode during the process. Thus, the deposition of larger agglomerates would lead to thicker films. The porosity is difficult to precisely measured but the evolution of surface roughness is in agreement with this interpretation. Actually, the RMS roughness evolves from 3–4 nm for films deposited for less than 2 min and increases to 6 nm (Fig. S10, ESI†) and finally to 12 nm when the electric field is applied for longer durations. Such deposition rates provide the opportunity for fairly precise control over the deposition thickness from nanometre to micrometre within a reasonable time scale (Fig. 5c). Advantageously, a reasonably slow deposition yield can lead to tighter and more uniform layers because the NCs are deposited slowly and individually.13
The optical properties of TiO2 films were investigated by UV-visible spectroscopy measurements (see Fig. 6 and S11†). The transmittance of the thinnest film (e = 70 nm) is larger than 90% in the 450–800 nm range. These results are comparable to those obtained by PVD-deposited TiO2 thin films.45,46 However, a progressive decrease of 10% is observed between 450 nm and 360 nm. The slight coloration of the layer can be attributed to remaining adsorbed surfactants and/or iodine. For the thickest films (e = 320 nm) and (e = 1570 nm), the transmission is also slightly reduced over the whole range. This could originate from the lower density of the films and the resulting light scattering when, only a low-temperature annealing is processed (T = 120 °C). Generally, either mechanical compression or high-temperature annealing post-treatments are needed to promote a good sintering and transparency of such thick layers.20,22
 | ||
| Fig. 6 UV-visible spectra for TiO2 films deposited on ITO/glass substrate for the various thicknesses: 70 (black), 320 (red) and 1570 (green) nm. | ||
The value of the band gap can be obtained from the transmittance curves by plotting A(hν)1/2 versus hν, where A is a constant, and then extrapolating to zero as shown in Fig. S11† (t = 7 min). The band gap is at around 3.3 eV, which is in very good agreement with the theoretical value of 3.2 eV for anatase. The blue shift of 0.1 eV is attributed to the quantum size effect of the TiO2 nanocrystals, which indicates that, despite aggregation, the individual character of the TiO2 nanocrystals is conserved after the coating via EPD.
Conclusions
In summary, we have demonstrated the applicability of the surfactant-assisted solvothermal synthesis to the hydrolysis of the precursor [Ti8O12(H2O)24]Cl8·HCl·7H2O at low temperature in alcoholic media. By accurate control of the synthetic parameters including temperature, T, and the molar ratio, R = oleic acid/oleylamine, highly crystalline anatase nanocrystals were synthesized preferentially exposing the {101} and {001} facets at T = 180 °C, particularly when R ≤ 5/5. Additionally, we have shown that it is possible to remove the capping ligands from the NCs by a simple treatment in dilute nitric acid. Following the redispersion step in an ethanolic bath, electrophoretic deposition was successfully performed at remarkably low voltage and concentration, yielding uniform TiO2 layers with a controllable thickness of up to 2.2 μm within a short deposition time. Most significantly, this all-encompassing, low-temperature process is a promising strategy with respect to avoiding high-temperature post-treatment. Further studies will focus on the integration of these layers into third generation solar cells in order to evaluate their performance as blocking and collecting layers.Acknowledgements
The authors would like to thank N. Stephant and L. Nguyen for the SEM, S. Grolleau and F. Lari for the TGA, and Dr P.-E. Petit for the XRD and Dr M. Carette for AFM measurements. V. Jouenne is indebted to the Région Pays de la Loire (PERLE2 network) and to the CNRS for the PhD grant. This work was also supported by the Nanofonc network and the CNRS.Notes and references
- X. Chen and S. S. Mao, Chem. Rev., 2007, 107, 2891–2959 CrossRef CAS PubMed.
- A. Kubacka, M. Fernández-García and G. Colón, Chem. Rev., 2012, 112, 1555–1614 CrossRef CAS PubMed.
- Y. Ohko, T. Tatsuma, T. Fujii, K. Naoi, C. Niwa, Y. Kubota and A. Fujishima, Nat. Mater., 2003, 2, 29–31 CrossRef CAS PubMed.
- B. O'Regan and M. Gratzel, Nature, 1991, 353, 737–740 CrossRef.
- B. Xi, L. K. Verma, J. Li, C. S. Bhatia, A. J. Danner, H. Yang and H. C. Zeng, ACS Appl. Mater. Interfaces, 2012, 4, 1093–1102 CAS.
- X. Chen and A. Selloni, Chem. Rev., 2014, 114, 9281–9282 CrossRef CAS PubMed , and references included in this volume.
- J. L. Vivero-Escoto, Y.-D. Chiang, K. C.-W. Wu and Y. Yamauchi, Sci. Technol. Adv. Mater., 2012, 13, 013003 CrossRef.
- P. Hartmann, D.-K. Lee, B. M. Smarsly and J. Janek, ACS Nano, 2010, 4, 3147–3154 CrossRef CAS PubMed.
- E. Lancelle-Beltran, P. Prené, C. Boscher, P. Belleville, P. Buvat, S. Lambert, F. Guillet, C. Boissière, D. Grosso and C. Sanchez, Chem. Mater., 2006, 18, 6152–6156 CrossRef CAS.
- B. A. Gregg, F. Pichot, S. Ferrere and C. L. Fields, J. Phys. Chem. B, 2001, 105, 1422–1429 CrossRef CAS.
- C. Jiang, M. Y. Leung, W. L. Koh and Y. Li, Thin Solid Films, 2011, 519, 7850–7854 CrossRef CAS PubMed.
- L. Besra and M. Liu, Prog. Mater. Sci., 2007, 52, 1–61 CrossRef CAS PubMed.
- A. Chávez-Valdez and A. R. Boccaccini, Electrochim. Acta, 2012, 65, 70–89 CrossRef PubMed.
- P. Sarkar and P. S. Nicholson, J. Am. Ceram. Soc., 1996, 79, 1987–2002 CrossRef CAS PubMed.
- I. Corni, M. P. Ryan and A. R. Boccaccini, J. Eur. Ceram. Soc., 2008, 28, 1353–1367 CrossRef CAS PubMed.
- J. H. Dickerson and A. R. Boccaccini, Electrophoretic Deposition of Nanomaterials, Springer Science & Business Media, 2011 Search PubMed.
- Y. S. Joung and C. R. Buie, Langmuir, 2011, 27, 4156–4163 CrossRef CAS PubMed.
- L. Grinis, S. Dor, A. Ofir and A. Zaban, J. Photochem. Photobiol., A, 2008, 198, 52–59 CrossRef CAS PubMed.
- L. Grinis, S. Kotlyar, S. Rühle, J. Grinblat and A. Zaban, Adv. Funct. Mater., 2010, 20, 282–288 CrossRef CAS.
- H. Chang, H.-T. Su, W.-A. Chen, K. David Huang, S.-H. Chien, S.-L. Chen and C.-C. Chen, Sol. Energy, 2010, 84, 130–136 CrossRef CAS PubMed.
- H.-W. Chen, C.-P. Liang, H.-S. Huang, J.-G. Chen, R. Vittal, C.-Y. Lin, K. C.-W. Wu and K.-C. Ho, Chem. Commun., 2011, 47, 8346–8348 RSC.
- L.-C. Chen, J.-M. Ting, Y.-L. Lee and M.-H. Hon, J. Mater. Chem., 2012, 22, 5596–5601 RSC.
- S. Dor, S. Rühle, A. Ofir, M. Adler, L. Grinis and A. Zaban, Colloids Surf., A, 2009, 342, 70–75 CrossRef CAS PubMed.
- C. K. Lin, T. J. Yang, Y. C. Feng, T. T. Tsung and C. Y. Su, Surf. Coat. Technol., 2006, 200, 3184–3189 CrossRef CAS PubMed.
- S. Lebrette, C. Pagnoux and P. Abélard, J. Eur. Ceram. Soc., 2006, 26, 2727–2734 CrossRef CAS PubMed.
- N. Mandzy, E. Grulke and T. Druffel, Powder Technol., 2005, 160, 121–126 CrossRef CAS PubMed.
- M. S. Ata, Y. Liu and I. Zhitomirsky, RSC Adv., 2014, 4, 22716 RSC.
- D. L. Liao, G. S. Wu and B. Q. Liao, Colloids Surf., A, 2009, 348, 270–275 CrossRef CAS PubMed.
- I. Gonzalo-Juan, A. J. Krejci and J. H. Dickerson, Langmuir, 2012, 28, 5295–5301 CrossRef CAS PubMed.
- M. D'Arienzo, J. Carbajo, A. Bahamonde, M. Crippa, S. Polizzi, R. Scotti, L. Wahba and F. Morazzoni, J. Am. Chem. Soc., 2011, 133, 17652–17661 CrossRef PubMed.
- N. Roy, Y. Sohn and D. Pradhan, ACS Nano, 2013, 7, 2532–2540 CrossRef CAS PubMed.
- R. Buonsanti, E. Carlino, C. Giannini, D. Altamura, L. De Marco, R. Giannuzzi, M. Manca, G. Gigli and P. D. Cozzoli, J. Am. Chem. Soc., 2011, 133, 19216–19239 CrossRef CAS PubMed.
- P. D. Cozzoli, A. Kornowski and H. Weller, J. Am. Chem. Soc., 2003, 125, 14539–14548 CrossRef CAS PubMed.
- P. D. Cozzoli, T. Pellegrino and L. Manna, Chem. Soc. Rev., 2006, 35, 1195–1208 RSC.
- J. Joo, S. G. Kwon, T. Yu, M. Cho, J. Lee, J. Yoon and T. Hyeon, J. Phys. Chem. B, 2005, 109, 15297–15302 CrossRef CAS PubMed.
- C.-T. Dinh, T.-D. Nguyen, F. Kleitz and T.-O. Do, ACS Nano, 2009, 3, 3737–3743 CrossRef CAS PubMed.
- C.-E. Liu, A. Rouet, H. Sutrisno, E. Puzenat, H. Terrisse, L. Brohan and M. Richard-Plouet, Chem. Mater., 2008, 20, 4739–4748 CrossRef CAS.
- L. Brohan, H. Sutrisno, E. Puzenat, A. Rouet and H. Terrisse, French CNRS Patent 0305619, May 9, 2003; November 25, 2004; European CNRS patent (EP) 04 742 604.4, November 24, 2005; Japan (JP) CNRS Patent 2006-530327, October 16, 2006; United States (US) CNRS Patent 018344/0578, February 4, 2006.
- J. Griswold, J. D. Haney and V. A. Klein, Ind. Eng. Chem., 1943, 35, 701–704 CrossRef CAS.
- V. Petricek, M. Dusek and L. Palatinus, Jana2006. The crystallographic computing system, 2006.
- K. Nakamoto, Infrared and Raman Spectra of Inorganic and Coordination Compounds, Wiley-Interscience, New York, 4th edn, 1986 Search PubMed.
- I. Zhitomirsky, Adv. Colloid Interface Sci., 2002, 97, 279–317 CrossRef CAS.
- G. Anné, K. Vanmeensel, J. Vleugels and O. Van der Biest, J. Am. Ceram. Soc., 2005, 88, 2036–2039 CrossRef PubMed.
- B. Ferrari and R. Moreno, J. Eur. Ceram. Soc., 2010, 30, 1069–1078 CrossRef CAS PubMed.
- T. M. R. Viseu, B. Almeida, M. Stchakovsky, B. Drevillon, M. I. C. Ferreira and J. B. Sousa, Thin Solid Films, 2001, 401, 216–224 CrossRef CAS.
- F. Gracia, F. Yubero, J. P. Holgado, J. P. Espinos, A. R. Gonzalez-Elipe and T. Girardeau, Thin Solid Films, 2006, 500, 19–26 CrossRef CAS PubMed.
Footnote |
| † Electronic supplementary information (ESI) available: Fig. S1 illustrates the stability of a colloidal solution in acidic medium and in the charging solution; XRD patterns of samples treated at different temperatures are supplied in Fig. S2; typical Raman spectrum of as-synthesized powder at 180 °C is plotted in Fig. S3, Table S1; particle size deduced from Rietveld refinement and TEM for different R = OA/OM values, Table S2; evolution of cell parameters and particule size for different amount in OM, Fig. S4; distribution of particle sizes according to TEM images and the relative percentages of exposed {001} and {101} faces as function of R are detailed in Fig. S5; effects of post-treatments were characterized by IR and TGA and the experimental results are displayed in Table S3, Fig. S6 and S7; DLS and TEM of the charging solution testify for the low degree of colloids aggregation in Fig. S8 and S9, a typical topographic AFM image of the surface of a film is supplied as Fig. S10, the Tauc plot of a film prepared by EPD at 10 V for 7 min is displayed in Fig. S11. See DOI: 10.1039/c4ra15736b |
| This journal is © The Royal Society of Chemistry 2015 |