DOI:
10.1039/C4RA15669B
(Paper)
RSC Adv., 2015,
5, 28410-28423
Effect of graphene content on the properties of poly(lactic acid) nanocomposites
Received
2nd December 2014
, Accepted 3rd March 2015
First published on 3rd March 2015
Abstract
In the current work, the influence of temperature on the exfoliation of expandable graphite (EG) and its structural properties were investigated in detail. The EG exfoliated at 750 °C was subjected to sonication and further used as reinforcement material in the poly(lactic acid) (PLA) matrix to investigate the influence of “graphene” (GR) on the structural, morphological, thermal, optical, mechanical and oxygen barrier properties of PLA composites. X-ray diffraction results disclose the effect of sonication time on the dispersion ability of GR in the PLA matrix. A high resolution transmission electron microscopy image of GR demonstrates a monolayer structure of GR. Thermo-gravimetric analysis reveals that the Tonset value for the PLA composite with 0.5 wt% GR content increases by 6 °C over neat PLA, when 10% weight loss is taken as a point of comparison. The increase in the thermal stability of PLA composites is also verified by an increase of activation energy (Ea) value evaluated by the Coats–Redfern method. Differential scanning calorimetry analysis confirms that GR acts as a nucleating agent that enhances the melting point of PLA composites over neat PLA. The enhancement of tensile strength (17%) and elongation at break (51%) is obtained for PLA composites over neat PLA.
Introduction
Poly(lactic acid) (PLA) is versatile eco-friendly polyester that can be manufactured from precursors made of renewable resources, especially starch rich products such as corn, wheat, and sugar beet.1 The blooming of innovative technologies for massive production with cheaper processing costs facilitates PLA to occupy a vital position in the market of sustainable polymers. PLA is currently explored as a sustainable alternative to petrochemical derived polymers of fossil fuel origin and hence possesses massive potential for application in the field of commodity areas like packaging.2 Nevertheless, it is necessary to tailor the gas barrier and flexural characteristics of PLA in order to really substitute the benchmark packaging materials, namely polyolefins and poly(ethylene terephthalate) (PET). The common strategies that are usually pursued to attain these objectives include the addition of plasticizers,3,4 blending with other polymers5,6 and incorporation of nanofillers.7–9 The latter is deemed to be an interesting option, because a small percentage of nanofiller addition can significantly improve the target properties, while keeping the properties of PLA intact. PLA composites with amended properties (mechanical stability, thermal stability and low gas permeability) have been reported with the addition of various nanofillers, namely clays,10 layered silicates,11 carbon nanotubes (CNTs),12 citrate esters.13 PLA composites reinforced with carbonaceous nanofillers like CNTs are evidenced to reveal a noteworthy balance of properties in terms of mechanical, thermal and barrier effects.14 However, the high cost factor associated with CNTs limit their widespread applications in industrial corners and hence, additional proxies need to be prospected.
Recently, graphene has been recognized as potential nanofiller for the production of polymer nanocomposites. It is chemically similar to CNTs and structurally similar to silicate layers.15 This material exhibits supernatural properties like extremely high mechanical strength (Young's modulus = 1 TPa, tensile strength = 130 GPa), and thermal conductivity (5000 W m−3 K−1), which bounds above the standards testified for single-walled CNTs. Beside the extremely high surface area (2630 m2 g−1), these properties along with gas impermeability revealed the prospective applications of graphene for upgrading the mechanical, thermal as well as gas barrier characteristics of polymeric materials.16–23 The advantage of selecting 2D nanofillers as reinforcement in the PLA matrix is twofold: (i) when nanoscale graphene sheets are well dispersed in the PLA matrix, the tremendous aspect ratio provided by this filler could contribute to PLA chain confinement effects leading to improvement in stiffness and strength, (ii) the nanoscale filler being layered structures can provide a zigzag torturous diffusion path leading to enhancement in barrier performance for gas, moisture and oxygen transmissions.
When the graphene is uniformly dispersed in the polymer matrix, the target properties can be improved at comparatively lower loading than conventional carbon reinforcements. However, so far, the exfoliation of graphite to graphene and its reinforcement into polymeric materials has not been completely fruitful. Owing to the existence of strong van der Waals interactions (2 eV nm−2) between the interlayer spacing, it is indeed tough to attain a completely alienated state of graphene.24,25 Several research works have been endeavored describing the exfoliation and optimization of the dispersion of graphite sheets via the process of intercalation of alkali metals between the carbon layers26 or by subjecting the same to strong acidic treatment.27–29 The interlayer spacing has also been expanded via heat treatment or microwave irradiation subsequently trailed by mechanical crushing.30 The process of expansion led to considerable enhancement in the surface area of graphite, as a consequence of which, advancement in the inherent properties of the polymeric matrix are evidenced.25,31,32 Murariu and co-workers investigated the addition of expandable graphite (EG) on the properties of PLA composites prepared by the melt compounding method.30 In their study, complete exfoliation of EG into graphene sheets was not achieved, as a result, the tensile strength of the PLA composites exhibited downturn with an increase of EG (%wt) loading in the PLA matrix. To the best of our knowledge, study on optimization of exfoliation temperature for GR synthesis and highlighting the performance of PLA/GR composites synthesized via solution casting method have not been reported. In this work, EG is subjected to exfoliation at different temperatures ranging from 200–1000 °C and the optimum temperature for exfoliation is identified based on carbon yield (%) and bulk density (kg cm−3) of the resultant exfoliated graphite (EXG). Then, sonication technique is adopted to completely exfoliate the EXG into graphene sheets (GR). Thereafter, PLA–GR composites with various content of GR are synthesized via solution casting method and resultant films are characterized in detail to emphasize their performance.
Experimental
Materials
Expandable graphite (EG, 99.9%) was obtained from Asbury Carbons (USA). The catalog number for EG is “Asbury 3772” (particle size: 300 μm, carbon: 99%, expansion ratio (mL g−1) min: 270, pH range: 5–10, intercalates: sulfuric acid, nitric acid, hydrogen peroxide, potassium permanganate). Poly(lactic acid) (grade: 2003D) obtained from Nature work® was used as the bio-polymer matrix. Heat distortion temperature, melt flow index (g per 10 min) at 260 °C and specific gravity for PLA is 55 °C, 6 and 1.24, respectively. Chloroform obtained from Merck (India) Ltd., was used as the solvent for synthesizing poly(lactic acid)–graphene (PLA–GR) composites.
Exfoliation of expandable graphite (EG)
Accurately, 0.05 g of EG was weighed and placed in a silica crucible. Thermal exfoliation of expandable graphite was carried out at different temperature ranging from 200 to 1000 °C in an air atmosphere. The crucible containing expanded graphite was inserted in a muffle furnace (which was already set at a desired temperature) for 2 min in order to obtain exfoliated graphite samples (EXG 200–1000 °C). After thermal treatment, an expansion volume was measured using a measuring cylinder. The actual reason for exfoliation is the increase in volume, and the resultant pressure, caused by the rapid heating of the intercalated compound. The following relations were used to calculate bulk density and carbon yield (%) |
 | (1) |
|
 | (2) |
Preparation of PLA–GR composites
PLA–GR composites were fabricated by a simple solution-casting method as follows: at first, PLA (∼0.95 g) was dissolved in 30 mL of chloroform with continuous stirring for 2 h in order to completely dissolve the PLA (Solution A). Graphene (0.1, 0.3, 0.5 wt% with respect to PLA) was dispersed in chloroform (20 mL) separately by bath sonication for 30 min separately (Solution B). Subsequently, the solution containing dispersed GR (Solution B) was transferred into PLA–chloroform mixture (Solution A) and further subjected to bath sonication (Make: Elma and Model: T460) for 15 min and 30 min (Solution C). The corresponding photographs of Solution A, B and C are portrayed in Fig. 1. Finally, the PLA–GR solution was casted on Teflon petriplates and further, dried under ambient conditions for 24 h. The dried composite films were peeled off carefully from the petriplates. The resulting films were finally dried in a vacuum at 40 °C for 12 h. The obtained films were stored in airtight bags at room temperature for further characterizations. The thickness of the fabricated films was measured using a film thickness meter (indi 6156, India). Twenty measurements were taken on each film and the average thickness of the films was found in the range of 60 ± 10 μm. Thereafter, all the compositions were designated as neat PLA, PLA–GR-0.1, PLA–GR-0.3, and PLA–GR-0.5 for PLA, PLA/graphene 0.1 (wt%), PLA/graphene 0.3 (wt%), and PLA/graphene 0.5 (wt%), respectively.
 |
| Fig. 1 (a) PLA (Solution A), (b) EXG 750 in chloroform before sonication (Solution B), (c) EXG in chloroform after sonication (Solution B) and (d) PLA–GR composites (Solution C). | |
Characterization
X-ray diffraction analysis (XRD)
XRD analysis of neat PLA and composite films were carried out under air atmosphere at room temperature on a Bruker A8 advance instrument using Cu-Kα (λ = 0.15406 nm) radiation operating at 40 kV and 40 mA. The diffraction data were recorded in the 2θ range of 1–50° with a scanning rate of 0.05° s−1 and 0.5 s step size.
BET surface area analysis
Nitrogen physisorption measurements were conducted on a Beckman Coulter surface area analyzer (COULTER SA 3100 model). The samples were degassed at 105 °C for 4 h prior to N2 adsorption–desorption measurements. The specific surface area was calculated by BET (Brunauer, Emmett, and Teller) model. The total pore volume was estimated at a relative pressure of 0.99, assuming that full surface saturation has been achieved with nitrogen.
Morphological analyses
The morphology and the selected area diffraction (SAED) pattern of graphene were visualized using transmission electron microscopy (JEOLJEM 2100) operated at 200 kV. By direct casting of graphene solution over the carbon-coated copper TEM grid, images of the same were obtained. The morphology of PLA–GR composites was pictoriated using field-emission type scanning electron microscopy (Zeiss Sigma model) operated at 2 kV. The dispersion of GR in PLA composites was investigated by Leica DM 2500P polarizing optical microscope fitted with a QICAM FAST1394 camera.
Thermogravimetric analysis (TGA)
Thermogravimetric analysis was performed on a Mettler Toledo thermo gravimetric analyzer (TGA/SDTA 851® model). Samples (10.5 ± 0.3 mg) were placed in a 900 μL crucible. Neat PLA and PLA–GR composites were heated from 25 to 700 °C in a 60 mL min−1 flow of N2 at a heating rate of 10 °C min−1.
Differential scanning calorimetry (DSC)
Thermal properties and crystallization behavior of PLA and PLA–GR composites were studied using a differential scanning calorimeter (Mettler Toledo-1 series). Samples (10 ± 0.5 mg) were hermetically sealed in aluminum pans and heated from 25 to 180 °C at a heating rate of 5 °C min−1 in the N2 atmosphere (N2 flow rate of, 50 mL min−1). All the samples were first heated from 25 to 180 °C and held at this temperature for 5 min to eliminate the effect of thermal and processing history. Glass transition temperature (Tg), cold crystallization temperature (Tc), enthalpy change at Tc (ΔHc), melting temperature (Tm) and enthalpy of fusion at Tm (ΔHm) for neat PLA and composite samples were determined from the DSC thermograph during the second heating cycle. The percentage crystallinity (% Xc) of PLA was calculated according to the following relation. |
 | (3) |
where, ΔHm is enthalpy of fusion at melting temperature (Tm), ΔHc is the enthalpy of fusion at cold crystallization temperature (Tc). ΔHmp is the heat of fusion of a perfect PLA crystal (93.6 J g−1).34
UV-visible spectrophotometer analysis
Transparency measurement for composite films was carried out using UV-visible spectrophotometer (Make: Perkin Elmer, Model: Lambda 35). The wavelength range was varied between 200–600 nm with a scan rate of 50 nm min−1 and a spectral bandwidth of 2 nm.
Mechanical testing
The tensile properties such as tensile strength and elongation-at-break were measured under ambient temperature conditions with a 50 kN load cell on a tensile tester (Make: Kalpak instruments, Model: KIC-2-050-C, India). The cross-head speed was fixed as 5 mm min−1. Average specimen parameters were: thickness of 0.06 mm, width of 10 mm and length of 50 mm. Three specimens for each sample were subjected for testing and the average values were reported. The ASTM standard D 882-12 was followed for preparation of the dumb-bell shaped samples used in this test.
Results and discussion
Effect of temperature on exfoliation
The influence of temperature on exfoliation of EG in terms of volume exfoliated, weight after exfoliation, bulk density and carbon yield are presented in the Table 1. It is clearly seen from Table 1 that the volume of expandable graphite (EG) increases with increasing temperature up to 750 °C. This is due to the maximum swelling of intercalates taking place at 750 °C that increases the interlayer distance between graphene sheets resulting in high volume of expansion. After 750 °C, the expansion volume decreases, owing to the removal of intercalates from interlayers.28 Hence, it is clear that only swelling of intercalates occurs in the interlayers when the EG is subjected to thermal shock in the temperature range of 200–750 °C. After 750 °C, a significant difference in weight is observed which is found to be in correspondence with carbon yield (%) values. The rapid decrease in weight is due to evaporation of intercalates as gaseous products such as CO2 and SO2.28 It is also important to be noticed that the carbon yield (%) value drops down after 750 °C. An increase in exfoliation temperature above 750 °C leads to the reduction in the bulk density indicating that the imparted heat is enough for evaporation of intercalated substance and sample expansion. Even though, the least bulk density value might correspond to a maximum increase in exfoliation rate; two other factors (the volume of exfoliation and carbon yield) should be taken into consideration for optimization of temperature. In the present study, it is considered that 750 °C is the optimum condition for thermal exfoliation based on the information obtained from exfoliation volume, carbon yield, and bulk density. However, no significant change in weight is noticed after exfoliation at the temperature ranging between 200 and 750 °C. Table 1 clearly reveals that 80% of carbon yield is obtained at an exfoliation temperature of 750 °C.
Table 1 Effect of temperature on exfoliation of EGa
Sample name |
Volume exfoliated (mL) |
Weight after exfoliation (g) |
Bulk density (kg cm−3) |
Carbon yield (%) |
EXG 200 represents the EG exfoliated at 200 °C. |
EXG 200 |
0.1 |
0.05 |
500 |
100 |
EXG 300 |
3 |
0.046 |
15.33 |
92 |
EXG 400 |
4.5 |
0.043 |
9.56 |
86 |
EXG 500 |
9 |
0.041 |
4.55 |
82 |
EXG 600 |
12.5 |
0.041 |
3.28 |
82 |
EXG 700 |
15 |
0.041 |
2.73 |
82 |
EXG 750 |
15.5 |
0.040 |
2.58 |
80 |
EXG 800 |
14 |
0.034 |
2.43 |
68 |
EXG 900 |
12 |
0.023 |
1.92 |
46 |
EXG 1000 |
4 |
0.007 |
1.75 |
14 |
Characterization of expandable graphite (EG), exfoliated graphite (EXG) and graphene (GR)
XRD analysis. The XRD patterns of EG and EXG samples are depicted in Fig. 2. EG exhibits a sharp diffraction peak (0 0 2) at 26.52° indicating that EG is a sort of graphite intercalation compound (GIC). The basal peak position remains same for EG in comparison to natural graphite reported in the literature.28,33,35,36 This signifies that carbon crystal layer, which is the elementary constituent, does not undergo any change after intercalation. When all the EXG samples are subjected to XRD analysis, no significant deviation in the peak position (26.52°) is observed (Fig. 2). Nevertheless, the peak intensity (26.52°) gradually decreases when compared to EG with an increase in exfoliation temperature. This represents that lower the peak intensity, higher will be the degree of exfoliation subject to the same sample loading and packing density.36
 |
| Fig. 2 XRD patterns of expandable graphite (EG) and exfoliated graphite (EXG). | |
Surface area analysis. Nitrogen (N2) adsorption–desorption isotherms are shown in Fig. 3. In the isotherm pattern observed for the EG sample, the convexity suggests that adsorption of N2 takes place by cooperative mechanism. It means that adsorbate–adsorbent interaction is less importance than adsorbate–adsorbate interaction in nonporous materials like EG. Because of weak interaction between N2 and EG, the isotherm curve is flat in the initial P/P0 regions. Nevertheless, once adsorption of the N2 molecule begins, N2–N2 interaction tends to aggrandize the adsorption of more N2 molecules thus translating the isotherm to be convex with respect to the relative pressure values in the abscissa. With respect to increase in exfoliation temperature, type III isotherm gradually changes to type II pattern, which is the characteristic feature like EXG.37 Type II isotherm pattern observed for EXG samples is indicative of enhanced interaction between N2 and EXG, which is confirmed by the presence of knee portion in the initial P/P0 region for all the EXG samples. It can be perceived from the inset graph (Fig. 3), that increase in intercept (c) value or knee region for EXG samples with respect to exfoliation temperature occurs up to 900 °C. In general, greater the surface area, maximum will be the exfoliation.35
 |
| Fig. 3 N2 adsorption–desorption isotherms for expandable graphite (EG) and exfoliated graphite (EXG). | |
BET surface area and pore volume of the EXG samples are presented in the Table 2. Surface area and the pore volume increase with an increase in exfoliation temperature. This behavior reveals that pores are created in the graphite surface due to the removal of intercalates that escape from the graphitic interlayers during exfoliation.38–40 The maximum surface area (51.32 m2 g−1) and pore volume (0.29 cm3 g−1) are obtained for EXG 900 sample that signifies the maximum degree of exfoliation. However, the surface area, intercept (c) and volume of N2 adsorbed are reduced for EXG-1000 sample. This is because of restacking of graphene layers due to the complete removal of intercalates after exfoliation at 1000 °C. Although, a maximum surface area obtained for EXG 900, carbon yield (%) is drastically reduced to 46%. Considering this fact, 750 °C is chosen as the optimum exfoliation temperature and hence, EXG-750 is utilized as a source for the synthesis of GR and PLA–GR composites.
Table 2 Surface area characteristics for EG and EXG obtained at different temperatures
Sample name |
SBET (m2 g−1) |
Pore volume (cm3 g−1) |
EG |
0 |
0.0429 |
EXG 200 |
0 |
0.0429 |
EXG 300 |
5.881 |
0.0434 |
EXG 400 |
19.413 |
0.1285 |
EXG 500 |
19.732 |
0.1299 |
EXG 600 |
20.198 |
0.1375 |
EXG 700 |
33.459 |
0.1755 |
EXG 750 |
36.325 |
0.1762 |
EXG 800 |
38.411 |
0.1769 |
EXG 900 |
51.321 |
0.2912 |
Morphological analyses. The morphological images of EG and EXG samples are depicted in Fig. 4. EG is partially oxidized form of graphite containing intercalated compounds between graphene layers, as shown in Fig. 4(a). EG can undergo exfoliation when subjected to sudden thermal shock at a desired temperature. In case of Fig. 4(b), it can be observed that exfoliation of EG is just initiated due to the insufficient exfoliation temperature (200 °C). Fig. 4(c) and (d) show selected FE-SEM micrographs of the EXG 750 sample at different magnifications. These images elucidate that EG is exfoliated several hundred times along with the c-axis. This results in a massive increase in volume of EG. Origin of this process lies in the vaporization of the intercalate indicating that gaseous products cause the explosive expansion of the EG.41 After expansion, graphite becomes porous structure material with improved surface area comprising of many sheets of nanometer thickness.
 |
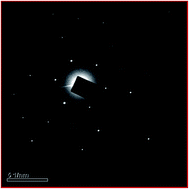
| Fig. 4 FE-SEM images of (a) expandable graphite, (b) EXG 200, (c) EXG 750 (low magnification), (d) EXG 750 (high magnification), (e) HRTEM image of GR and (f) SAED pattern of GR. | |
The morphology and SAED patterns of GR are visualized by HRTEM as depicted in Fig. 4(e) and (f). The HRTEM image (Fig. 4(e)) pictoriated after sonication demonstrates a monolayer structure. This suggests that, the graphene sheet obtained after sonication process is indeed a monolayer GR. Fig. 4(f) depicts the selected area electron diffraction (SAED) pattern of graphene, which is recorded by selecting a specified area from the graphene sheet slung overhead to a micrometer-sized hole on a 200 mesh copper grid. This clearly displays the crystalline structure of GR. The inner six member ring corresponds to the (1100) plane, whereas six intense dots are ascribed to the [0001] diffractions.41,42 The diffraction pattern images confirm that the resulted graphene retains the hexagonal symmetry of carbon framework.
Characterization of PLA–GR composites
XRD analysis. XRD analysis of neat PLA and its composites is carried out to determine the crystallographic properties of the PLA composites. The diffractograms recorded for PLA composite samples prepared with 15 and 30 min sonication are illustrated in Fig. 5(a) and (b), respectively. A scattered intense distribution with a broad peak observed at 2θ ≈ 16.7° corresponds to the reflections of (1 1 0) and (2 0 0) planes of orthorhombic α-crystalline phase of PLA.43 In all the composites, the peak position (2θ = 16.7°) corresponding to the crystal structure of PLA is not altered. Hence it is clear that lattice parameters are not altered with the incorporation of GR. However, it is clearly seen from Fig. 5(a) that a sharp peak appears at 26.5° corresponding to the (0 0 2) graphitic carbon structure.28,33,36 This ratifies the existence of pure graphite in the form of stacked GR sheets, suggesting that 15 min sonication applied during the synthesis of PLA–GR solution is not sufficient enough to completely exfoliate the graphene layers. Also some of the graphene sheets may persist in the aggregate conformation. To overcome this issue, 30 min sonication was applied during the synthesis of PLA–GR composites and the XRD profiles of the composites are depicted in the Fig. 5(b). It is clear from Fig. 5(b) that no peak appeared at 2θ = 26.5°corresponding to graphite. This is ascribed to the annoyance of ordered graphitic structure. These results elucidate that the graphite has been successfully exfoliated into single- or few-layers of stacking platelets and also completely dispersed in the PLA matrix. In the work reported by Esmaeil et al.,44 and Marius et al.,33 on PLA-nanographite platelet (NGP) and PLA-expanded graphite composites, respectively prepared via melt-compounding process, the XRD results confirmed the presence of the graphitic peak at 2θ value of 26.5° for all the composite systems. This suggests the fact that the melt-compounding used in their study could not completely exfoliate or isolate the graphene layers and several platelets existed in the amassed form, which in turn affected the mechanical properties. In reality, as the graphene nanosheets in EG are always interlinked with each other, “complete exfoliation” has no sense as in the case like organically modified layered silicates (OMLS).33 However, a conclusion can be drawn from the current study that the sonication used for separating the interlinked nanosheets of EXG has the effect on the exfoliation as well as the dispersion quality of graphene sheets in the PLA matrix. Based on the XRD analysis, now it is known that 30 min sonication (during the preparation of PLA–GR solution) disperses GR well in the PLA matrix and hence further analyzes are carried out for the samples prepared with 30 min sonication.
 |
| Fig. 5 XRD patterns of neat PLA and PLA–GR composites prepared with (a) 15 min sonication and (b) 30 min sonication time. | |
Morphological analyses. The dispersion of graphene sheets in the polymer matrix and their interfacial bonding are vital features that influence the enhancement of physical and mechanical properties of the composite materials. In order to evidence the dispersion of GR in the PLA matrix, FE-SEM and TEM analysis is performed using PLA–GR composite films and the images are shown in Fig. 6. It is clear from Fig. 6 that GR sheets are arbitrarily dispersed in the PLA matrix. These results are in good agreement with the XRD patterns of PLA–GR composites (see Fig. 5), where the peak corresponding to the graphite layer structure at 26.5° is not observed even at higher loadings of GR. These results suggest that the dispersion of GR in PLA matrix is near to a single sheet level. Aggregation of EG in PLA matrix was reported by Marius et al.33 This is in contrast to the present study, where GR sheets are not restacked in the PLA matrix, which might be due to the effectiveness of the sonication process used for the synthesis of PLA–GR composite.
 |
| Fig. 6 FE-SEM images of (a) PLA–GR composite (low magnification) (b) PLA–GR composites (high magnification) and (c) TEM image of PLA–GR-0.1. | |
The morphology of the PLA and PLA–GR composites is also investigated using the polarized optical microscopy to know the dispersion of GR in the PLA matrix. Fig. 7 shows the optical reflection micrographs of PLA composites with the various GR contents. The black portion is the GR sheets and the background is the polymer matrix. It is seen that, at the microscopic level, the GR sheets display a homogeneous distribution in the form of nanosheet clusters throughout the PLA matrix. As the content of the GR increases, the black portion of the micrograph also increases.
 |
| Fig. 7 Optical microscopy images of (a) PLA, (b) PLA–GR-0.1, (c) PLA–GR-0.3 and (d) PLA–GR-0.5. | |
Thermo gravimetric analysis. In order to cognize the influence of GR content on the thermal stability of PLA matrix, TGA analysis is carried out for PLA and PLA–GR composites. Fig. 8 depicts the temperature-dependent (TGA) and derivative weight loss profiles (DTG) for PLA and PLA–GR composites carried out under nitrogen atmosphere at a heating rate of 10 °C min−1. It is important to mention that % weight loss for the PLA and PLA–GR composites samples are calculated after water loss as shown in Fig. 8(a). The main thermal degradation process of PLA begins at temperature above 300 °C, which is principally attributed to intra-molecular trans-esterification (backbiting reaction).45–50 When 10% weight loss is taken as a point of comparison, Tonset is found to be 311, 313, 315 and 317 °C for PLA, PLA–GR-0.1, PLA–GR-0.3 and PLA–GR-0.5, respectively. The obtained results clearly specify that the PLA–GR-0.5 composite exhibits around 6 °C improvement in thermal stability over neat PLA. The decomposition temperature at 50% weight loss for neat PLA, 0.1, 0.3, and 0.5 wt% PLA–GR composites are 329, 330, 331, and 332 °C, respectively.
 |
| Fig. 8 (a) TGA and (b) DTG curves of neat PLA and PLA–GR composites. | |
The temperature which corresponds to the maximum rate of weight loss (Tmax) is regarded as another significant thermal property for the polymer composite system. The Tmax is defined as the peak value that is obtained from the first derivative curve of TGA thermograph. The first derivative curves for PLA and PLA–GR composites are depicted in Fig. 8(b). All the PLA–GR composites and neat PLA show a single peak signifying that the main degradation of these materials proceeded in only one step. It can be noticed that there is an improvement in the Tmax value (347 °C) for PLA–GR-0.5 sample in comparison with PLA (345 °C). Enhancement in the thermal stability behavior could be explained by the presence of barrier effect of graphene layers, which limits the emission of the produced degradation gases and transmission of heat, therefore resulting in the improvement in thermal stability of the nanocomposite material.51
DSC analysis. Non-isothermal cold and melt crystallization behavior of PLA and PLA–GR composites were investigated using DSC analysis. DSC second heating thermographs of neat PLA and PLA composites are shown in Fig. 9. The unimodal endothermic peak (Fig. 9) can be seen at the melting region of PLA (Tm = 149 °C), which reveals the α-crystalline form of PLA.13,52–54 This unimodal endotherm peak indicates the absence of heterogeneous distribution of crystals and uniform crystal thickness developed after reinforcement of GR due to the melting of stable crystals of PLA formed.13,50–53 The addition of GR in the PLA matrix increases the Tm value by 4–5 °C. This is due to the fact that GR reduces the critical nucleus size required for the formation of a thick and stable nucleus in PLA. The current result signifies that the GR acts as a better nucleating agent by enhancing Tm.
 |
| Fig. 9 DSC second heating thermographs for PLA and PLA–GR composites at a heating rate of 5 °C min−1. | |
In the present study, Tg for PLA composites does not change significantly in comparison with neat PLA. This indicates that the reinforcement of GR does not induce the formation of short chain PLA molecules.48,55 The positive effect of reinforced nanofiller on the crystalline properties of PLA can be observed from the Table 3. It is noticed that, all the composite samples display greater level of crystallinity (see Table 3). Improvement in the crystallinity for composite samples can be seen up to 0.3 wt% loadings of GR in comparison with neat PLA. With increase in further loadings of GR, crystallinity (%) slightly decreases. This is probably due to aggregation and poorer dispersion of GR in the PLA matrix. The improved PLA crystallinity with the addition of GR is significant due to the possibility of existence of the greater number of delaminated GR platelets, which can facilitate the PLA crystallization process.
Table 3 DSC results for PLA and PLA–GR compositesa
Sample name |
Tg |
Tcc |
Tm |
Tmc |
ΔHcc |
ΔHm |
% Xc |
Tg = glass transition temperature, Tcc = cold crystallization temperature, Tm = melting temperature, Tmc melt crystallization temperature, ΔHcc = enthalpy of cold crystallization, ΔHm = enthalpy of melting, % Xc = % crystallinity. |
PLA |
62 |
110 |
148 |
— |
16.14 |
27.2 |
12 |
PLA–GR-0.1 |
63 |
114 |
152 |
100 |
8.07 |
25.4 |
18.5 |
PLA–GR-0.3 |
64 |
113 |
152.8 |
101 |
9.8 |
27.8 |
19.2 |
PLA–GR-0.5 |
64 |
110 |
152.6 |
101 |
6.84 |
23.3 |
17.5 |
Transparency. The transmission of both visible light and ultraviolet radiation (200–700 nm) is considered as important parameters in designing the packaging materials for specific applications. The photochemical degradation of plastics occurs when exposed to high energy radiation called as UV-B (315–280 nm). Deterioration of food products that are sensitive to visible light takes place in the wavelength region of 400–700 nm.56–58 In the wavelength region of 200–700 nm, 72% transmission of light through PLA films is noticed as shown in Fig. 10. This specifies that most of the UV-B and visible radiation pass through PLA films. After reinforcement of GR in the PLA matrix, the transparency of PLA films declines with an increase in the loading of GR (wt%). For the PLA–GR-0.5 composite film, maximum reduction in the transparency is 53% in comparison with neat PLA. This is an advantage provided by GR filler, such that the PLA–GR composite films can find application in the storage of food products containing light sensitive materials such as lipids, flavors, vitamins, and pigments.
 |
| Fig. 10 Transparency measurements for PLA and PLA–GR composites. | |
Mechanical properties. The tensile strength and elongation-at-break properties of PLA and PLA–GR composites are presented in Fig. 11. The tensile strength of the PLA–GR composites is found to be higher for 0.1 wt% loading (40 MPa) of GR when compared with neat PLA (32 MPa). The PLA–GR-0.1 composite exhibits the highest tensile strength of 40 MPa compared to PLA–GR-0.3 (37 MPa) and PLA–GR-0.5 (31 MPa). It reveals that the stress applied is transferred from PLA matrix to the GR. The gradual roll-off in the tensile strength values for further loadings explicates that addition as well as dispersion of GR in the PLA matrix are the dominant factors to enhance the mechanical properties. Therefore, it is clear that noticeable aggregation and the quality of dispersion become inferior at higher loading of GR (>0.1%). As a result, a slight decrease in the tensile strength is observed for the PLA composites. The elongation-at-break value obtained for 0.1 wt% of GR content is 53%, which is higher than that of neat PLA. This implies that the ductility of PLA is effectively improved with the incorporation of GR. GR acts as a bridge to prolong the fracture process of PLA composites and thereby reduces the sudden risk of failure. At further loadings of GR (0.3 and 0.5 wt%), elongation-at-break values display the downturn of around ∼41% and 45%, respectively. This is because, defects induced by the agglomeration of GR sheets account for greater brittleness of the PLA matrix. However, GR reinforced in the PLA matrix demonstrates a positive impact on the tensile strength as well as elongation at break properties at lower GR loadings (0.1 wt%) in comparison with the PLA–EG composites produced by Marius et al.33 In their study, it was reported that the addition of EG in the PLA matrix showed a negative impact on the above properties at all the loadings (wt%) of EG due to the aggregation of graphene stacks. Hence, it is clear that the sonication process utilized in the present study to separate the graphene plays an effective role in enhancing the strength and ductility of the PLA composites.
 |
| Fig. 11 (a) Tensile strength and (b) elongation-at-break for PLA and PLA–GR nanocomposites. | |
Film permeability. For semi-crystalline polymers, like PLA, oxygen barrier characteristics are directed by permeation and diffusion of oxygen molecules through the amorphous phase of polymer film. To enhance the barrier properties of PLA, inclusion of impermeable barriers that reduces the gas permeation by creating the tortuous pathway is important. In the current investigation, the influence of graphene on inhibition of oxygen transport through PLA films is examined at various temperatures (25–45 °C) and the results are presented in Table 4. The permeation of oxygen is reduced by 22% (25 °C) after incorporating 0.1 wt% GR in the PLA matrix. This is attributed to the tortuous path effect generated by the exfoliated GR nanosheets, which hinders the oxygen transport in the PLA film. However, at higher loadings of GR, further improvement in oxygen permeation is not observed. This may be caused by the formation of GR aggregates at higher loadings. For both PLA and PLA–GR composite systems, oxygen permeation increases with increasing temperature, due to the fast diffusion of gas molecules through the PLA matrix at higher temperature. At 45 °C, the oxygen permeation for PLA composite containing 0.1 wt% GR is reduced about 40%. This indicates that the addition of GR acts as an effective impermeable barrier for oxygen transport even at higher temperature.
Table 4 Effect of graphene content on oxygen permeability (OP) of PLA–GR composite films
Sample name |
Temperature (°C) |
Oxygen permeability (cm3 per mm/m2 per day per atm) |
% Reduction in oxygen permeability |
PLA |
25 |
23 |
— |
35 |
33 |
— |
45 |
51 |
— |
PLA–GR-0.1 |
25 |
18 |
22 |
35 |
22 |
33 |
45 |
31 |
40 |
PLA–GR-0.3 |
25 |
20 |
13 |
35 |
23 |
30 |
45 |
35 |
32 |
PLA–GR-0.5 |
25 |
22 |
4 |
35 |
30 |
9 |
45 |
40 |
14 |
Thermal degradation kinetics of PLA–GR composites. Kinetic studies of degradation process are performed for better understanding of the thermal degradation behavior of PLA and PLA–GR composites. The kinetics of thermal degradation of GR based biopolymer composites can be expressed by the following typical kinetic equation |
 | (4) |
where, α is the conversion degree or the fraction decomposed [α = (w0 − wt/w0 − wf), w0, wt, and wf are the initial, time t, and final weights of the polymer],
is the rate of conversion, k is the temperature-degradation rate constant, and f(α) is the differential expression of a kinetic model function, which depends on the particular degradation mechanism.59–61The temperature dependent degradation rate constant (k) can be expressed in terms of the Arrhenius equation as follows:
|
 | (5) |
where,
A is the pre-exponential factor (s
−1),
Ea is the apparent activation energy of the degradation reaction (kJ mol
−1),
R is the universal gas constant (8.314 J mol
−1 K
−1), and
T is the absolute temperature (
K). By substituting
k from
eqn (5) in to
(4), a general expression for the kinetic process under isothermal conditions can be derived and expressed as
|
 | (6) |
In the present study, the thermal degradation kinetic study of PLA–GR composites is carried out under non-isothermal conditions, where samples are heated with a constant heating rate,
. Hence, eqn (6) is transformed into an equation which describes the degradation reaction rate as a function of temperature and then expressed as follows:
|
 | (7) |
Eqn (6) and (7) are the basic expressions of analytical procedures for the calculation of kinetic triplets from the TGA data.13,60–62
Taking integration on both sides and rearranging
|
 | (8) |
where,
g(
α) is the integral function of conversion degree,
α. The process of polymer degradation mainly obeys sigmoidal or deceleration functions.
Coats–Redfern method. Using eqn (8) and putting f(α) = (1 − α)n and x = Ea/RT and rearranging, we get: |
 | (9) |
g(α) can be written in different ways for different n values. |
When n = 1, g(α) = −ln(1 − α)
| (10) |
|
 | (11) |
The combination of eqn (10) and (11) and by rearrangement, we get:
|
 | (12a) |
|
 | (12b) |
Plotting the left hand side term versus −1/T gives the straight line and activation energy is obtained from the slope of the straight line. The value of the pre-exponential factor, A is obtained from intercept of the straight line, by considering the expression
inside the parenthesis as 1.63,64 Analysis is done using only single heating data, which is different from other kinetic models where multiple heating data are required for analysis.
The Coats–Redfern method requires TG data with only one heating rate to calculate kinetic parameters such as activation energy (Ea), reaction order (n) and pre-exponential factor (A).59 In this study, TGA data of PLA composite samples with different GR loadings are taken at a single heating rate (10 °C min−1). For this method, a reaction order “n” is assumed and the assumed value is substituted in eqn (12a) and (12b). The plot of the left hand side of the eqn (12a) and (12b) versus −1/T is fitted to calculate the R2 values. This process is repeated until the best R2 value is obtained. Fig. 12 shows the linear fitted graph for neat PLA and PLA–GR composites for various “n” values. The calculated reaction order at the best R2 value is considered as the reaction order for that sample. Then the activation energy and the pre-exponential factor are obtained from the slope and intercept of the fitted straight line. The activation energy of neat PLA and PLA–GR composite samples containing 0.1, 0.3 and 0.5 wt% GR is 125, 129, 137, and 146 kJ mol−1, respectively. This clearly indicates that GR acts as an effective nucleating agent and enhances the thermal properties of PLA matrix.
 |
| Fig. 12 Determination of kinetic parameters by plots of the left part in eqn (12) against −1/T using Coats–Redfern method: (a) neat PLA, (b) PLA–GR-0.1, (c) PLA–GR-0.3 and (d) PLA–GR-0.5. | |
Criado method. The mechanism of thermal degradation of PLA–GR composites at a particular heating rate is predicted using Criado method.65 The reaction mechanism is determined with the help of activation energy, pre-exponential factor and the apparent order of the reaction calculated using the Coats–Redfern method. Criado equation is given by |
 | (13) |
where,
and π(x) is an expression resulted by integration against temperature, that cannot be articulated using simple analysis formula. A relationship between π(x) and P(x) is reported elsewhere66 and is given as followswhere, P(x) is expressed as: |
 | (15) |
Combining eqn (13)–(15), the following relationship can be obtained
Combining eqn (7) with (16) provides the following relationship
|
 | (17) |
From the eqn (13) and (14), the following relationship is obtained
|
 | (18) |
The master Z(α) − α curve of the different reaction mechanisms given in Table 5 is plotted using eqn (17), and the Z(α) − α experimental curve is plotted using eqn (18).63 Thereafter, the master Z(α) − α curve has been compared with the experimental Z(α) − α curve for predicting the reaction mechanism of the thermal degradation process of PLA–GR composites.
Table 5 Expression of g(α) for the most frequently used reaction mechanism of solid state processes
Mechanism |
g(α) |
Solid state process |
Sigmoidal function |
A2 |
[−ln(1 − α)]1/2 |
Nucleation and growth Avrami eqn (1) |
A3 |
[−ln(1 − α)]1/3 |
Nucleation and growth Avrami eqn (2) |
A4 |
[−ln(1 − α)]1/4 |
Nucleation and growth Avrami eqn (3) |
![[thin space (1/6-em)]](https://www.rsc.org/images/entities/char_2009.gif) |
Deceleration function |
R2 |
[−ln(1 − α)1/2] |
Phase boundary controlled reaction: contraction area |
R3 |
[−ln(1 − α)1/3] |
Phase boundary controlled reaction: contraction area |
D1 |
α2 |
One-D diffusion |
D2 |
(1 − α) ln(1 − α) + α |
Two-D diffusion |
D3 |
[1 − (1 − α)1/3]2 |
Three-D diffusion: Jander equation |
D4 |
−ln(1 − α) |
Three-D diffusion: Ginstling–Brounshtein equation |
F1 |
−ln(1 − α) |
Random nucleation having one nucleus on individual particle |
F2 |
1/(1 − α) |
Random nucleation having two nucleus on individual particle |
F3 |
1/(1 − α)2 |
Random nucleation having two nucleus on individual particle |
The kinetic parameters obtained for 10 °C min−1 heating rate using the Coats–Redfern method are substituted in the eqn (17) and (18). Fig. 13(a–d) illustrates the Z(α) − α master and experimental curves for neat PLA and PLA–GR composites samples with 0.1, 0.3 and 0.5 wt% GR. It can be perceived that the experimental curves of neat PLA (Fig. 13(a)) overlaps with the master curves of Z(F1), suggesting that the thermal degradation process of neat PLA follows the F1 reaction mechanism. This indicates that random nucleation is the rate controlling step associated with the nucleation process at lower α values (0.1–0.55). After adding GR, at the initial phase, the thermal degradation process proceeds via F1 reaction mechanism for all PLA composite samples. With further progress in the degradation reaction, the system, however, slowly changes towards A3 mechanism (which involves both nucleation and growth) at higher α value (0.7–0.95). This might be possibly due to the shift in the thermal degradation mechanism at higher temperature conditions.
 |
| Fig. 13 Determination of the thermal degradation reaction mechanism by plots of Z(α) versus α using Criado method. (a) Neat PLA, (b) PLA–GR-0.1, (c) PLA–GR-0.3 and (d) PLA–GR-0.5. | |
Conclusions
In the current article, expandable graphite (EG) is subjected to thermal shock at different temperatures ranging from 200–1000 °C. The optimum condition for thermal exfoliation is determined as 750 °C. The HRTEM image pictoriated after sonication and SAED pattern display a monolayer GR. No diffraction peak corresponding to graphene is observed from the XRD patterns of PLA–GR composites prepared with 30 min sonication due to exfoliation of GR in the PLA matrix. The TGA analysis reveals that the thermal stability of PLA–GR-0.5 composites improves about 6 °C when 10% weight loss is taken as a point of comparison. Improvement in the thermal stability can also be corroborated from the enhancement in the activation energy exhibited by PLA composites. The presence of GR greatly improves melting temperature of about 4 °C as well as the crystallization ability of PLA during the non-isothermal crystallization processes. This indicates that GR acts as an effective nucleating agent in enhancing the crystallization behavior of PLA. In the UV-B and visible radiation region (200–700 nm), 53% reduction in the transparency for PLA films is observed after reinforcement of GR. The tensile strength of PLA–GR composites is found to be maximum (40 MPa) for 0.1 wt% loading of GR in comparison with neat PLA, which is an indication of good adhesion between PLA and the filler.
Acknowledgements
Authors are thankful to the Central Instrument Facility (CIF), IIT Guwahati for helping to perform TEM, FE-SEM and BET analysis. Authors sincerely thank the Department of Chemicals & Petrochemicals, Ministry of Chemicals and Fertilizers, Government of India - funded Center of Excellence for Sustainable Polymers at IIT Guwahati for research facilities to perform this current research work. XRD used in this work was financially supported by a FIST grant (SR/FST/ETII-028/2010) from Department of Science and Technology (DST), Government of India.
References
- P. Pan, Z. Liang, A. Cao and Y. Inoue, ACS Appl. Mater. Interfaces, 2009, 1, 402–411 CAS.
- Y. Inoue and N. Yoshie, Prog. Polym. Sci., 1992, 17, 571–610 CrossRef CAS.
- M. A. Paul, M. Alexandre, P. H. Degee, C. Henrist, A. Rulmont and P. H. Dubois, Polymer, 2003, 44, 443–450 CrossRef CAS.
- M. Pluta, Polymer, 2004, 45, 8239–8251 CrossRef CAS PubMed.
- H. Zhao, Z. Cui, X. Wang, L. Turng and X. Peng, Composites, Part B, 2013, 51, 79–91 CrossRef CAS PubMed.
- H. Chena, M. Pydab and P. Cebe, Thermochim. Acta, 2009, 492, 61–66 CrossRef PubMed.
- M. Murariu, A. Da Silva Ferreira, P. H. Degee, M. Alexandre and P. H. Dubois, Polymer, 2007, 48, 2613–2618 CrossRef CAS PubMed.
- N. C. Bleach, S. N. Nazhat, K. E. Tanner, M. Kellomaki and P. Tormala, Biomaterials, 2002, 23, 1579–1585 CrossRef CAS.
- M. Murariu, L. Bonnaud, P. Yoann, G. Fontaine, S. Bourbigot and P. H. Dubois, Polym. Degrad. Stab., 2010, 95, 374–381 CrossRef CAS PubMed.
- S. Bourbigot, G. Fontaine, S. Duquesne and R. Delobel, Int. J. Nanotechnol., 2008, 5, 683–692 CrossRef CAS.
- A. L. Goffin, E. Duquesne, S. Moins, M. Alexandre and P. H. Dubois, Eur. Polym. J., 2007, 43, 4103–4113 CrossRef CAS PubMed.
- T. Villmow, P. Potschke, S. Pegel, L. Haussler and B. Kretzschmar, Polymer, 2008, 49, 3500–3509 CrossRef CAS PubMed.
- R. Valapa, G. Pugazhenthi and V. Katiyar, Int. J. Biol. Macromol., 2014, 65, 275–283 CrossRef CAS PubMed.
- F. Hussain, M. Hojjati, M. Okamoto and R. E. Gorga, J. Compos. Mater., 2006, 40, 1511–1575 CrossRef CAS PubMed.
- Q. Bao, H. Zhang, J. Yang, S. Wang, D. Y. Tang, R. Jose, S. Ramakrishna, C. T. Lim and K. P. Loh, Adv. Funct. Mater., 2009, 20, 782–791 CrossRef.
- Y. Zhu, S. Murali, W. Cai, X. Li, J. W. Suk, J. R. Potts and R. S. Ruoff, Adv. Mater., 2010, 22, 3906–3924 CrossRef CAS PubMed.
- O. C. Compton and S. T. Nguyen, Small, 2010, 6, 711–723 CrossRef CAS PubMed.
- K. J. Huang, D. J. Niu, J. Y. Sun, C. H. Han, Z. W. Wu, Y. L. Li and X. Q. Xiong, Colloids Surf., B, 2010, 82, 543–549 CrossRef PubMed.
- P. K. Ang, M. Jaiswal, C. H. Lim, Y. Wang, J. Sankaran, A. Li, C. T. Lim, T. Wohland, O. Barbaros and K. P. Loh, ACS Nano, 2010, 4, 7387–7394 CrossRef CAS PubMed.
- S. R. Ryoo, Y. K. Kim, M. H. Kim and D. H. Min, ACS Nano, 2010, 4, 6587–6598 CrossRef CAS PubMed.
- M. S. Dresselhaus and G. Dresselhaus, Adv. Phys., 2002, 51, 1–186 CrossRef CAS.
- Z. Spitalsky, M. Danko and J. Mosnacek, Curr. Org. Chem., 2011, 15, 1133–1150 CrossRef CAS.
- A. Celzard, J. F. Mareche and G. Furdin, Prog. Mater. Sci., 2005, 50, 93–179 CrossRef CAS PubMed.
- S. Stankovich, D. A. Dikin, G. H. B. Dommett, K. M. Kohlhaas, E. J. Zimney, E. A. Stach, R. D. Piner, S. T. Nguyen and R. S. Ruoff, Nature, 2006, 442, 282–286 CrossRef CAS PubMed.
- Y. Cao, J. Feng and P. Wu, Carbon, 2010, 48, 3834–3839 CrossRef CAS PubMed.
- L. S. Viculis, J. J. Mack, O. M. Mayer, H. T. Hahn and R. B. Kaner, J. Mater. Chem., 2005, 15, 974–978 RSC.
- K. E. Carr, Carbon, 1970, 8, 155–158 CrossRef CAS.
- G. Chen, D. Wu, W. Weng and C. Wu, Carbon, 2003, 41, 619–621 CrossRef CAS.
- Y. X. Pan, Z. Z. Yu, Y. C. Ou and G. H. Hu, J. Polym. Sci., Part B: Polym. Phys., 2000, 38, 1626–1633 CrossRef CAS.
- K. Kalaitzidou, H. Fukushima and L. T. Drzal, Compos. Sci. Technol., 2007, 67, 2045–2051 CrossRef CAS PubMed.
- Y. W. Cao, J. C. Feng and P. Y. Wu, Carbon, 2010, 48, 1683–1685 CrossRef CAS PubMed.
- S. Niyogi, E. Bekyarova, M. E. Itkis, J. L. McWilliams, M. A. Hamon and R. C. Haddon, J. Am. Chem. Soc., 2006, 128, 7720–7721 CrossRef CAS PubMed.
- M. Murariu, A. L. Dechief, L. Bonnaud, Y. Paint, A. Gallos, G. Fontaine, S. Bourbigot and P. Dubois, Polym. Degrad. Stab., 2010, 95, 889–900 CrossRef CAS PubMed.
- D. Garlotta, J. Polym. Environ., 2001, 9, 63–84 CrossRef CAS.
- H. Xiang, K. Zhang, G. Ji, J. Y. Lee, C. Zou, X. Chen and J. Wu, Carbon, 2011, 49, 1787–1796 CrossRef CAS PubMed.
- A. Yasmin, J. J. Luo and I. M. Daniel, Compos. Sci. Technol., 2006, 66, 1179–1189 Search PubMed.
- K. S. W. Singh, D. H. Everett, R. A. W. Haul, L. Moscou, R. A. Pierotti, J. Rouquerol and T. Siemieniewska, Pure Appl. Chem., 1985, 57, 603–619 Search PubMed.
- S. Stankovich, D. A. Dikin, R. D. Piiner, K. A. Kohlhass, A. Kleinhammes, Y. Jai, Y. Wu, S. T. Naguyen and R. S. Rouf, Carbon, 2007, 45, 1558–1565 CrossRef CAS PubMed.
- I. M. Afanasov, O. N. Shornikova, D. A. Kirilenko, I. I. Vlasov, L. Zhang, J. Verbeeck, V. V. Avdeev and G. V. Tendeloo, Carbon, 2010, 48, 1862–1865 CrossRef CAS PubMed.
- K. Fukushima, M. Murariu, G. Camino and P. Dubois, Polym. Degrad. Stab., 2010, 95, 1063–1076 CrossRef CAS PubMed.
- J. M. Mcallister, J. L. Li, D. H. Admson, H. C. Schniepp, A. A. Abdala, J. Liu, M. H. Alonso, D. L. Milius, C. Reoberto, R. K. Prudhomme and I. A. Aksay, Chem. Mater., 2007, 19, 4396–4404 CrossRef.
- P. Cui, J. Lee, E. Hwang and H. Lee, Chem. Commun., 2011, 47, 12370–12372 RSC.
- V. Krikorian and D. J. Pochan, Chem. Mater., 2003, 15, 4317–4324 CrossRef CAS.
- E. Narimissa, R. Gupta, M. Bhaskaran and S. Sriram, Polym. Degrad. Stab., 2012, 97, 829–832 CrossRef CAS PubMed.
- Y. Fan, H. Nishida, Y. Shirai, Y. Tokiwa and T. Endo, Polym. Degrad. Stab., 2004, 86, 197–208 CrossRef CAS PubMed.
- Y. Fan, H. Nishida, Y. Shirai and T. Endo, Polym. Degrad. Stab., 2004, 84, 143–149 CrossRef CAS PubMed.
- V. Taubner and R. Shishoo, J. Appl. Polym. Sci., 2001, 79, 2128–2135 CrossRef CAS.
- Y. Wang and J. F. Mano, Eur. Polym. J., 2005, 41, 2335–2342 CrossRef CAS PubMed.
- Y. Wang, B. Steinhoff, C. Brinkmann and I. Alig, Polymer, 2008, 49, 1257–1265 CrossRef CAS PubMed.
- H. Yu, N. Huang, C. Wang and Z. Tang, J. Appl. Polym. Sci., 2003, 88, 2557–2562 CrossRef CAS.
- X. Wang, W. Xing, P. Zhang, L. Song, H. Yang and Y. Hu, Compos. Sci. Technol., 2012, 72, 737–743 CrossRef CAS PubMed.
- F. Peng, M. T. Shaw, J. R. Olson and M. Wei, J. Phys. Chem. C, 2011, 115, 15743–15751 CAS.
- D. Sawai, K. Takahashi, A. Sasashige, T. Kanamoto and S. H. Hyon, Macromolecules, 2003, 36, 3601–3605 CrossRef CAS.
- W. Hoogsteen, A. R. Postema, A. J. Pennings and G. T. Brinke, Macromolecules, 1990, 23, 634–642 CrossRef CAS.
- L. Liu, T. Z. Jin, D. R. Coffin and K. B. Hicks, J. Agric. Food Chem., 2009, 57, 8392–8398 CrossRef CAS PubMed.
- H. Chen, W. Zhang, X. Du, J. Yang, N. Zhang, T. Huang and Y. Wang, Thermochim. Acta, 2013, 566, 57–70 CrossRef CAS PubMed.
- R. Auras, B. Harte and S. Selke, Macromol. Biosci., 2004, 4, 835–864 CrossRef CAS PubMed.
- J. J. Hernandez, M. C. Garcia-Gutierrez, A. Nogales, D. R. Rueda, M. Kwiatkowska, A. Szymczyk, Z. Roslaneic, A. Concheso, I. Guinea and T. A. Ezquerra, Compos. Sci. Technol., 2009, 69, 1867–1872 CrossRef CAS PubMed.
- I. Armentano, N. Bitinis, E. Fortunati, S. Mattioli, N. Rescignano, R. Verdejo, M. A. Lopez-Manchado and J. M. Kenny, Prog. Polym. Sci., 2013, 38, 1720–1747 CrossRef CAS PubMed.
- D. F. Wu, L. Wu, L. F. Wu and M. Zhang, Polym. Degrad. Stab., 2006, 91, 3149–3155 CrossRef CAS PubMed.
- A. Khawan and D. R. Flanagan, J. Phys. Chem. B, 2006, 110, 17315–17328 CrossRef PubMed.
- E. IYuzay, R. Auras, H. Valdez and S. Selke, Polym. Degrad. Stab., 2010, 95, 1769–1777 CrossRef PubMed.
- S. V. Krishna and G. Pugazhenthi, J. Appl. Polym. Sci., 2011, 120, 1322–1336 CrossRef CAS.
- M. Poletto, A. J. Zattera and R. M. C. Santana, Bioresour. Technol., 2012, 126, 7–12 CrossRef CAS PubMed.
- J. M. Criado, J. Malek and A. Ortega, Thermochim. Acta, 1989, 147, 377–385 CrossRef CAS.
- J. H. Flynn, Thermochim. Acta, 1997, 300, 83–92 CrossRef CAS.
|
This journal is © The Royal Society of Chemistry 2015 |
Click here to see how this site uses Cookies. View our privacy policy here.