
Application of CFD to evaluate the pore morphology effect on nanofluid flooding for enhanced oil recovery
Reza Gharibshahia,
Arezou Jafari*a,
Ali Haghtalaba and
Mohammad Saber Karambeigib
aChemical Engineering Department, Tarbiat Modares University, Tehran, Iran. E-mail: ajafari@modares.ac.ir; Tel: +98 2182884982
bIOR/EOR Research Institute, Tehran, Iran
First published on 19th February 2015
Abstract
In this study a computational fluid dynamics (CFD) method has been developed to simulate the effect of pore morphology and its distribution in a 2D micromodel on the enhanced oil recovery factor of nanofluid flooding. Seven types of micromodel with different schematics and pore shapes were considered. SiO2 nanoparticles, dispersed in distilled water, were used for the preparation of the nanofluid and flooding operation. To generate the desirable porous media, the geometries of the micromodels were generated using the commercial grid generation tool, Gambit 2.3. Then, the momentum and mass transport equations were solved based on the finite volume method using the Fluent 6.3 software to investigate the displacement of oil at the pore scale. In order to better understand the nanoparticles’ effects and to confirm the validity of the CFD simulations, numerical results have been compared with the experimental data. The influences of some parameters such as heterogeneity of pores, connectivity of pores with or without throat line, tortuosity and pore shape on the enhanced oil recovery, breakthrough time and fluid trapping in the porous media were investigated. From the results, it has been found that random generation of pore distribution illustrates better results compared to homogeneous pore distribution. In addition, with the presence of nanoparticles in the injected fluid the number of fingers decreases. The fingering effect has the main effect on the oil recovery factor with a lower fingering effect having a higher recovery factor. So, in the homogeneous pattern the nanofluid flow in the porous media is uniform and symmetric. But in the random distribution model, the fluid flow is more realistic and similar to the fluid flow in reservoirs.
1. Introduction
There is a burgeoning tendency toward application of new technologies in the enhanced oil recovery (EOR) processes by which the oil production can be improved substantially. Nanotechnology which is the science of materials at nano-scale, offers outstanding performances in this way and it can establish an effective bridge between large scale and atomic as well as molecular scales. The unique characteristics of nanoparticles such as mechanical, chemical and thermal properties are significant driving forces for their applications in various EOR methods.1Generally EOR technologies are divided into several main categories; namely miscible/immiscible methods, chemical processes, and thermal techniques.2,3 The conventional EOR approaches would suffer from different demerits; for instance, low sweep efficiency in heterogeneous porous media, instability in unconventional reservoirs, economic infeasibility, possibility of formation damage e.g. permeability reduction, drastic consequences for the environment, and corrosion potential. By contrast, addition of nanoparticles due to their nano-size can solve several drawbacks regarding conventional methods and increase the sweep efficiency of the displacing fluid. Because nanoparticles improve the interfacial properties and also thermal conductivity of the base fluids. In addition, they are stable in high temperature/pressure conditions, environmentally compatible, and cost-effective.1,4 It is worth mentioning that almost all EOR methods are expensive processes, but the myriad advantages of nanofluid flooding can compensate its economic drawbacks.
Therefore, among available products applied in different EOR methods, nanofluids (nanoparticles suspended in a fluid) have vital importance.5,6 Addition of nanoparticles can optimize the properties of displacing fluids such as density, viscosity, interfacial tension between oil and water, thermal conductivity and specific heat.7,8 Thinking practically, nanofluid flooding improves the macroscopic sweep efficiency through reduction of the fingering effect. Therefore, the oil within unswept zones can be recovered.9,10 Also it can affect the microscopic displacement efficiency via reduction of interfacial tension11,12 and change the wettability of the reservoir rock from oil-wet to water-wet.4,7,13,14 Moreover, nanofluids reduce the viscosity of heavy oil,11,12 and experimental data confirmed that the nanofluid flooding increases the oil recovery factor compared to water flooding.14 Because of huge advantages of nanofluids it seems that in the near future nanofluid flooding can be applied instead of usual EOR methods in the field.
So it is important to investigate the effective factors that influence the nanofluid flooding. An important parameter for the effective increase of recovery factor is the type of the base fluid which disperses nanoparticles.4 Furthermore, selection of a suitable nanoparticle is another vital variable. Several types of nanoparticles such as SiO2, TiO2, CuO and Al2O3 are reported in the literature for EOR applications.15
Since all the research that has been performed on nanofluid flooding is experimental work, for the fast advancement of this high-potential technique simulations and modeling studies can help researchers. Therefore, in this work, a computational fluid dynamics (CFD) approach that has not been reported yet in the literature is utilized for this purpose.16 The CFD technique is used for analyzing the systems involving fluid flow, heat transfer and associated phenomena such as chemical reactions by means of computer-based simulation.17–19 This technique is very powerful and spans a wide range of industrial and non-industrial application areas. In this method, partial differential equations are solved numerically through their conversion into algebraic equations.20,21 Among available approaches, the finite volume method is more applicable, especially for incompressible flows.
The advantages of CFD compared to the laboratory methods are the ability of studying special and critical conditions in a process, facilitating the design of equipment, reducing time and costs, and also obtaining complete information and accurate details of the solution. Therefore, CFD has been used in many gas and oil industries like drilling,22–24 erosion,25,26 separation,27 subsea equipment,28 EOR29 and many other fields. However, studying the effects of pore morphology and pore distribution on nanofluid flooding by a CFD technique has not been carried out yet.
In order to study the pore morphology, a porous medium is required. Micromodels as two dimensional porous media are defined as microscale apparatuses that enable visual observation of phase displacement behavior at the pore level. They are good alternatives to sand packs and cores because a major limitation of studies implemented in such media are their black-box features.30 The materials available for fabrication of micromodels are glass, silicon or polymers like polydimethylsiloxane (PDMS). Another priority for the application of micromodels is the possibility of designing, fabricating and studying selective patterns.31 For this purpose, patterns can be categorized into innovative (designed based on the geometry required for a special study) patterns such as simple pore networks of circular,32 triangular,33 quadratic34 or reservoir prototype patterns by taking SEM images from a thin section of reservoir rocks.29
It is worth mentioning that different processes and parameters can be evaluated in porous media using micromodels such as oil recovery factor,35,36 breakthrough time,37 viscosity reduction,7 changes in the interfacial surface tension,38,39 wettability alteration,40,41 miscible or immiscible injections,42,43 mass transfer,44,45 chemical reactions,46,47 capillary pressure48 and heterogeneity.49
Previous investigations indicate that pattern characteristics of micromodels are important for precise studies of the pore-scale experiments; for example, pore morphology, coordination number, pore shape and the location of pore-necks on the pore-body.33 Emami Meybodi et al.33 evaluated the effect of pore morphology and wettability on the microscopic and macroscopic displacement efficiencies in polymer flooding. They concluded that the random network with triangular pore shape shows better results than other patterns. Dehghan et al.50 carried out experimental work to understand the role of pore geometry and connate water on miscible displacement of heavy oil with different hydrocarbon solvents in five-spot micromodels. They found that the displacement efficiency is improved more in patterns with higher coordination number and lower pore-throat size. Moreover, the heterogeneity of the porous media reduces the miscible displacement efficiency. Mason and Morrow51 as well as Princen52 showed that angular cross-section pores have many qualitative features represented by real porous media and there is identical capillary behavior in a tube having the same shape factor even though they are geometrically different.
As the pore morphology of micromodels has a considerable effect on fluid displacement and there is no study about the effect of pore shape on nanofluid flooding; in this work, the effect of different micromodel characteristics on the performance of nanofluid flooding is evaluated using CFD modeling for the first time. In other words, the objective of the current work is simulating the effects of pore morphology and distribution in terms of pore-throat connectivity, heterogeneity, pore shape, and tortuosity of pores in the porous media on different responses such as oil recovery factor, trapping effect, and mobility control (breakthrough time) that have not been discussed in any publication yet. The laboratory data required for validation of the simulation results is prepared through pore-scale microvisual experiments in glass micromodels.14
2. Numerical implementation
2.1. Geometry creation
The geometries of the porous media were created using Gambit 2.3 (Fluent Inc.). Seven patterns of micromodels were produced in which they had equal size 6 × 6 cm2 and porosity 33 ± 2% (Fig. 1). Moreover, the physical properties of patterns were selected so that they were representative of the patterns used by Maghzi et al.14 due to the validation of the simulation results with their experimental work. The characteristics of the designed patterns are shown in Table 1. The random distribution of model A was prepared by programming developed in Matlab and C++ in a way to keep the porosity constant (33%). Two conditions were considered to spread the circles. The former was the existence of circles in the square and the latter was the lack of contact between circles. Then to make the porous medium, the circles’ surface area was subtracted from the square. | ||
| Fig. 1 The schematic geometry of the designed patterns; (a) overall appearance with location of inlet and outlet ports, and (b–g) other patterns, for better visualization they have been magnified. | ||
| Micromodel | Dimension (cm) | Porosity | Absolute permeability (m2) | Coordination number |
|---|---|---|---|---|
| A | 6 × 6 | 0.33 | 3.63 × 10⁻⁷ | 4 |
| B | 6 × 6 | 32.44 | 5.65 × 10⁻⁸ | 4 |
| C | 6 × 6 | 34.83 | 6.46 × 10⁻⁷ | 4 |
| D | 6 × 6 | 35 | 4.92 × 10⁻⁷ | 4 |
| E | 6 × 6 | 31.2 | 3.27 × 10⁻⁷ | 4 |
| F | 6 × 6 | 32.72 | 1.94 × 10⁻⁷ | 4 |
| G | 6 × 6 | 35 | 3.11 × 10⁻⁷ | 4 |
To divide micromodels (A–G) into discrete control volumes, approximately 2.5 × 10⁵, 5.5 × 10⁵, 3.4 × 10⁵, 3.6 × 10⁵, 2.9 × 10⁵, 3.4 × 10⁵ and 3.3 × 10⁵ computational cells were used, respectively. Tri/pave mesh was chosen for the faces because this type is better for meshing and linking the curved edges of a circle with the angled surface of the micromodels.
2.2. Grid independency
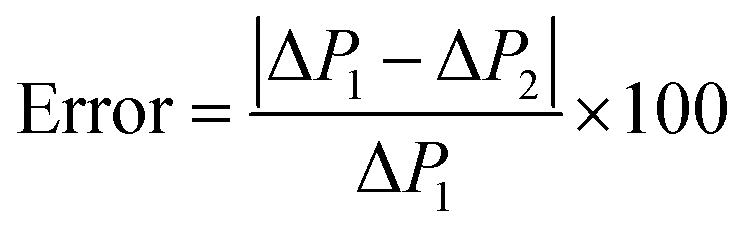
For investigating the grid independency, various types of grids with different mesh sizes were generated. Then for each grid the governing equations were solved for the water flow rate 8 × 10⁻⁴ cm3 min−1 and Δt = 0.1 s. It should be mentioned that several tests with different time intervals (0.01, 0.1 and 1 s) were done to examine the effect of time step on the accuracy of the results. Finally it was demonstrated that for micromodels the difference was negligible. Therefore, to save time and computational cost Δt = 0.1 s was used for the simulations, and the simulations continued until the steady state condition was achieved.The fluid pressure drops in porous media were considered to compare grids. To do this, the total pressure at the inlet and outlet were calculated and then eqn (1) was used to estimate the percentage of relative error.
 | (1) |
![[thin space (1/6-em)]](https://www.rsc.org/images/entities/char_2009.gif) 449, 343979, 194980, 208534, 181371, 261329 and 204572 nodes, respectively. Selecting the final grid with larger mesh size and fewer node (cell) numbers for flooding can help to reduce the number of computation calculations required. As an example, the grid of model A is depicted in Fig. 2.
449, 343979, 194980, 208534, 181371, 261329 and 204572 nodes, respectively. Selecting the final grid with larger mesh size and fewer node (cell) numbers for flooding can help to reduce the number of computation calculations required. As an example, the grid of model A is depicted in Fig. 2.
| Model | No. | Mesh size | No. of cells | No. of nodes | ΔP (Pa.) | Relative error (%) | ||
|---|---|---|---|---|---|---|---|---|
| Inlet and outlet | Other edges | Face | ||||||
| A | Grid 1 | 0.01 | 0.015 | 0.02 | 125469 |
78546 |
0.874 | 6.17 |
| Grid 2 | 0.008 | 0.01 | 0.02 | 251433 |
136449 |
0.931 | ||
| 2.89 | ||||||||
| Grid 3 | 0.005 | 0.008 | 0.02 | 445385 |
212545 |
0.959 | ||
| B | Grid 1 | 0.01 | 0.015 | 0.02 | 276120 |
125469 |
2.794 | 10.48 |
| Grid 2 | 0.008 | 0.01 | 0.02 | 554803 |
343979 |
3.121 | ||
| 3.10 | ||||||||
| Grid 3 | 0.005 | 0.008 | 0.02 | 720456 |
526549 |
3.221 | ||
| C | Grid 1 | 0.01 | 0.015 | 0.02 | 156998 |
96526 |
0.894 | 6.08 |
| Grid 2 | 0.008 | 0.01 | 0.02 | 335996 |
194980 |
0.952 | ||
| 1.82 | ||||||||
| Grid 3 | 0.005 | 0.008 | 0.02 | 532642 |
300878 |
0.971 | ||
| D | Grid 1 | 0.01 | 0.015 | 0.02 | 177150 |
108516 |
0.389 | 4.19 |
| Grid 2 | 0.008 | 0.01 | 0.02 | 358378 |
208534 |
0.406 | ||
| 2.13 | ||||||||
| Grid 3 | 0.005 | 0.008 | 0.02 | 528378 |
301084 |
0.414 | ||
| E | Grid 1 | 0.01 | 0.015 | 0.02 | 116139 |
81206 |
1.753 | 10.95 |
| Grid 2 | 0.008 | 0.01 | 0.02 | 289738 |
181371 |
1.969 | ||
| 2.45 | ||||||||
| Grid 3 | 0.005 | 0.008 | 0.02 | 416597 |
253086 |
2.018 | ||
| F | Grid 1 | 0.008 | 0.015 | 0.02 | 151558 |
102456 |
3.851 | 7.71 |
| Grid 2 | 0.005 | 0.01 | 0.02 | 340236 |
216329 |
4.173 | ||
| 2.79 | ||||||||
| Grid 3 | 0.005 | 0.008 | 0.02 | 485924 |
298654 |
4.293 | ||
| G | Grid 1 | 0.01 | 0.015 | 0.02 | 153229 |
87542 |
2.084 | 8.85 |
| Grid 2 | 0.008 | 0.01 | 0.02 | 330106 |
204572 |
2.287 | ||
| 3.95 | ||||||||
| Grid 3 | 0.005 | 0.008 | 0.02 | 513189 |
398678 |
2.367 | ||
 | ||
| Fig. 2 (a) Model A, and (b) a close-up window of model A for better visualization. | ||
Velocity inlet and pressure outlet were used as boundary conditions for inlet and outlet ports, respectively. Velocity inlet boundary conditions are used to define the flow velocity along with all relevant scalar properties of the flow at the inlets. Then, to allow the nanofluid to exit from the model via a 5 spot pattern, the pressure outlet was selected as the outlet port. No flow is entering into or exiting from other edges and so wall boundary conditions were assumed.
2.3. Governing equations
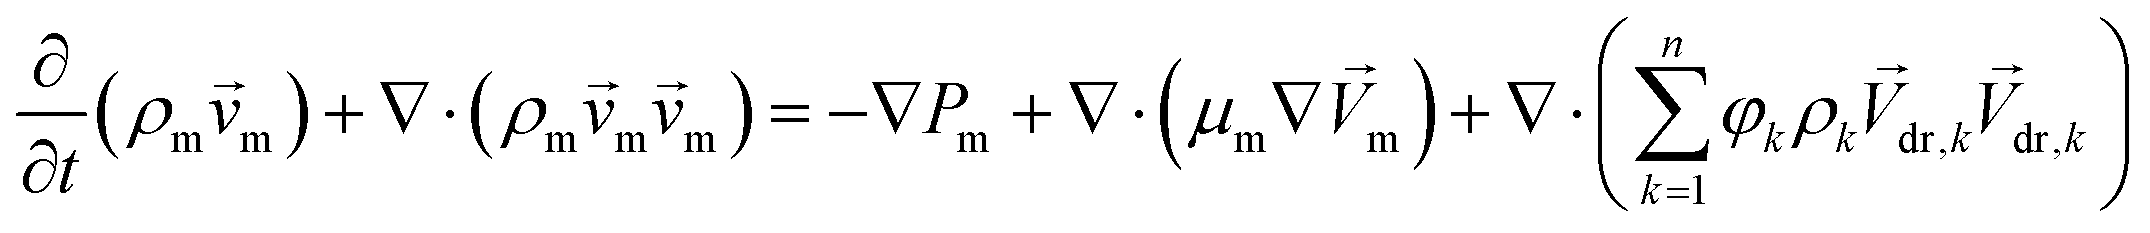
A mixture model as a simplified multiphase model was used to solve the equations. Moreover, liquid–solid flows can be modeled using this method. A mixture method can model n phases through solving the momentum, continuity and energy equations for the mixture;53 the volume fraction equations for the secondary phases and the algebraic expressions for the relative velocities. The relevant equations are as follows:54Conservation of mass:
 | (2) |
Conservation of momentum:
 | (3) |
 | (4) |
 | (5) |
 | (6) |
The drift velocity of kth phase is:
![[V with combining right harpoon above (vector)]](https://www.rsc.org/images/entities/i_char_0056_20d1.gif) dr,k = k − m dr,k = k − m
| (7) |
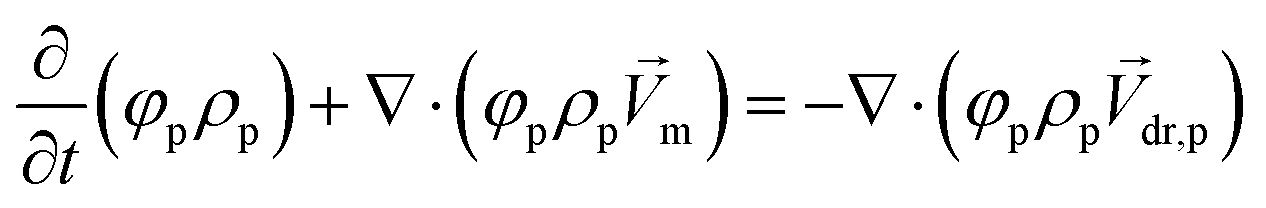
The volume fraction equation for the secondary phase (p) can be obtained:
 | (8) |
The slip velocity (relative velocity) is defined as the velocity of a secondary phase (p) relative to the velocity of the primary phase (f):
|
pf = p − f
| (9) |
The drift velocity is related to the relative velocity as:
 | (10) |
Selecting appropriate values of the under-relaxation factors guarantees a reasonable rate of convergence. The under-relaxation factors were assigned as 0.3 for pressure, 1 for density and body forces, 0.7 for momentum, 0.1 for slip velocity and finally 0.2 for volume fraction. If the normalized residual values became smaller than 0.001, then equations of mass and momentum would be satisfied to achieve convergence. The maximum residual value occurs after the first few iterations when the normalization factors are used for mass and momentum. Using the mixture model to solve the problem, these assumptions were taken:
(1) Two phase flow condition.
(2) Primary phase is oil and the secondary phase is water and nanofluid in the validation and other tests, respectively.
(3) Initial water saturation is zero (Swi = 0) and the water injected into the micromodel is distilled water.
(4) Unsteady state condition.
(5) All experiments were carried out at ambient temperature and pressure.
(6) The flow rate is constant at 8 × 10⁻⁴ cm3 min−1 during flooding.
(7) Δt = 0.1 s has been selected for all simulations.
(8) To establish a good comparison between all the models, iterations were continued until the rate of oil production remained constant. So all flooding operations stopped at 10000 s (or 1 PV of the injected fluid) after injection of the nanofluid.
3. Results and discussion
3.1. Nanofluid flooding
As available publications55–58 confirm that silica nanoparticles have a high potential to enhance the oil recovery factor, in this study the selected nanofluid consists of 4 wt% SiO2 nanoparticles (Table 3) in distilled water. It is assumed that the silica nanoparticles are spherical and the particles’ volume fraction and diameter have been selected to be small enough to avoid aggregation of the nanoparticles. The nanofluid properties were calculated according to eqn (11) and (12):59| ρnf = φ × ρp + (1 − φ) × ρbf | (11) |
 | (12) |
| Particle | Average size (nm) | Specific surface (m2 g−1) | Density (kg m−3) | Molecular weight (g mol−1) |
|---|---|---|---|---|
| SiO2 | 14 | 200 | 2400 | 60.08 |
In the simulations it is assumed that firstly the micromodels are saturated with crude oil and the properties of the oil are the same as the oil in the Azadegan heavy oil field located in the south west of Iran (Table 4).
| Viscosity (mPa s) | Density (kg m−3) | API@26 °C |
|---|---|---|
| 870 | 933 | 19 |
3.2. The heterogeneity effect
The geometry of the reservoir rock is complex because it consists of pores with different sizes and random distribution as well as lots of dead end pores. The modeling of two phase flow in such media is very complicated. Therefore, researchers try to simulate the characteristics of patterns which are representing of reservoirs porous media.60 In this section, the effect of pore heterogeneity was investigated in micromodel A. As the results illustrate in Fig. 3, the fluid flow in this model is relatively similar to that in the reservoir rock. Moreover, the oil recovery factor with nanofluid flooding is in good agreement with the experimental data (relative error is 5.17%). In other words, the prediction of this model compared to other patterns for the oil recovery factor with nanofluid flooding is more accurate. As the nanofluid volume fraction contour shows in Fig. 4, the fluid flow pattern is very similar to the typical flow of a two phase flow in real porous media. Because the fingering and trapping effects of the injected front can be observed relatively well, it should be considered that if the research focus is on the trapping effect, it cannot be investigated thoroughly in model A.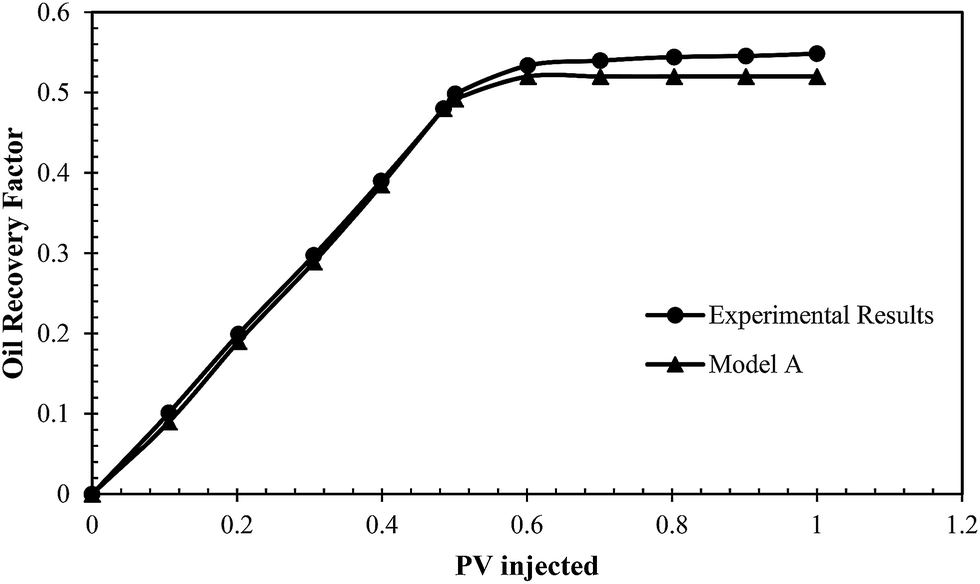 | ||
| Fig. 3 The heterogeneity effect on the oil recovery factor (model A). | ||
 | ||
| Fig. 4 The nanofluid volume fraction contour of model A. | ||
3.3. The effect of connecting pores with/without throat lines
Patterns with different geometries and physical properties can be designed to be representative of a specific porous model. Among different properties, the pore to throat connectivity may be crucial to study parameters affecting the nanofluid flow and oil displacement in porous media.In this section models B and C were designed to study the effect of pore connectivity in which pores in model B were not connected through throats while in model C they were connected. The results showed that this factor can cause the pattern in which the pores are connected with throat lines (model C) to produce more oil and its oil recovery factor to have a higher relative error compared to the experimental data (Fig. 5). It is worth mentioning that the experimental porous shape is representative of a real reservoir, and in this case the pattern of Maghzi et al.14 has been chosen for comparison of numerical results.
 | ||
| Fig. 5 The effect of pore connectivity on the oil recovery factor. Models B and C are without and with the throats, respectively. | ||
The nanofluid volume fraction contours of models B and C are depicted in Fig. 6. It can be found that the nanofluid flow is symmetric in both models. The progress of the front in model C is more uniform (piston-like) than in model B where the injected front has obviously been fingered. On the other hand, the macroscopic sweep efficiency is higher in model C.
 | ||
| Fig. 6 The volume fraction contours of the nanofluid in models B and C. | ||
3.4. The effect of pore shape
The effect of pore shape on the oil recovery factor in micromodels was investigated in this section. Two scenarios were considered for studying the effect of pore shape: with and without the throat line. In the first scenario, three types of micromodel with different pore shapes were selected; circular (model C), quadratic (model D) and triangular (model E). The numerical results indicate that the oil recovery factor of the model with quadratic pore shape generates the most precise prediction of the experimental data, because its relative error was the smallest as shown in Fig. 7. The nanofluid volume fraction contours of these three models are presented in Fig. 8. It can be seen that in model E, compared to models C and D, the outer surface is in contact with the nanofluid and more fingers occur in this model. | ||
| Fig. 7 The oil recovery factors of models C, D and E with different pore shapes. | ||
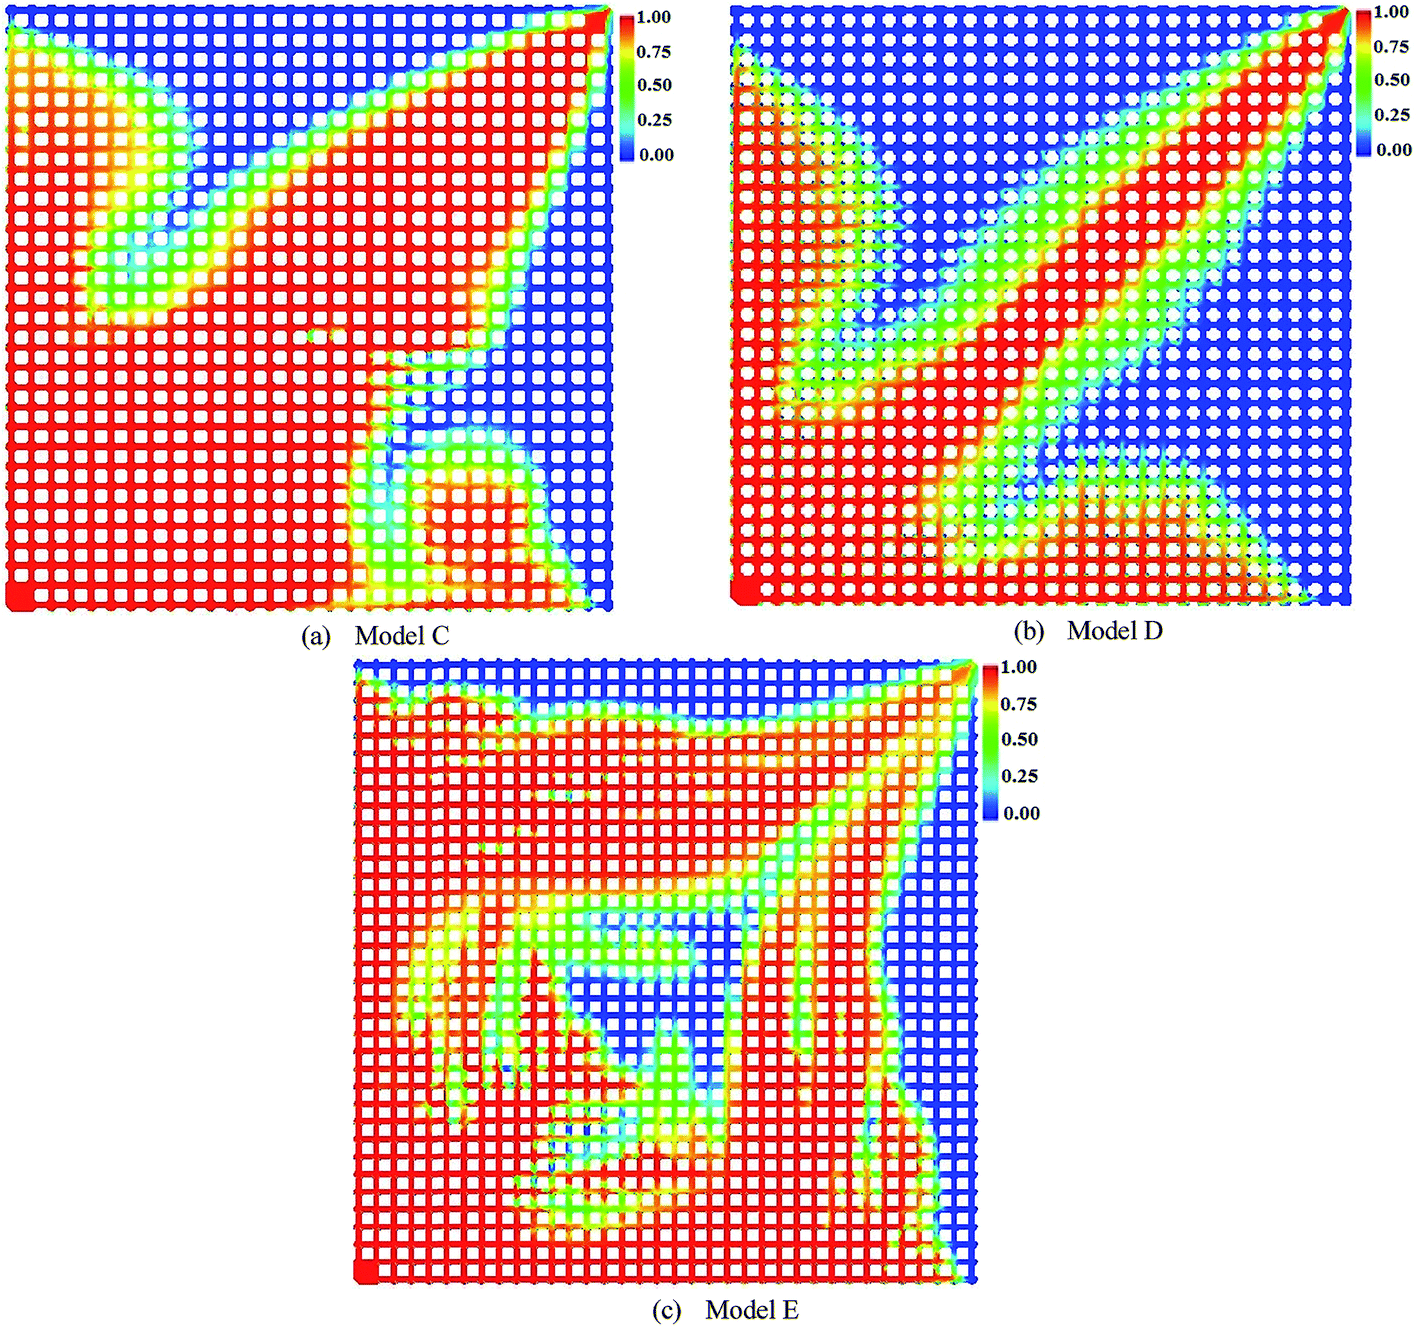 | ||
| Fig. 8 The nanofluid volume fraction contours of models C, D and E. | ||
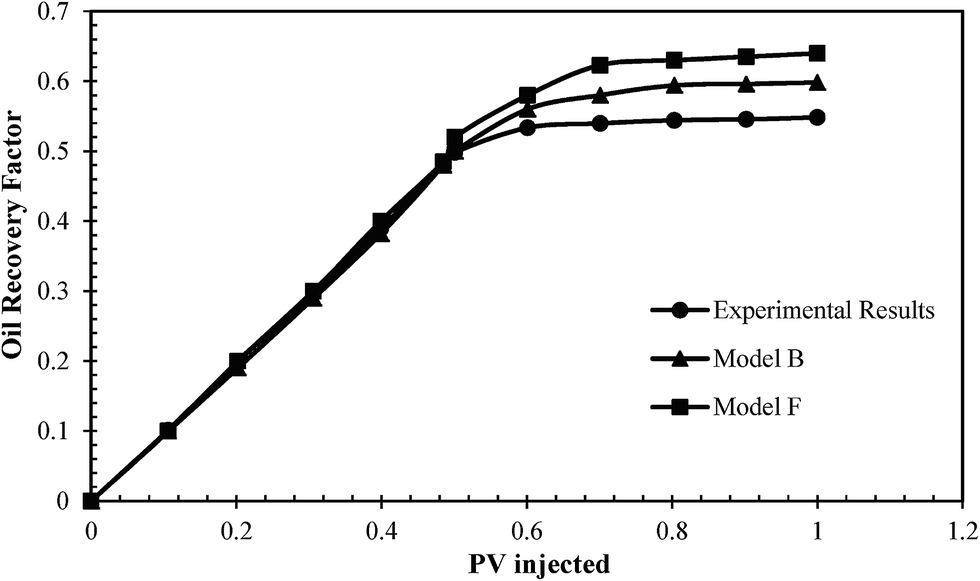
The second scenario was run for models without throat line connections. For this purpose, two micromodels with different pore shapes; circular (model B) and quadratic (model F) were considered. Fig. 9 shows the oil recovery factors resulting from the simulation runs and reveals that model B generates a more precise prediction compared with model F. But as Fig. 10 illustrates, the fluid flows in both models are very similar although model B has a lower relative error.
 | ||
| Fig. 9 The oil recovery factors of models without throat connections. | ||
 | ||
| Fig. 10 The nanofluid volume fraction contours of models B and F. | ||
3.5. The pore tortuosity effect
The angle between the fluid flow direction in porous media and the pores is an important parameter for the investigation of the oil recovery factor in the micromodel flooding operations.61 If the fluid flow direction is the same as the direction of the connections between the pores or pore-throat line in a model, the nanofluid can move easily within the model through the lines. Therefore, the oil recovery factor is low because the mobility of the injected front is very high in such models and prediction of the EOR behavior is not correct.For investigating the pore tortuosity effect, models F and G were designed and studied. Model F predicted the experimental data better than model G (Fig. 11). Fig. 12 shows the nanofluid volume fraction contours of models F and G. The front injection in model G has rapid breakthrough because of less tortuosity. That is due to the high mobility of the injected fluid in such media. But in model F the residence time of the injected fluid is increased and the front of the injected fluid could spread to other zones. In that case the macroscopic sweep efficiency is higher in model F.
 | ||
| Fig. 11 The effect of the angle between the fluid flow direction and pore connection on the oil recovery factor. | ||
 | ||
| Fig. 12 The nanofluid volume fraction contours of models F and G. | ||
3.6. The effect of micromodel type on the oil recovery factor
The nanofluid flooding in models A–G is performed and the relative errors between numerical results and experimental data for the oil recovery factors have been determined and tabulated in Table 5. This table and also previous results obviously indicate that the geometry of the micromodel pattern is a determinative factor as it influences the oil recovery factor. In other words, in simulations with constant properties of oil and displacement fluids, micromodels show different oil recovery factors although they have approximately the same dimensions and porosities.| Micromodel | The relative error between numerical results and experimental data (%) |
|---|---|
| A | 5.17 |
| B | 9.08 |
| C | 22.72 |
| D | 10.81 |
| E | 28.64 |
| F | 16.7 |
| G | 56.65 |
Model A with a random distribution of pores shows the best results with 5.17% relative error. By comparing the relative errors between models with and without throat line, it has been found that the type of connection between the pores can affect the oil recovery factor. So it is better to remove the connections between the pores with a specified line and allow the injected fluid to move freely within the porous media so it chooses its own pathway based on the physical properties of the model and not according to the path that we have chosen for it.
3.7. The effect of the breakthrough time
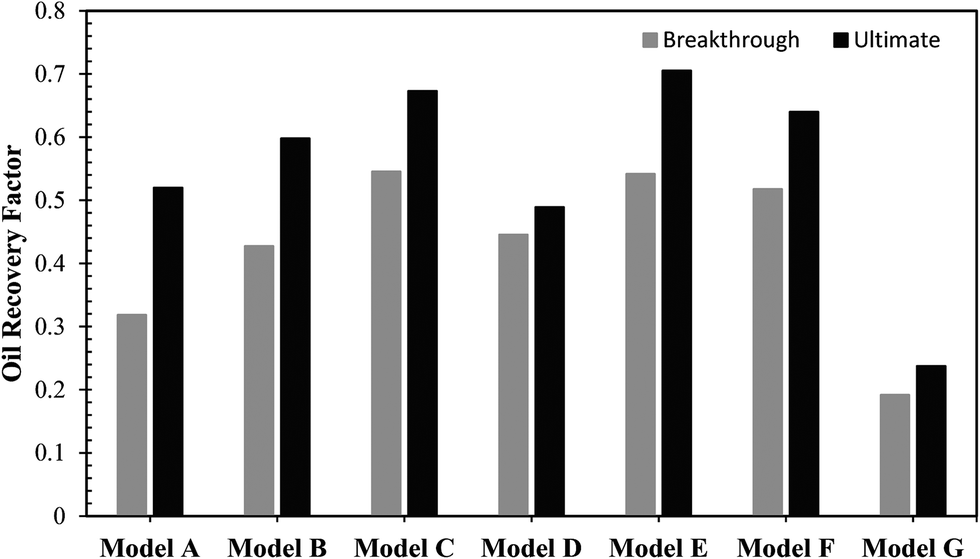
The effect of pattern type on the breakthrough time of the displacing fluid containing nanoparticles was studied at a constant injection rate, 8 × 10⁻⁴ cm3 min−1. As shown in Fig. 13, it can be found that models C and G have the longest (6742 s) and shortest (2519 s) breakthrough times, respectively. This is because in model C, the pore necks are small and fluid flow in this micromodel is very difficult. Therefore, the flow goes around to the corners and two sides of the model and it takes more time to make a breakthrough. Conversely, the pore morphology of model G is not complex, the connections between the pores are simple and the pore necks are large enough to let the fluid flow easily. Hence, the breakthrough time in model G is faster than the other models. The oil recovery factors at the breakthrough times and the ultimate oil recoveries have been shown in Fig. 14. It can be observed that the difference between these measurements is 20.14% for model A which is larger than other models while model D has the smallest difference, 4.34%.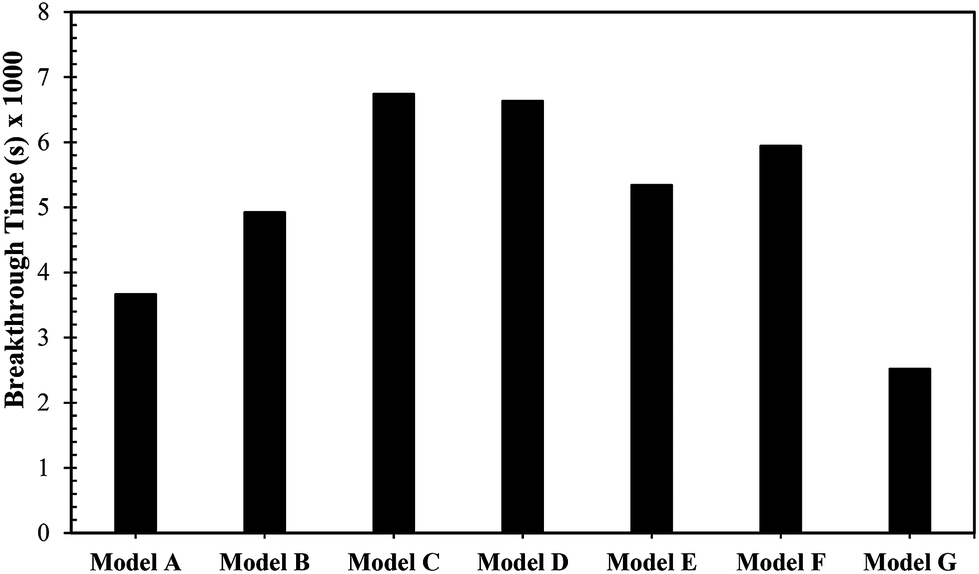 | ||
| Fig. 13 The nanofluid breakthrough times in different micromodels. | ||
 | ||
| Fig. 14 The oil recovery factors at the breakthrough times and the ultimate oil recoveries. | ||
3.8. Trapping effect
Oil and gas from hydrocarbon reservoirs may be trapped in porous media which is known as the trapping effect. The mechanism of this phenomenon is not understood well, so mathematical equations cannot define this complex function perfectly. The fluid trapping, however, depends on different factors such as the pore structure of the porous medium, fluid–rock interaction and fluid–fluid interaction.62 At the microscopic level of EOR operations, all of the original oil in-place cannot be recovered and a considerable amount of oil remains intact and trapped in the porous media. For studying this effect, the magnified volume fraction contours of the designed micromodels with the nanofluid flooding were compared in Fig. 15. It can be concluded that the models in which the pores have corners (e.g. models D and E with quadratic and triangular pore shapes, respectively) are suitable for studying the trapping effect in porous media. In models D and E after the nanofluid flooding some oil remains trapped in the corners of the pores and the injected fluid cannot overcome the capillary pressure of the trapped phase to mobilize it. | ||
| Fig. 15 Nanofluid volume fraction contours of models A–G at the pore scale level. Red and blue colors represent the maximum and minimum volume fraction of oil, respectively. | ||
4. Conclusion
In this work, simulation of the nanofluid flooding in various patterns of micromodels having different geometries and pore morphologies was carried out using computational fluid dynamics. The micromodels containing seven patterns were created with a commercial grid generation tool (Gambit 2.3). To investigate the fluid flow in the porous media, the momentum and mass transport equations were solved based on the finite volume method using the Fluent 6.3 software. The effect of some parameters such as heterogeneity, connectivity of the pores with/without throat lines, pore shape and finally the pore tortuosity effect were studied with respect to the enhanced oil recovery and breakthrough time. The fluid flow in porous media was predicted numerically using the multi-phase model and the simulation results were validated with the experimental data. The following results were obtained:• The fluid flow in models which have a heterogeneous distribution of pores more closely resembles that in the rock reservoir, but the trapping effect cannot be investigated perfectly in such models. Results of the oil recovery factor show that the nanofluid flooding in this model has a good agreement with the experimental data.
• Connections between the pores in the models decreases the fingering effect and causes uniform front flow. Therefore, a much higher area of the porous media will be invaded by the injected fluid and consequently macroscopic sweep efficiency will be increased compared to models without throat lines.
• Among the models with throat lines, those which have quadratic pore shapes have the best results and among the models without throat lines, it can be found that the fluid flow in these models are very similar to each other and are almost independent from the pore shape. Although the models with circular pore shape have lower relative error than the quadratic pore shape.
• The angle between the direction of fluid flow and pores is an important parameter. The oil recovery factor is lower than the experimental results in models that have the same direction of fluid flow and pore connections. On the other hand, the relative errors between the numerical results and the experimental data in such models are very high.
• Models with a random distribution of pores have a good agreement with experimental data with the least relative error 5.17%. Considering the connection of pores with a throat line increases the oil recovery factor, subsequently the relative error will be raised.
• Models C and G respectively have the longest and shortest breakthrough times. Also the differences between the ultimate and breakthrough time oil recovery factors in models A and D are the largest and smallest, respectively among all the models.
• At the microscopic level, models which have pores with corners such as quadratic or triangular pore shapes are suitable for studying the trapping effect in the porous media.
Finally, the results of this study indicate that the model with a random distribution of pores (model A) is suitable for future development of simulation studies in nanofluid flooding processes. Recommendations for further studies could be the investigation of the impact of the nanoparticles on the rock/fluid interactions and properties such as wettability and oil viscosity to thoroughly understand the mechanism of nanofluid transport in porous media and its relevant phenomena in EOR matters.
Nomenclature
| Swi | Initial water saturation |
| dr,k | Drift velocity of kth phase |
| dr,p | Drift velocity of a secondary phase |
| f | Velocity of the primary phase |
| Vk | Velocity of kth phase |
| m | Mixture velocity |
| p | Velocity of a secondary phase |
| pf | Slip velocity. |
Greek letters
| ΔP1 | Pressure difference between the inlet and outlet with finer mesh |
| ΔP2 | Pressure difference between the inlet and outlet with coarser mesh |
| Δt | Time step |
| μbf | Viscosity of base fluid |
| μm | Mixture viscosity |
| μnf | Viscosity of nanofluid |
| μp | Viscosity of a secondary phase |
| ρbf | Density of base fluid |
| ρm | Mixture density |
| ρnf | Density of nanofluid |
| ρp | Density of a secondary phase |
| φ | Volume fraction of nanoparticles |
| φp | Volume fraction of a secondary phase |
Subscripts
| bf | Base fluid |
| dr | Drift |
| F | Primary phase |
| K | kth phase |
| M | Mixture |
| nf | Nanofluid |
| p | Secondary phase |
Acknowledgements
The authors would like to thank Tarbiat Modares University, Iran's National Elites Foundation and Nanotechnology Initiative Council for financial support of this research.References
- S. Ponmani, R. Nagarajan and J. Sangwai, J. Nano Res., 2013, 24, 7–15 CrossRef CAS.
- S. Lago, H. Rodríguez, M. K. Khoshkbarchi, A. Soto and A. Arce, RSC Adv., 2012, 2, 9392–9397 RSC.
- A. Muggeridge, A. Cockin, K. Webb, H. Frampton, I. Collins, T. Moulds and P. Salino, Philos. Trans. R. Soc., A, 2014, 372, 20120320 CrossRef PubMed.
- N. Ogolo, O. Olafuyi and M. Onyekonwu, SPE Saudi Arabia Section Technical Symposium and Exhibition, Al-Khobar, Saudi Arabia, 2012 Search PubMed.
- X. Kong and M. Ohadi, Abu Dhabi international petroleum exhibition and conference, Abu Dhabi, UAE, 2010 Search PubMed.
- A. Fletcher and J. Davis, SPE Improved Oil Recovery Symposium, Tulsa, Oklahoma, USA, 2010 Search PubMed.
- Y. Hamedi Shokrlu and T. Babadagli, Canadian Unconventional Resources and International Petroleum Conference, Calgary, Alberta, Canada, 2010 Search PubMed.
- A. Roustaei, J. Moghadasi, H. Bagherzadeh and A. Shahrabadi, Proc. SPE Int. Oilf. Nanotechnol. Conf., 2012 Search PubMed.
- M. R. Haroun, S. Alhassan, A. A. Ansari, N. A. M. Al Kindy, N. Abou Sayed, A. Kareem, B. Ali and H. K. Sarma, Abu Dhabi International Petroleum Conference and Exhibition, Abu Dhabi, UAE, 2012 Search PubMed.
- J. Yu, C. An, D. Mo, N. Liu and R. L. Lee, SPE Improved Oil Recovery Symposium, Tulsa, Oklahoma, USA, 2012 Search PubMed.
- L. Hendraningrat and L. Shidong, SPE Russian Oil and Gas Exploration and Production Technical Conference and Exhibition, Moscow, Russia, 2012 Search PubMed.
- T. Skauge, K. Spildo and A. Skauge, SPE Improved Oil Recovery Symposium, Tulsa, Oklahoma, USA, 2010 Search PubMed.
- B. Ju, T. Fan and M. Ma, China Particuol., 2006, 4, 41–46 CrossRef CAS.
- A. Maghzi, S. Mohammadi, M. H. Ghazanfari, R. Kharrat and M. Masihi, Exp. Therm. Fluid Sci., 2012, 40, 168–176 CrossRef CAS PubMed.
- B. Suleimanov, F. Ismailov and E. Veliyev, J. Pet. Sci. Eng., 2011, 78, 431–437 CrossRef CAS PubMed.
- J. Jamali and S. N. Shoghl, RSC Adv., 2014, 4, 57958–57966 RSC.
- H. Hayer, O. Bakhtiari and T. Mohammadi, J. Ind. Eng. Chem., 2015, 21, 1379–1382 CrossRef CAS PubMed.
- S. H. Hosseini, S. Shojaee, G. Ahmadi and M. Zivdar, J. Ind. Eng. Chem., 2012, 18, 1465–1473 CrossRef CAS PubMed.
- J.-B. Ryu, C.-Y. Jung and S.-C. Yi, J. Ind. Eng. Chem., 2013, 19, 1092–1098 CrossRef CAS PubMed.
- M. Bahiraei, J. Dispersion Sci. Technol., 2013, 35, 984–996 CrossRef.
- M. J. H. Khan, M. A. Hussain, Z. Mansourpour, N. Mostoufi, N. M. Ghasem and E. C. Abdullah, J. Ind. Eng. Chem., 2014, 20, 3919–3946 CrossRef CAS PubMed.
- H. I. Bilgesu, N. Mishra and S. Ameri, Eastern Regional Meeting, Lexington, Kentucky, USA, 2007 Search PubMed.
- M. T. Byrne, M. A. Jimenez, E. A. Rojas and E. Castillo, SPE European Formation Damage Conference, Noordwijk, The Netherlands, 2011 Search PubMed.
- A. I. Mohammed, G. Oluyemi and S. D. Ibrahim, SPE Nigeria Annual International Conference and Exhibition, Lagos, Nigeria, 2013 Search PubMed.
- A. Farahani, M. Lastiwka, D. C. Langer, B. Demirdal, C. M. Matthews, J. Jensen and A. Reilly, SPE Annual Technical Conference and Exhibition, Texas, USA, 2011 Search PubMed.
- R. Russell and E. Marsis, SPE Heavy Oil Conference-Canada, Calgary, Alberta, Canada, 2013 Search PubMed.
- N. Kharoua, L. Khezzar and H. N. Saadawi, Abu Dhabi International Petroleum Conference and Exhibition, Abu Dhabi, UAE, 2012 Search PubMed.
- Y. Lu, M. Agrawal and H. B. Skeels, Offshore Technology Conference, Texas, USA, 2011 Search PubMed.
- T. Clemens, K. Tsikouris, M. Buchgraber, L. M. Castanier and A. Kovscek, SPE Reservoir Eval. Eng., 2013, 16, 144–154 CrossRef CAS.
- S. Mohammadi, A. Maghzi, M. Ghazanfari, M. Masihi, A. Mohebbi and R. Kharrat, Energy Sources, 2013, 35, 193–201 CrossRef CAS.
- C. Tsakiroglou and D. Avraam, J. Mater. Sci., 2002, 37, 353–363 CrossRef CAS.
- M. Robin, J. Behot and V. Sygouni, SPE Improved Oil Recovery Symposium, Tulsa, Oklahoma, USA, 2012 Search PubMed.
- H. Emami Meybodi, R. Kharrat and M. Nasehi Araghi, J. Pet. Sci. Eng., 2011, 78, 347–363 CrossRef CAS PubMed.
- S. Mohammadi, M. Hossein Ghazanfari and M. Masihi, J. Pet. Sci. Eng., 2013, 110, 40–54 CrossRef CAS PubMed.
- S. Mei, J. L. Bryan and A. Kantzas, SPE Heavy Oil Conference Canada, Calgary, Alberta, Canada, 2012 Search PubMed.
- M. Sohrabi, G. Henderson, D. Tehrani and A. Danesh, SPE Annual Technical Conference and Exhibition, Texas, USA, 2000 Search PubMed.
- P. Bedrikovetsky, Transp. Porous Media, 2008, 75, 335–369 CrossRef.
- A. Mandal, A. Bera, K. Ojha and T. Kumar, SPE International Oilfield Nanotechnology Conference and Exhibition, Noordwijk, The Netherlands, 2012 Search PubMed.
- F. Qiu, Canadian Unconventional Resources and International Petroleum Conference, Calgary, Alberta, Canada, 2010 Search PubMed.
- C. Chalbaud, M. Robin, S. Bekri and P. Egermann, International symposium of the society of core analysts, Calgary, Canada, 2007 Search PubMed.
- C. Laroche, O. Vizika and F. Kalaydjian, Pet. Geosci., 1999, 5, 65–69 CrossRef.
- A. Danesh, D. Krinis, G. Henderson and J. Peden, J. Pet. Sci. Eng., 1989, 2, 167–177 CrossRef.
- C. Zhang, M. Oostrom, T. W. Wietsma, J. W. Grate and M. G. Warner, Energy Fuels, 2011, 25, 3493–3505 CrossRef CAS.
- C. A. Kennedy and W. C. Lennox, J. Contam. Hydrol., 1997, 24, 221–246 CrossRef CAS.
- N. Sahloul, M. Ioannidis and I. Chatzis, Adv. Water Resour., 2002, 25, 33–49 CrossRef CAS.
- Y. Kim, J. Wan, T. J. Kneafsey and T. K. Tokunaga, Environ. Sci. Technol., 2012, 46, 4228–4235 CrossRef CAS PubMed.
- T. W. Willingham, C. J. Werth and A. J. Valocchi, Environ. Sci. Technol., 2008, 42, 3185–3193 CrossRef CAS.
- M. H. Ghazanfari, D. Rashtchian, R. Kharrat and S. Vossoughi, Chem. Eng. Technol., 2007, 30, 862–869 CrossRef CAS.
- H. Emami Meybodi, R. Kharrat and M. H. Ghazanfari, Europec/EAGE Conference and Exhibition, Rome, Italy, 2008 Search PubMed.
- A. Dehghan, S. Farzaneh, R. Kharrat and M. Ghazanfari, Canadian International Petroleum Conference, Calgary, Alberta, 2009 Search PubMed.
- G. Mason and N. R. Morrow, J. Colloid Interface Sci., 1991, 141, 262–274 CrossRef CAS.
- H. Princen, Colloids Surf., 1992, 65, 221–230 CrossRef CAS.
- A. Jafari, CFD simulation of complex phenomena containing suspensions and flow through porous media, Lappeenranta University of Technology, 2008 Search PubMed.
- A. Jafari, P. Zamankhan, S. Mousavi and K. Pietarinen, Chem. Eng. J., 2008, 144, 476–482 CrossRef CAS PubMed.
- L. Hendraningrat and O. Torsæter, Energy Fuels, 2014, 28, 6228–6241 CrossRef CAS.
- C. R. Miranda, L. S. De Lara and B. C. Tonetto, Proceedings of the SPE International Oilfield Nanotechnology Conference, Noordwijk, Netherlands, 2012 Search PubMed.
- O. Torsater, B. Engeset, L. Hendraningrat and S. Suwarno, SPE Kuwait International Petroleum Conference and Exhibition, Kuwait City, Kuwait, 2012 Search PubMed.
- A. J. Worthen, H. G. Bagaria, Y. Chen, S. L. Bryant, C. Huh and K. P. Johnston, J. Colloid Interface Sci., 2013, 391, 142–151 CrossRef CAS PubMed.
- I. Mahbubul, R. Saidur and M. Amalina, Int. J. Heat Mass Transfer, 2012, 55, 874–885 CrossRef CAS PubMed.
- K. Vafai, Handbook of porous media, CRC Press, New York, 2nd edn, 2010, ch. 4, p. 144 Search PubMed.
- J. Cai and B. Yu, Transp. Porous Media, 2011, 89, 251–263 CrossRef CAS.
- M. Sahimi, Flow and transport in porous media and fractured rock: from classical methods to modern approaches, John Wiley & Sons,Weinheim, Germany, 2012, 2nd rev., ch. 14, p. 539 Search PubMed.
| This journal is © The Royal Society of Chemistry 2015 |