 Open Access Article
Creative Commons Attribution 3.0 Unported Licence
Probing local site environments and distribution of manganese in SrZrO3:Mn; PL and EPR spectroscopy complimented by DFT calculations
Nimai
Pathak
*a,
Santosh K.
Gupta
*a,
P. S.
Ghosh
b,
A.
Arya
b,
V.
Natarajan
a and
R. M.
Kadam
a
aRadio Chemistry Division, Bhabha Atomic Research Centre, Mumbai-400085, India. E-mail: nmpathak4@gmail.com; santufrnd@gmail.com; Fax: +91-22-25505151; Tel: +91-22-25590715 ext. 0636
bMaterials Science Division, Bhabha Atomic Research Centre, Mumbai-400085, India
First published on 20th January 2015
Abstract
In order to understand the local environment, valence state and cationic distribution of manganese ions in gel-combustion derived SrZrO3 (SZO), a combined experimental and theoretical approach was formulated based on photoluminescence (PL), electron paramagnetic resonance (EPR) and density functional theory (DFT) calculations. An attempt was also made to investigate the same as a function of manganese ion concentration. The phase identification of the samples was confirmed using powder X-ray diffraction technique (PXRD). In all the doped compounds, manganese was found to be stabilized as divalent Mn2+ and preferentially occupying the 8-coordinated Sr2+ ion site. However, the proportion of manganese ions residing at zirconium sites was enhanced at higher concentrations. The cohesive energies from DFT calculations explained the stability of Mn2+ ions at different sites. It was also observed from the density of states (DOS) that the substitution of manganese at strontium sites leads to the generation of shallow defect states, whereas that at zirconium site generates both shallow and deep defect states within the band gap of the material. A change in the host emission due to these defect states with varied concentrations of Mn2+ was also observed, which further supported the observed cationic distribution's trend. The decrease in the band gap energy explained the red shift of the emission spectra. PL decay study also suggested the existence of shallow and deep trap states. The intensity of the EPR signal at g ≈ 1.976, due to paramagnetic oxygen vacancies, was found to increase at higher Mn-concentration because of more substitution at Zr4+ sites. Two additional EPR sextets with g ≈ 1.993 and 2.013 in Mn doped SZO compounds were attributed to lattice and surface bound Mn2+ ions, respectively, which disappeared at higher Mn-concentrations, giving a broad signal.
1. Introduction
Crystalline metal oxides have attracted considerable attention due to their wide applications in functional devices. Perovskite structured oxides (ABO3), in particular, were extensively investigated due to their excellent electronic, ferroelectric and optical properties and have been widely used as capacitors, sensors and photocatalysts.1–6 Strontium zirconate (SZO), with chemical formula SrZrO3, is a complex oxide with a number of useful properties for device applications. Its features include high-temperature proton conductivity,7 a large dielectric constant,8 resistance switching9 and ferroelectricity in artificial superlattices.10 SZO crystallizing in the perovskite (ABO3) structure is a class of compound that has significant current research interest due to the emergence of novel interface phenomena.11 Point defects are known to play an important role in oxide based material and it was found in many cases that they strongly influence the electronic and optical properties. They act as carrier-compensation centers, introduce optically active states in the band gap12 and sometimes act as a source of free carriers.13Recently considerable attention has been given to optical properties of undoped titanate and zirconate based systems with distorted perovskite structures. The main reason behind this is their application in opto electronics.14,15 The optical properties of disordered semiconductors are characterized by the presence of a broad photoluminescence (PL) band. The origin of such a broad PL band is attributed to the discrete electronic states inside the band gap, which are the main defects responsible for an intense PL response. Defect induced emission and the origin of multicolor emission in SrZrO3 have been studied previously by many researchers, including our group.16–22 According to Longo et al., the displacement of Zr or Sr atoms in disordered perovskite SrZrO3 may induce some vacancy defects at the axial and planar oxygen sites of the [ZrO6] octahedral.16 It is well known that the vacancy defects play an important role as luminescence centers, and thus it is expected that the perovskite SrZrO3 may show host emission. However, when an active dopant ion is introduced into these perovskites, their optical and magnetic properties are significantly changed depending on its distribution in the perovskite structure. Studies of dopant ion distribution in perovskite have attracted considerable attention because they may allow a better understanding of the correlations between structure and properties such as color, magnetic behaviour, catalytic activity and optical properties, which are strongly dependent on the occupation of the two sites by the dopant ion.
The ABO3 type perovskites, with various crystalline structures, show interesting physiochemical properties, which offer a potential host for the chemical substitution. Substitution at both A and B sites can lead to a change in symmetry and composition and thus create various defects viz. cation or oxygen vacancies, which can drastically influence the band structures, and this is the main factor in determining the electronic structures. In particular, these materials can accommodate lanthanide or transition metal ions at A-sites or B-sites; thus these doped oxides are not only used as probes to investigate local centers and energy, but also to provoke changes in their optical behavior. Moreover, the doping of foreign elements into a semiconductor with a wide band gap to create a new optical absorption edge is known to be one of the primary strategies for developing materials with optical-driven properties. Recently, lanthanide ion doped SrZrO3 materials have been widely investigated not only due to their significance to fundamental research, but also because of their high potential for application in optical materials.20,23–31
Oxide semiconductors, doped with transition metals, have also been investigated recently due to two major reasons: either in the quest for new dilute magnetic oxides (DMO) or for new multiferroic/magneto electric systems. Doping of oxide semiconductors with transition metals has often been considered as a way to induce a long-range magnetic ordering in a dielectric.32 The effect of Mn doping on the dielectric and magnetic properties of perovskite-like SrTiO3 has attracted considerable attention by researchers.33 Manganese doped SrTiO3 is currently widely investigated in order to improve the properties of these perovskite type incipient ferroelectrics for tunable microwave applications and due to the observation of new manganese related magnetic and dielectric effects.34 Transition metal (TM) ion, Mn2+, forms an ideal active center mainly due to the possibility of being tuned over a wide emission wavelength ranging from green to orange and eventually to red by appropriately modifying the crystal field of the host where the Mn2+ ions are located.35 Generally, tetrahedrally coordinated Mn2+ ions (in weak crystal field) exhibit a green emission, whereas the octahedrally coordinated ones (in strong crystal field) yield an orange to red emission.
A few reports do exist on Mn doped SrZrO3,36,37 but mostly from the phosphor perspective. Manganese dopant ion as a structural probe has seldom been reported in SrZrO3. Levin et al.33 have studied the coordination behavior of Mn in SrTiO3 (STO) using extended X-ray absorption fine structure (EXAFS) measurements with nominal compositions: SrTi0.98Mn0.02O3 (A) and Sr0.98Mn0.02TiO3 (B). In the case of A, Mn was stabilized only at the Ti site as Mn4+, whereas in the case of B, Mn segregated to both A-sites (as Mn2+) and B-sites (predominantly as Mn4+). Yang et al.38 have studied the PL properties of Mn doped SrTiO3 and investigated the effect of dopant ion concentration on its emission characteristics. The color of pure and Mn2+-doped STO with increasing dopant concentration changed from white to dark cyan gradually, indicating that doping of Mn2+ ions has significant influence on the optical properties of STO powders. Potucek et al.,34 also in their work on SrTiO3:Mn, confirmed the oxidation state of manganese as Mn4+ ions, substituted in octahedral coordinated Ti4+ sites. Valant et al.32 on similar systems concluded that at 3% doping level, Mn can be completely incorporated into SrTiO3, predominantly as Mn2+ at the A-site and at the B-site as Mn4+. Azzoni et al.,39 in another study, have established the oxidation state of Mn using EPR study, which showed that in SrTiO3:Mn, different environments of manganese ions are present with different concentrations of both Mn4+ and Mn2+ oxidation states. Although, in most of the reports it has been shown that Mn4+ ions are generally stabilised at high temperatures (more than 1000 °C).
However, none of the studies available to date explaining about the oxidation state and local site of manganese in SrZrO3. This is the first report of its kind, where manganese is used as a dopant ion for structural study in SrZrO3 using PL and EPR spectroscopic techniques as probes. Although various spectroscopic techniques exist for investigating the core and surface properties, EPR and PL are among the well established techniques for characterization of oxidation states. Manganese is the best candidate for EPR studies on different oxidation states and their local symmetry in solids. Varied concentrations of Mn doped SrZrO3 samples were prepared using a gel-combustion method at a temperature of 600 °C, and the changes in the local coordination and site occupancy of Mn were monitored using X-ray diffraction, PL and EPR techniques. Theoretically calculated cohesive energies and the analysis of the projected density of states (DOS) allowed us to elaborate on the energetics of site preferential Mn doping in SrZrO3 and the effect of doping on the electronic structure of SrZrO3, which in turn will affect the different types of host emissions.
2. Experimental
2.1. Synthesis
All the chemicals used in the sample preparation were of ‘Analytical Reagent’ grade and were procured from Sigma Aldrich. Zirconyl oxychloride (ZrOCl2), strontium nitrate Sr(NO3)2, ammonium nitrate (NH4NO3) and citric acid (C6H8O7·H2O) were used as starting materials for the synthesis. Citric acid with molar concentration of 2 M was used as a fuel and ammonium nitrate as an oxidant. The detailed procedure for the synthesis of SrZrO3 has been described in our earlier report.20 Varied concentrations of MnCO3 (0.1, 0.5, 1.0, 2.5 and 5.0 mol%) were used for the synthesis of the doped compounds.2.2. Instrumentation
Powder XRD patterns of the samples were recorded using RIGAKU Miniflex-600 diffractometer, operating in the Bragg–Brentano focusing geometry. Cu-Kα radiation (λ = 1.5406 Å) has been used as the X-ray source. The instrument was operated at 40 kV voltage and 30 mA current. The XRD patterns were taken with scan rate of 1° per minute. PL data were recorded using an Edinburgh CD-920 unit equipped with M 300 monochromators. The data acquisition and analysis were performed using F-900 software provided by Edinburgh Analytical Instruments, UK. A Xenon flash lamp with a frequency range of 10–100 Hz was used as the excitation source. Emission spectra for a particular sample were recorded with a lamp frequency of 100 Hz. Multiple scans (at least five) were taken to minimize the fluctuations in peak intensity and maximize S/N ratio. Fluorescence lifetime measurements were based on a well established time-correlated single-photon counting (TCSPC) technique.EPR spectra were recorded using a Bruker EMM-1843 spectrometer operating at X-band frequency (9.4186 GHz) equipped with 100 kHz field modulation and phase sensitive detection to obtain the first derivative signal. Diphenyl picrylhydrazyl (DPPH) was used for calibration of the g-values of paramagnetic species. The simulation of the experimental spectra were performed using Bruker WINEPR Simfonia programme.
2.3. DFT calculation methodology
The calculations were performed using the density functional theory (DFT) with the plane wave pseudopotential formalism as implemented in Vienna ab initio simulation package (VASP).40,41 We imposed the generalized gradient approximation (GGA) for the exchange and correlation potentials as parameterized by Perdew, Burke and Ernzerhof (PBE).42 The projector augmented wave (PAW) potentials43 were used for the ion–electron interactions, including the valence states of Sr (4s, 4p, 5s – 10 valence electrons), Zr (4s, 4p, 5s, 4d – 12 valence electrons), Mn (3p, 4s, 3d – 13 valence electrons) and O (2s, 2p – 6 valence electrons). In our calculations, the Kohn–Sham single particle wave functions were expanded on a plane wave basis with kinetic energy cut-off of 500 eV, and it was shown that the results were well converged at this cut-off. For orthorhombic SrZrO3 (SZO) structure, optimization was carried out with respect to Ecut and k-point meshes to ensure the convergence of total energy to a precision within 0.1 meV per atom. The Brillouin-zone (BZ) integrations were performed using an optimized Monkhorst–Pack44k-point grid of 12 × 12 × 8 for SZO and 4 × 8 × 8 for 2 × 1 × 1 supercell of SZO. We studied three systems, namely, pure SrZrO3 (SZO), Sr1−xMnxZrO3 (SMZO) and SrZr1−xMnxO3 (SZMO). For SMZO, one or two Sr2+ ions were replaced by Mn2+ ions, whereas for SZMO, one or two Zr4+ ions were replaced. We performed spin polarized GGA calculations for Mn doped structures. The total energy of SZO, SMZO and SZMO was optimized with respect to volume (or lattice parameter), b/a, c/a ratios and atomic positions. The structural relaxations (b/a, c/a ratios and atomic positions) were performed for each structure using the conjugate gradient algorithm until the residual forces, and stress in the equilibrium geometry were of the order of 0.005 eV Å−1 and 0.01 GPa. The final calculation of total electronic energy and density of states (DOS) were performed using the tetrahedron method with Blöchl corrections.45 The strong on-site Coulomb repulsion among the Mn 3d electrons was considered by employing a rotationally invariant method proposed by Dudarev et al.46 along with the PBE form of GGA (GGA + U). In this method, the total energy depends on the difference between the Coulomb, U, and exchange, J, parameters. The Ueff, which is known as the U–J parameter, adjusts the electron correlation contribution (on-site columbic effects) and was set at 5.04 eV for Mn-3d electrons.473. Results and discussion
3.1. Structural analysis: XRD
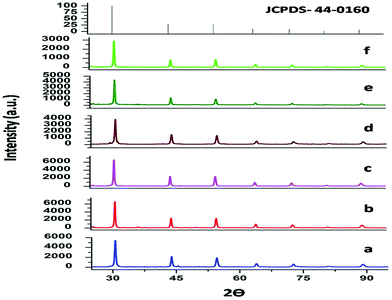
The XRD patterns of both SrZrO3 and Mn doped SrZrO3 samples, annealed at 600 °C, are shown in Fig. 1. All the diffraction peaks match very well with the standard values of the orthorhombic phase of SrZrO3 (ICDD file no. 44-0161) with no other phase being detected, revealing that the doped manganese ions are incorporated into the host lattice and that the incorporation of manganese in SrZrO3 has not distorted the crystal structure. The XRD data were indexed to the space group Pnma. The calculated cell constants from the indexing program of the undoped and doped compounds with varying dopant concentration are listed in Table 1.| Mol% of Mn2+ | Cell constants (Å) | Cell volume (Å)3 (a × b × c) | ||
|---|---|---|---|---|
| a | b | c | ||
| 0 (blank) | 5.8207 | 8.2077 | 5.8006 | 277.1211 |
| 0.1 | 5.8170 | 8.2040 | 5.7970 | 276.6483 |
| 0.5 | 5.8153 | 8.2035 | 5.7950 | 276.4551 |
| 1.0 | 5.8137 | 8.2031 | 5.7937 | 276.3036 |
| 2.5 | 5.8153 | 8.2035 | 5.7954 | 276.4742 |
| 5.0 | 5.8155 | 8.2036 | 5.7956 | 276.4966 |
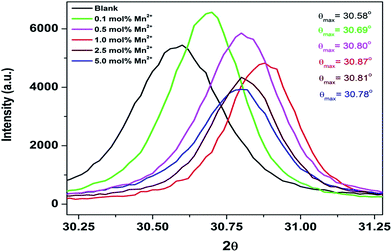
As seen from the table, the cell constant values for all the doped compounds are less than that of the undoped compound. Cell constant values initially decreased for up to 1.0 mol% concentration and then started increasing. This observed trend is also substantiated by the shifting of the diffraction peaks for all the compounds, which is inversely related to the lattice constant value, as shown in Fig. 2. The figure shows a shifting in the position of the diffraction peak (2θ ≈ 30.58°) towards higher theta for all the doped compounds with respect to the undoped one. Up to 1.0 mol% concentration, there is an initial increase of 2θ values, beyond which the 2θ values started decreasing.
The structure of an ideal perovskite can be described as an association of [AO12] and [BO6] groups. In SrZrO3, the size of the Sr ion is smaller than the hole in an undistorted structure. The incorporation of a smaller ion into the perovskite structure is accompanied by a rotation of the octahedral, leading to the lowering of the symmetry with respect to an ideal perovskite, in which the coordination numbers of Sr or Zr ions or both are reduced.25 Tilting of the ZrO6 octahedra reduces the coordination of an undersized Sr cation from 12 to as low as 8. Conversely, off-centering of an undersized Zr cation within its octahedron allows it to attain a stable bonding pattern. For this reason, SrZrO3 is considered to be pseudo cubic or orthorhombic at room temperature.48 The observed trend in lattice constant values with different Mn2+ doping concentrations can be understood only on the basis of the size of the dopant ion and the cations to be substituted.
From an ionic radii point of view, the 8-coordinated manganese ion has a smaller ionic radius (0.96 Å) than the same coordinated Sr2+ ion (1.26 Å), whereas the 6-coordinated manganese ion has a larger ionic radius (0.83 Å) than the same coordinated Zr4+ ion (0.72 Å).49 Thus, if manganese ion occupies Sr2+ sites, a decrease in the cell constant value would be expected, and if it occupies Zr4+ sites, then the expected trend would be an increase in the cell constant value. Two observations can be made from Table 1: (a) lattice constant values at all Mn concentrations are lower than that of the undoped sample; (b) it shows a decreasing trend up to 1 mol% followed by an increasing trend. This suggests that for the entire range of concentration, the fraction of manganese ions residing at the Sr2+ site is greater than that at octahedral Zr4+ site. However, for a higher doping level (2.5 and 5.0 mol%), the fraction of Mn2+ ions residing at octahedral Zr4+ site has increased considerably compared to the lower doping level (0.1–1.0 mol%). This might be because of the fact that at higher concentrations, charge compensation gets relaxed and size matching has the dominating effect because the size difference between 6-coordinated Mn2+ and Zr4+ ions is less than that between 8-coordinated Mn2+ and Sr2+ ions.
3.2. Photoluminescence spectroscopy
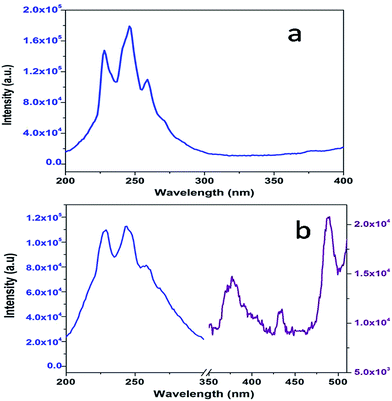
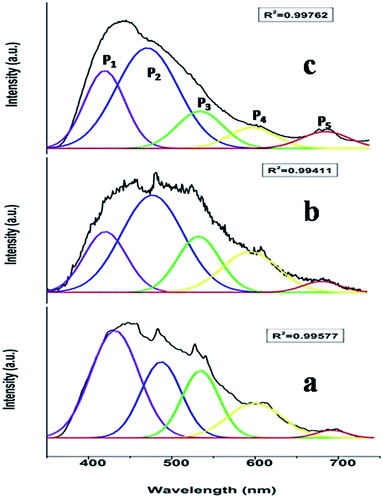
Fig. 3a shows the excitation spectrum of undoped SrZrO3. There is a peak at around 250 nm, which is ascribed to the host absorption band (HAB), arising due to O to Zr charge transfer.20,25,50 The excitation spectrum of 0.1 mol% manganese ion doped SrZrO3 is shown in Fig. 3b. It shows that in the case of the doped sample, there is also a broad peak in the same region, which is ascribed to the overlap of the charge transfer (CT) bands from oxygen to manganese (O–Mn) and the host band (O–Zr). In the case of the doped sample, along with HAB, the excitation spectrum also consists of a few peaks at around 375, 438 and 489 nm. These peaks match with the reported excitation bands of Mn2+ doped CaAl2Si2O8,51 but are slightly red shifted due to the variation in the effect of the ligand field. These peaks are attributed to the transitions involving 6A1 (6S) → 4T2 (4D), 6A1 (6S) → 4T2 (4G) and 6A1 (6S) → 4T1 (4G) of Mn2+ levels.Fig. 4a and b show the room temperature emission spectra of undoped and 0.1 mol% manganese ion doped SZO. Based on the Gaussian line broadening mechanism for luminescence processes, the PL curves of the undoped and doped samples were deconvoluted. The PL spectra shown for undoped SZO in Fig. 4a represent three PL components after peak fit deconvolution, which are violet-blue at λmax ≈ 430 nm (P1), blue-green at λmax ≈ 490 nm (P2), and yellow-orange at λmax ≈ 600 (P4). This multicolor emission is attributed to the presence of various defect states within the band gap of the material. As reported in various studies and also explained by our earlier report, each color arises due to a different electronic transition and is linked to a specific structural arrangement.16–20 Violet-blue emission (P1) can be associated with shallow defects, and yellow-orange emission (P4) (and also red) is associated with deeper defects. The blue-green emission (P2) is associated with surface defects.52,53
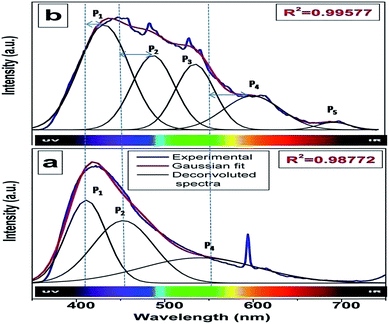 | ||
| Fig. 4 Room temperature emission spectrum of (a) pure SZO and (b) 0.1 mol% Mn2+doped SZO with λex = 255 nm. | ||
As far as the manganese doped sample is concerned, in addition to the host emission, two additional peaks at 540 nm (P3) and 680 nm (P5) were also observed. Manganese ions can be stabilized in the host lattice in divalent, trivalent or tetravalent oxidation states. In general, the Mn4+ ion exhibits a narrow emission band within the range of 600–700 nm with four sharp peaks occurring at about 643, 656, 666, and 671 nm due to the 2E → 4A2 transition.54–58 The absence of such peaks eliminates the possibility of stabilizing Mn as Mn4+ in the matrix. Size matching also does not guarantee the stabilization of Mn as Mn(IV) (ionic radius of 6 coordinated Mn4+ = 0.53 Å) either at Sr2+ (1.26 Å) or Zr4+ (0.72 Å) site. Moreover, in the XRD study, a continuous decrease in the cell constant values would have been observed with increasing doping level, as Mn4+ is smaller in size than both Sr2+ and Zr4+ ions. Based on four analogies, (a) spectral features in the excitation and emission spectra, (b) size matching assumption, (c) observed cell constant values and (d) low combustion temperature, we can propose that the manganese ion is stabilizing as Mn2+ in SrZrO3.
Generally, the tetrahedrally coordinated Mn2+ ions (in weak crystal field) exhibit a green emission, whereas the octahedrally coordinated ones (in strong crystal field) yield an orange to red emission.59–62 Recently, similar emission behavior in different crystal field environments has been reported by us on another d5 TM ion, Fe3+ in ZnAl2O4.63 It is worth noting that in our present case, there are two different Mn2+ emission bands (a green band at 540 nm, P3 and a red band at 680 nm, P5), which suggest that two different types of crystal fields are experienced by Mn2+ ions in SrZrO3. As explained earlier, in SrZrO3, which has a distorted perovskite structure, Sr is surrounded by 8-oxygens and Zr by 6-oxygens. The mean Zr–O bond length is 2.10 Å, which is considerably shorter than that of the Sr–O bond length of 2.96 Å,59 which suggests that the crystal field effect at the Zr4+ site is stronger than at Sr2+. For this reason, the P5 emission band at the longer wavelength is attributed to the luminescence of Mn2+ ions located at Zr4+ sites (characterized by a stronger crystal field and nephelauxetic effect), whereas the P3 emission band at the shorter wavelength originates from the luminescence of Mn2+ ions located at Sr2+ sites. Based on theoretical calculations using DFT (discussed later), it was observed that Mn doping in the SZO lattice leads to reduction in the band gap, which is manifested in the shifting of SZO bands to higher wavelength in the doped compounds.
To investigate the effect of doping concentration, we further prepared varied concentrations of Mn ion doped SZO samples (0.1, 0.5, 1.0, 2.5 and 5.0 mol%). Fig. 5 shows the variation of intensity ratios of peaks P5 to P3 and P4 to P1 with concentration. It can be seen from the figure that at all concentrations, the intensity of P3 is greater than that of P5, justifying our XRD results that Mn preferentially occupies Sr2+ sites. As we increase the concentration, the ratio of P5/P3 increases. Three representative deconvoluted emission spectra are given in Fig. 6 for 0.1, 2.5 & 5.0 mol% of manganese ion. It can be seen from the spectra that at higher concentrations, the emission intensity of the P3 band reduces drastically along with the substantial increase in the P5 band. In other words, emission due to Mn sitting at Sr2+ sites decreases, whereas that from Mn sitting at Zr4+ sites increases i.e. at higher concentration, the proportion of Mn ions occupying Zr4+ sites is more than that at lower concentration. This is another proof for the XRD results explained in the previous section.
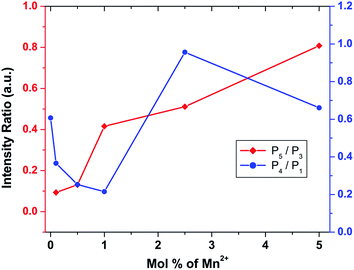 | ||
| Fig. 5 Variation of the intensity ratios of peak P5 to P3 and P4 to P1 with different mol% of Mn2+ ion. | ||
Fig. 6 reveals that at all concentrations, the emission intensity of the P1 band is greater than that of P4. As shown in Fig. 5, the ratio of P4 to P1 tends to decrease up to 1 mol%, and beyond this it starts increasing and reaches a saturation value at higher concentrations. As stated earlier, P1 and P4 bands are linked to shallow and deep defect states of the SZO matrix, respectively. Thus an initial decrease in the P4/P1 ratio indicates an increase in the population of shallow defect states, whereas the increasing value of the P4/P1 ratio indicates an increase in the population of deep defect states. Later, by our GGA + U calculated total and partial DOS of Mn doped SZO, we will show that Mn2+ substitution at Sr sites is linked to shallow defect states only, whereas that at Zr sites is linked to both deep and shallow defect states in the band gap. Thus any emission (P4) coming from deep defect states will be because of the substitution at Zr sites only, whereas emission (P1) coming from shallow defect states will be because of the substitution at both Sr & Zr sites. Thus the observed P4/P1 ratio indicates that at all concentrations, the fraction of Mn2+ ions sitting at Sr2+ sites is greater than at Zr4+ sites. Initially, at lower concentrations (up to 1.0 mol%), the fraction of Mn2+ ions substituting Sr2+ ions increases and thereby increases the P1 emission intensity. However, at higher concentrations (beyond 1.0 mol%), there is a site swapping of Mn2+ ions towards Zr4+ sites, which leads to an increase in the P4 emission intensity. Fig. 7 shows the pictorial representation for the origin of different components in the emission spectrum of SrZrO3:Mn2+ and their respective changes at different doping levels. The higher intensity of the P2 band at higher doping levels might be due to a greater number of surface defects of the SZO particles at higher Mn2+ ion concentrations.
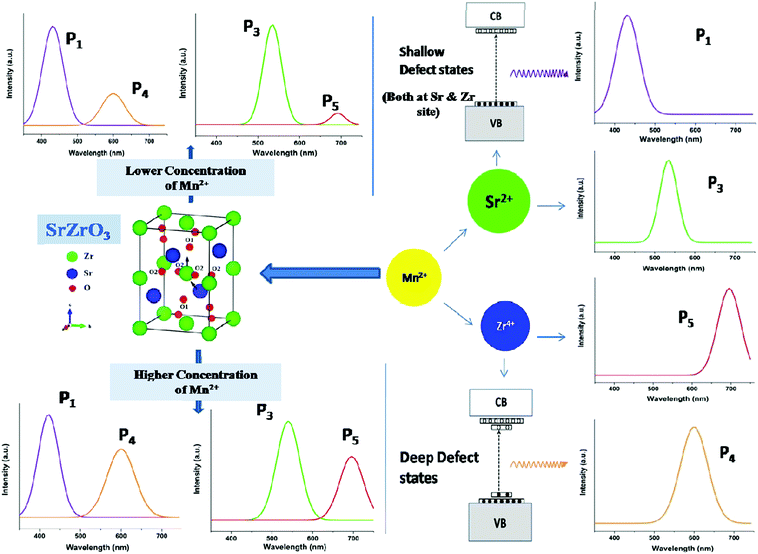 | ||
| Fig. 7 Pictorial representation for the origin of the different peaks of SrZrO3:Mn2+ and their variation with doping level. | ||
3.3. Emission kinetics study
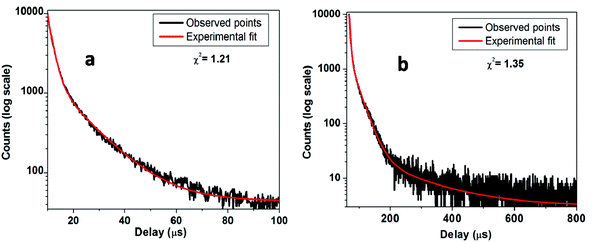
Fig. 8a shows the PL decay curves for SZO compounds at emission wavelength λem = 480 nm and at excitation wavelength λex = 250 nm. The decay curve for SZO was best fitted on a 100 μs scale using the bi-exponential decay equationI(t) = A0 + A1![[thin space (1/6-em)]](https://www.rsc.org/images/entities/char_2009.gif) exp(−t/τ1) + A2 exp(−t/τ1) + A2![[thin space (1/6-em)]](https://www.rsc.org/images/entities/char_2009.gif) exp(−t/τ2) exp(−t/τ2) | (1) |
The average lifetime values for slower decaying species is 12.0 μs, whereas for fast decaying species, the values are around 2.0 μs. As explained in an earlier section, there are shallow and deep defects within the band gap of SrZrO3 nanoparticles. Faster decaying species, therefore, can be attributed to a radiative recombination process from deep defects, whereas slower decaying species can be attributed to a similar phenomenon from shallow defects.20,64
For the decay curve (Fig. 8b) at λem = 540 nm and λex = 250 nm, corresponding to the 0.1 mol% Mn doped SZO, a good fit was found on an 800 μs scale using the following tri-exponential equation.
I(t) = A0 + A1![[thin space (1/6-em)]](https://www.rsc.org/images/entities/char_2009.gif) exp(−t/τ1) + A2 exp(−t/τ1) + A2![[thin space (1/6-em)]](https://www.rsc.org/images/entities/char_2009.gif) exp(−t/τ2) + A3 exp(−t/τ2) + A3![[thin space (1/6-em)]](https://www.rsc.org/images/entities/char_2009.gif) exp(−t/τ3) exp(−t/τ3) | (2) |
| Mol% of Fe3+ | τ 1 (μs) | τ 2 (μs) | τ 3 (μs) | Chi2 |
|---|---|---|---|---|
| 0 (blank) | 1.99 | 12.24 | — | 1.623 |
| 0.10 | 1.49 | 13.65 | 68.74 | 1.232 |
| 0.5 | 2.20 | 13.94 | 74.46 | 1.351 |
| 1.0 | 1.58 | 12.41 | 83.19 | 1.084 |
| 2.5 | 1.60 | 11.87 | 51.34 | 1.445 |
| 5.0 | 1.62 | 15.12 | 49.25 | 1.223 |
3.4. EPR studies
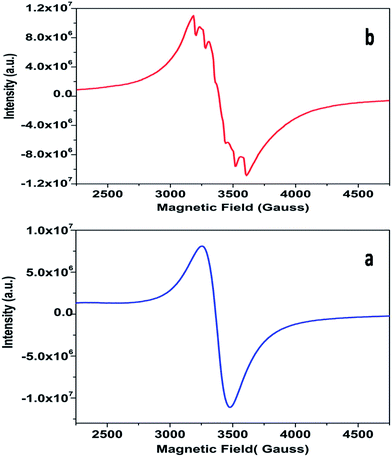
EPR spectroscopy is an excellent tool for identifying and qualitatively monitoring complex oxygen vacancies that modify the electronic and ionic conductivities or grain boundary properties. The EPR spectrum of pure SZO (Fig. 9a) shows an intense and asymmetric signal at g = 1.976 at room temperature, which indicates the presence of some type of intrinsic defects in the as prepared material. This signal corresponds to singly ionized oxygen vacancies and vacancy-related defects65–67 with the g-value in the range of 1.9560–2.0030. The change in the value of g for
  in different systems is related to differences in the method employed for synthesis, chemical environment and heat treatment conditions. The broad line width of this signal indicates a certain degree of heterogeneity (several species differ slightly in spectral parameters), typical of disordered environments such as those found at the surface of nanostructured crystals. Such a broad signal is also found in the case of nanocrystalline titania, which the authors have attributed to species formed at the surface of TiO2.68
Matta et al.69 employed EPR to understand the phase transition from tetragonal to monoclinic zirconia and observed a signal g = 2.0018, which was attributed to trapped single electrons located in oxygen vacancies of ZrO2. Lin et al.70 reported that the EPR band at g = 1.9800 is related to oxygen vacancies. Thus, in the disordered structure, these  are linked to ZrO5 clusters, called
  oxygen complex clusters.71
The powder EPR spectrum corresponding to 0.1 mol% Mn2+ doped SZO is shown in Fig. 9b, which shows six line patterns. In the SZO lattice containing 0.1 mol% Mn ions, hyperfine transitions are possible due to the resonance associated with the dipole-allowed ΔMS = ±1 with ΔMI = 0 that is ±5/2 ↔ ±3/2, ±3/2 ↔ ±1/2 and +1/2 ↔ −1/2 transitions. However, the random orientations cancel out the anisotropic contributions from ±5/2 ↔ ±3/2 and ±3/2 ↔± 1/2 transitions. Thus only +1/2 ↔ −1/2 transition shows six line patterns. These signals are attributed to Mn2+ incorporation inside the lattice sites (Sr2+/Zr4+) of SZO particles. In addition, it is possible to observe weaker kinks in the spectrum, which are produced by fine and hyperfine resonance from Mn2+ ions located on the surface. They can also be generated from the forbidden transition of Mn2+ ions. The substituted Mn2+ magnetic ions inside the lattice sites (Sr2+/Zr4+) of SZO particles generated an EPR signal SI (g ≈ 1.993), and the ions located near the surface produced a less intense EPR signal SII (g ≈ 2.013), as shown in the simulated spectra for both 1st and 2nd harmonic EPR spectra of 0.1 mol% Mn2+ doped SZO in Fig. 10a and b. Our PL data (Fig. 6) have also shown an increase in the surface defect related emission intensity (P2) with increasing Mn ion concentration. This was probably due to an increase in surface defects with increasing Mn ion concentration on the surface of the particles, which ruled out the assumption of the SII signal due to the forbidden transitions of Mn2+ ions. In addition to SI and SII, the EPR spectrum also includes another broad signal SIII due to single-electron trapped oxygen vacancies for all the doped compounds. Arik et al. have also reported surface defect-related luminescence properties of SnO2 nanorods and nanoparticles in the visible region. They have shown that the greater the surface defects, the greater will be the emission in the visible region, whereas the lesser the surface defects, the greater will be the higher band edge violet emission.72 They have also shown that the greater the surface defects, the greater is the intensity of SIII signals in EPR spectroscopy. We have already reported the formation of sphere like SZO nanoparticles with the same synthetic procedure.20 The simulated SI, SII and SIII EPR signals as well as their combined effects STotal for dipole-allowed transitions ΔMS = ±1 with ΔMI = 0 were compared with the experimental spectrum recorded for 0.1 mol% Mn2+ doped SZO. The parameters used for numerical simulation of the experimental EPR spectrum for 0.1 mol% Mn2+ doped SZO are included in Table 3.
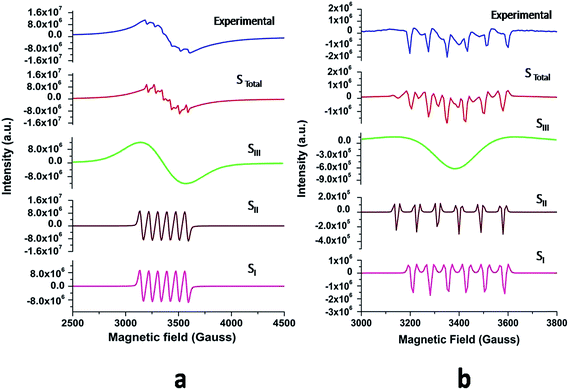 | ||
| Fig. 10 (a) First and (b) second harmonic EPR spectra of 0.1 mol% Mn2+ doped SZO samples (blue) and their simulated signals SI, SII, SIII and STotal = SI + SII + SIII. | ||
| Simulated components | g values | Electronic spins (S) | Nuclear spin (I) | Hyperfine coupling constant (A) in Gauss | Line width (ΔH) in Gauss |
|---|---|---|---|---|---|
| SI | 1.993 | 5/2 | 5/2 | 83 | 19 |
| SII | 2.013 | 5/2 | 5/2 | 76 | 17 |
| SIII | 1.976 | 1/2 | — | — | 230 |
Fig. 10a and b show an excellent agreement between the experimental spectrum and the simulation using the simulation parameters listed in Table 3, which indicates the stabilization of divalent Mn2+ ions in the lattice,73 further justifying our luminescence data to support the stabilization of Mn(II) in the SZO lattice. It can also be observed from our EPR spectra that the broad signal is more intense than the fine structure embedded in it, confirming strong host contribution even in the doped sample. The simulation parameters agree reasonably well with the values reported in the studies for different Mn2+ doped nanocrystals, having Mn2+ ions both at surface and inside the core.74–76
Fig. 11 shows the dependence of EPR spectra on dopant ion concentration. At high Mn2+ ion concentration, the hyperfine splitting completely disappears and the spectrum merges into one broad signal with a slight decrease in line width. There are two contributions to the EPR signal coming from Mn2+ ions with concentration up to 1.0 mol%: (i) a broad resonance line of Lorentzian shape arising from spin–spin interactions between different Mn2+ centers in the core of the particles or the undiluted adsorbed Mn2+ ions as MnO on the surface of the particle in a cluster-like assembly such that the hyperfine structure collapses to a single line, and (ii) a set of six hyperfine lines from isolated Mn2+ centers (six allowed central Ms = 1/2 ↔ −1/2 hyperfine transitions). With increasing dopant concentration, contributions from dipolar interactions between Mn centers become dominant, such that only one single line is detected for the samples with the highest Mn content. The initial increment in the line width can be attributed to Mn–Mn energy transfer and the prevalence of exchange interactions over the hyperfine interactions. For the heavily Mn2+ doped samples (5 mol%), both fine and hyperfine structures are too weak and result in only a broad EPR spectrum, reassembling a free-like state for S = 1/2 and MS = ±1/2. The disappearance of hyperfine lines and the observation of a single broad EPR line suggest that the Mn2+ ions are not completely diluted and strong dipole–dipole interactions persist between them, both in the core and on the surface of the particles, at higher concentrations of Mn. On increasing the Mn concentration to 5 mol%, there is an exchange narrowing effect between the Mn2+ ions, and as a result, a decrease in the singlet line width is observed. Again, the line broadening corresponding to the heavily doped Mn2+:SZO particles may not be only due to dipole–dipole interactions between paramagnetic Mn2+ ions, but may also be due to dipole–dipole interactions between the paramagnetic single-electron trapped oxygen vacancies  . Because the contribution of SIII is more to the STotal value, as shown in Fig. 10, any change in SIII value will be reflected in the value of STotal. Thus the increase in the intensity of the EPR spectra at higher doping level is not only due to an increase in the concentration of paramagnetic Mn2+ ions, but also due to an increase in the intensity of the SIII signal. This suggests an increase in the concentration of paramagnetic single-electron trapped oxygen vacancies
  . This is possible only when Mn2+ ions are either going to the surface and thereby creating surface defect related oxygen vacancies or substituting Zr4+ ions and thereby creating oxygen vacancies due to charge compensation. This also suggests that at higher concentrations, the number of Mn2+ ions substituting Zr4+ ions or present on the surface of the particles is also increased. Thus both the explanations are supported by our earlier observed photoluminescence data and vice versa.
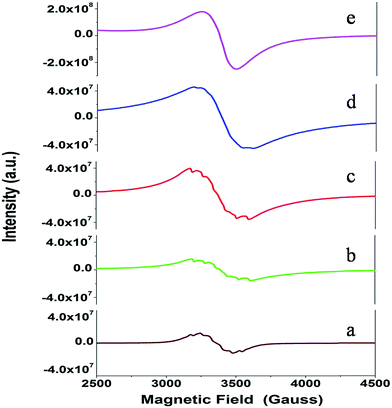 | ||
| Fig. 11 The EPR spectra recorded for the Sr1−xMnxZrO3 samples with concentration: (a) x = 0.001, (b) x = 0.005, (c) x = 0.01, (d) x = 0.025 and (e) x = 0.05. | ||
3.5. Theoretical studies
| Mn doping concentration | Energy of SMZO (eV per atom) | Energy of SZMO (eV per atom) | Energy of SMZMO (eV per atom) |
|---|---|---|---|
| 2.5% | 0 | 0.203 | 0.105 |
| 5% | 0 | 0.403 | 0.208 |
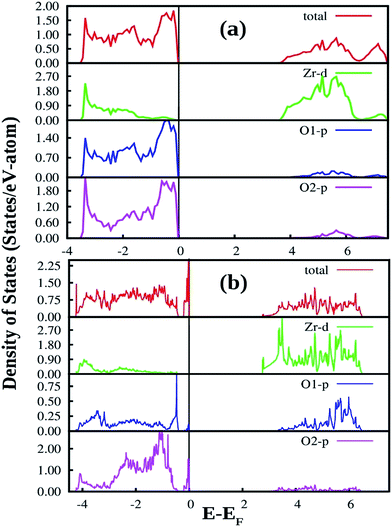 | ||
| Fig. 12 Total and orbital angular momentum projected DOS for (a) SZO and (b) fm-SZO models. O1 and O2 correspond to axial and planar oxygen atoms, respectively. | ||
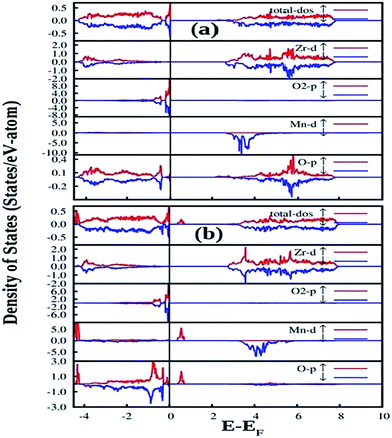
Fig. 12a also shows the total and angular momentum resolved DOS of SZO for Zr 4d and O 2p states. We can clearly observe that the valence band (VB) is dominated by O 2p states, taking equivalent contributions from axial (O1) and planar oxygen atoms (O2). The small amount of Zr 4d states in this vicinity indicates the hybridization between the O 2p and d orbitals of the Zr-site. The conduction band (CB) is comprised mainly of Zr 4d states. The contribution from Sr in the valence and conduction band is negligible. Fig. 12b shows total and partial DOS of disordered SZO associated with structural complex vacancies, abbreviated by former-modifier disorder model (fm-SZO), where Sr and Zr atoms are shifted simultaneously with displacement vectors of (0.35 0.0 0.35) and (0.0 0.0 0.5) Å in the unit cell of SZO, respectively.20 This displacement produced a distortion in the unit cell and the structures can be designated as  and
and  . In the total DOS, the VB is composed of O 2p states, and the upper part of the VB, that is, the new states are composed mainly of axial oxygen 2p states and planar oxygen 2p states. The new states, which are present very close to the VB maxima, are described as shallow defects, and states that are present just below the Fermi energy can be ascribed to deep defect states, evidently shown in Fig. 12b. The calculated electronic band gap in this fm-SZ defect structure is 2.76 eV. It is trivial to note that O1's are present just above and below the position of the displaced Zr atoms and O2's are present in the same plane as the undisplaced Zr atom. In a nutshell, we can tell that displacing the position of both former and modifier (Sr and Zr) reduces the band gap from 3.7 eV to 2.76 eV.
Fig. 13 shows our GGA + U calculated total and partial DOS of fm-SMZO and fm-SZMO with 2.5% Mn doping in Sr and Zr positions, respectively. The spin up (majority) and spin down (minority) are shown in separate panels. Similar to those of pure SZO, the Fermi energy was set at the zero energy value so that the relative positions of each state could be easily identified. According to Fig. 13a, doping of Mn at the Sr site yields slight or nearly no change in the overall DOS of fm-SZ. The projected DOS for Zr and O2 (planar oxygen atom) in SMZO exhibits similar patterns with respect to that of the fm-SZO model, as described previously. However, it is interesting to note that the O atoms, which are present in the 1st NN of the Mn atom, contribute strongly in the energy range −0.5 to −1.0 eV (just below the EF in VB). In the VB region, no Mn d state contribution is present, and the band-gap in this case is 2.14 eV. On the other hand, Fig. 13b indicates that the doping of Mn at the Zr site yields some change in the overall DOS of fm-SZO. However, changes occur mainly at the forbidden energy region as well as in the region where shallow and deep defect states are present. Off course, some new states appear in the lower part of the VB; however, those regions are not of our interest from the view of photoluminescence properties of Mn doped SZO. The projected DOS of Zr and O of SZMO exhibit similar patterns with respect to those of fm-SZO in the region of our interest. Our calculations also signify that DOS corresponding to shallow and deep defects states get modified compared to fm-SZO due to the presence of additional states coming from Mn–O bonding and the distortion created by Mn in the oxygen sub-lattices. Therefore, Mn doping in Zr sites has a strong impact on the electronic structure corresponding to the defect states by creating greater distortion in the oxygen sub-lattices, compared to the doping in Sr sites. This strong impact comes at the cost of additional energy corroborated by the fact that Mn doping is energetically less favorable in Zr positions compared to Sr positions. The band gap in this case is 2.04 eV (measured after the new Mn d states in the band gap). Thus, Mn doping in fm-SZO reduced the electronic band gap irrespective of the site preference of Mn, which suggests a red shift of the emission spectra, as observed in our PL study shown in Fig. 4.
Another notable observation in the case of fm-SMZO (Fig. 13a) is that the oxygen atoms, which are present in the 1st NN of the Mn atoms, contribute strongly in the energy region of the shallow defect states, both in majority and minority spin components. This suggests that Mn substitution at Sr sites leads to disorder in the matrix, which is linked to shallow defect states and leads to more energetic PL emissions (violet-blue light). In the case of fm-SZMO (Fig. 13b), the oxygen atoms, which are present in the 1st NN of the Mn atoms, contribute strongly in the energy region of both shallow and deep defect states in the majority spin components, whereas the minority spin components contribute mainly in the shallow defect states region. This confirms that substitution of Mn at Zr sites is linked to both deep and shallow defect states.
4. Conclusion
In summary, SrZrO3 and Mn2+doped (0.1, 0.5, 1.0, 2.5 and 5 mol%) SrZrO3 compounds sintered at 600 °C were synthesized by the sol–gel combustion method as well as characterized systematically using XRD, EPR, and PL experimental techniques. XRD data showed a decrease in the cell constant values up to 1.0 mol% concentration of Mn2+, followed by an increase in the values. Mn was mostly stabilized as Mn2+ in SrZrO3 due to low combustion temperature. It showed two distinct peaks at 540 nm (P3) and 680 nm (P5) due to substitution at Sr and Zr sites, respectively. The higher P5/P3 ratio at higher concentration suggested site swapping of Mn2+ ions towards Zr sites. Emission due to shallow defect states was prominent when Mn2+ ions were preferentially substituted for Sr2+ ions, whereas emission due to deep defect states was prominent for substitution at Zr-sites. Both PL and XRD studies jointly confirmed a preferential distribution of Mn2+ ions at Sr sites. However, as the concentration of Mn2+ ions was increased, the distribution of Mn2+ ions at Zr sites was also increased.EPR studies revealed the existence of paramagnetic oxygen vacancies  at g ≈ 1.976 (SIII) and the presence of two sextets due to lattice (SI) and surface (SII) bound Mn2+ ions with g values 1.993 & 2.013, respectively. At higher concentrations of Mn2+ ions, the hyperfine splitting completely disappeared and the spectrum merged into one broad signal due to strong dipole–dipole interactions. The SI signal was attributed to oxygen vacancies
  at g ≈ 1.976 and linked to
  oxygen complex clusters. The intensity of the signal was found to increase with an increase in Mn2+ ion concentration, which was probably due to greater Mn2+ ion distribution at Zr sites and the presence of more Mn2+ ions on the surface of the particles.
The calculated cohesive energies using DFT elaborated that Mn doping at Sr sites is energetically more favorable than at Zr sites. The GGA + U calculated total and partial DOS of fm-SMZO explained that substitution at Sr sites leads to disorder in the matrix, which is linked to the shallow defect states in the band gap and leads to more energetic PL emissions (violet-blue light), whereas Mn substitution at Zr sites (fm-SZMO) can be linked to both deep and shallow defect states in the band gap. The decrease in the band gap explains the red shift of the emission spectra which corroborates well with the observed PL study.
Acknowledgements
The authors are grateful to Dr A. Goswami, Head, Radiochemistry Division at Bhabha Atomic Research Centre, for his keen interest and encouragement during the course of this work. The authors are also thankful to Mr Kaushik Sanyal, Fuel chemistry Division at Bhabha Atomic Research Centre, for X-ray patterns and analysis.References
- M. G. Brik, J. Phys. Chem. Solids, 2006, 67, 856 CrossRef CAS
.
- Y. Xie, H. Yu and G. Zhang,
et.al.
, J. Phys.: Condens. Matter, 2008, 20, 215215 CrossRef
.
- Y. Zhu, D. Sun and Q. Huang,
et.al.
, Mater. Lett., 2008, 62, 407 CrossRef CAS
.
- W. Janosik, C. A. Randall and M. Lanagan, J. Am. Ceram. Soc., 2007, 90, 2415–2419 CrossRef CAS
.
- Y. Hu, O. K. Tan and J. S. Pan,
et al.
, Sens. Actuators, B, 2005, 108, 244 CrossRef CAS
.
- H. Irie, Y. Maruyama and K. Hashimoto, J. Phys. Chem. C, 2007, 111, 1847 CAS
.
- T. Yajima, H. Suzuki, T. Yogo and H. Iwahara, Solid State Ionics, 1992, 51, 101 CrossRef CAS
.
- X. Lu, G. Shi, J. Web and Z. Liu, Appl. Phys. A, 2003, 77, 481 CrossRef CAS
.
- M.-H. Lin, M.-C. Wu, C.-Y. Huang, C.-H. Lin and T.-Y. Tseng, J. Phys. D: Appl. Phys., 2010, 43, 295404 CrossRef
.
- T. Tsurumi, T. Harigai, D. Tanaka, S. Nam, H. Kakemoto, S. Wada and K. Saito, Appl. Phys. Lett., 2004, 85, 5016 CrossRef CAS
.
- H. Y. Hwang, Y. Iwasa, M. Kawasaki, B. Keimer, N. Nagaosa and Y. Tokura, Nat. Mater., 2012, 11, 103 CrossRef CAS PubMed
.
-
M. D. McCluskey and E. E. Haller, Dopants and Defects in Semiconductors, CRC, Boca Raton, FL, 2012 Search PubMed
.
- J. N. Eckstein, Nat. Mater., 2007, 6, 473 CrossRef CAS PubMed
.
- B. Bouma and G. Blasse, J. Phys. Chem. Solids, 1995, 56, 261 CrossRef CAS
.
- P. S. Pizani, H. C. Basso, F. Lanciotti, T. M. Baschi, F. M. Pontes, E. Longo and E. R. Leite, Appl. Phys. Lett., 2002, 81, 253 CrossRef CAS
.
- V. M. Longo, L. S. Cavalcante, R. Erlo, V. R. Mastelaro, A. T. De Figueiredo, J. R. Sambrano, S. de Lazaro, A. Z. Freitas, L. Gomes, N. D. Vieira Jr, J. A. Varela and E. Longo, Acta Mater., 2008, 56, 2191 CrossRef CAS
.
- E. Longo,
et al.
, Phys. Rev. B: Condens. Matter Mater. Phys., 2004, 69, 1251151 Search PubMed
.
- V. M. Longo, L. S. Cavalcante, A. T. De Figueiredo, L. P. S. Santos, E. Longo, J. A. Varela, J. R. Sambrano and A. C. Hernandes, Appl. Phys. Lett., 2007, 90, 091906 CrossRef
.
- T. Ye, Z. Dong, Y. Zhao, J. Yu, F. Wang, S. Guo and Y. Zuo, CrystEngComm, 2011, 13, 3842 RSC
.
- S. K. Gupta, P. S. Ghosh, N. Pathak, A. Arya and V. Natarajan, RSC Adv., 2014, 4, 29202 RSC
.
- D. J. Lee, D. H. Kim, J. W. Park and Y. S. Lee, J. Korean Phys. Soc., 2011, 59, 2797 CrossRef CAS
.
- J. W. Park, D. J. Lee, D. H. Kim and Y. S. Lee, J. Korean Phys. Soc., 2011, 58, 316 CrossRef CAS
.
- H. Zhang, X. Fu, S. Niu and Q. Xin, J. Alloys Compd., 2008, 459, 103 CrossRef CAS
.
- S. K. Gupta, M. Mohapatra, V. Natarajan and S. V. Godbole, Int. J. Appl. Ceram. Technol., 2013, 10, 593 CrossRef CAS
.
- S. K. Gupta, M. Mohapatra, V. Natarajan and S. V. Godbole, J. Mater. Sci., 2012, 47, 3504 CrossRef CAS
.
- S. K. Gupta, R. M. Kadam, V. Natarajan and S. V. Godbole, J. Mater. Sci. Eng. B, 2014, 183, 6 CrossRef CAS
.
- J. Huang, L. Zhou, Z. Wang, Y. Lan, Z. Tong, F. Gong, J. Sun and L. Li, J. Alloys Compd., 2009, 487, L5 CrossRef CAS
.
- A. Zhang, M. Lü, G. Zhou, Y. Zhou, Z. Qiu and Q. Ma, J. Alloys Compd., 2009, 468, L17 CrossRef CAS
.
- B.-B. Wang and W.-D. Yang, Adv. Mater. Res., 2013, 679, 3 CrossRef CAS
.
- Y. Jin, Y. Hu, L. Chen, X. Wang, G. Ju and Z. Mou, J. Am. Ceram. Soc., 2013, 96, 3821 CrossRef CAS
.
- D. H. Kim, J. H. Kim, J. S. Chung and Y. Lee, J. Nanosci. Nanotechnol., 2013, 13, 7572 CrossRef CAS PubMed
.
- M. Valant, T. Kolodiazhni, I. Arcon, F. Aguesse and A. K. Axelssson, Adv. Funct. Mater., 2012, 22, 2114 CrossRef CAS
.
- I. Levin, V. Krayzman, J. C. Woicik, A. Tkach and P. M. Vilarinho, Appl. Phys. Lett., 2010, 96, 52904 CrossRef
.
- Z. Potucek, V. Trepakov, A. Deyneka, Z. Bryknar, P. Galinetto and F. Rossella, Ferroelectrics, 2008, 367, 102 CrossRef
.
- S. K. Gupta, R. M. Kadam, R. Gupta, M. Sahu and V. Natarajan, Mater. Chem. Phys., 2014, 145, 162 CrossRef CAS
.
- B. B. Wang, C. F. Chang, Y. R. Li, T. N. Chau and W. D. Yang, Appl. Mech. Mater., 2012, 234, 1 CrossRef CAS
.
- M. H. Cho and Y. S. Lee, J. Korean Phys. Soc., 2014, 64, 1855 Search PubMed
.
- H. Yang, K. Kan, J. Ouyang and Y. Li, J. Alloys Compd., 2009, 485, 351 CrossRef CAS
.
- C. B. Azzoni, M. C. Mozzati, A. Paleari, V. Massarotti, M. Bini and D. Capsoni, Solid State Commun., 2000, 114, 617 CrossRef CAS
.
- G. Kresse and J. Furthmueller, Phys. Rev. B: Condens. Matter Mater. Phys., 1996, 5, 11169 CrossRef
.
- G. Kresse and J. Furthmueller, Comput. Mater. Sci., 1996, 6, 15 CrossRef CAS
.
- J. P. Perdew, K. Burke and M. Ernzerhof, Phys. Rev. Lett., 1996, 77, 3685 CrossRef PubMed
.
- P. E. Blo chl, Phys. Rev. B: Condens. Matter Mater. Phys., 1994, 50, 17953 CrossRef
.
- H. J. Monkhorst and J. D. Pack, Phys. Rev. B: Condens. Matter Mater. Phys., 1979, 13, 5188 CrossRef
.
- P. E. Blöchel, O. Jepsen and O. K. Andesen, Phys. Rev. B: Condens. Matter Mater. Phys., 1994, 4, 16223 CrossRef
.
- S. L. Dudarev, G. A. Botton, S. Y. Savrasov, C. J. Humphreys and A. P. Sutton, Phys. Rev. B: Condens. Matter Mater. Phys., 1998, 57, 1505 CrossRef CAS
.
- F. Zhou, M. Cococcioni, C. A. Marianetti, D. Morgan and G. Ceder, Phys. Rev. B: Condens. Matter Mater. Phys., 2004, 70, 235121 CrossRef
.
- J. A. M. Van Roosmalen, P. Van Vlaanderen and E. H. P. Cordfunke, J. Solid State Chem., 1992, 101, 59 CrossRef CAS
.
- R. D. Shannon, Acta Crystallogr., 1976, 32, 751 CrossRef
.
- J. Huang, L. Zhou, Z. Wang, Y. Lan, Z. Tong, F. Gong, J. Sun and L. Li, J. Alloys Compd., 2009, 487, L5 CrossRef CAS
.
- W. J. Yang, L. Y. Luo, T. M. Chen and N. S. Wang, Chem. Mater., 2005, 17, 3883 CrossRef CAS
.
- A. E. Souza, G. T. A. Santos, B. C. Barra, W. D. Macedo Jr, S. R. Teixeira, C. M. Santos, A. M. O. R. Senos, L. Amaral and E. Longo, Cryst. Growth Des., 2012, 12, 5671 CAS
.
- L. F. Silva, W. Avansi, M. L. Moreira, A. Mesquita, L. J. Q. Maia, J. Andrés, E. Longo and V. R. Mastelaro, J. Nanomater., 2012, 2012, 890397 Search PubMed
.
- T. Murata, T. Tanoue, M. Iwasaki, K. Morinaga and T. Hase, J. Lumin., 2005, 114, 207 CrossRef CAS
.
- L. Bo, S. Chao-Shu, Q. Ze Ming and T. Ye, Chin. Phys. Lett., 2005, 22, 2677 CrossRef
.
- K. Dunphy and W. W. Duley, J. Phys. Chem. Solids, 1990, 51, 1077 CrossRef CAS
.
- A. Bergstein and W. B. White, J. Electrochem. Soc., 1971, 118, 1166 CrossRef CAS
.
- Z. Bryknar, Ferroelectrics, 2004, 298, 43 CrossRef CAS
.
- M. Yoshino, H. Yukawa and M. Morinaga, Mater. Trans., 2004, 45, 2056 CrossRef CAS
.
- M. M. Shang, D. L. Geng, Y. Zhang, G. G. Li, D. M. Yang, X. J. Kang and J. Lin, J. Mater. Chem., 2012, 22, 19094 RSC
.
- D. L. Geng, G. G. Li, M. M. Shang, D. M. Yang, Y. Zhang, Z. Y. Cheng and J. Lin, J. Mater. Chem., 2012, 22, 14262 RSC
.
- Y. Liu, X. Zhang, Z. Hao, X. Wangc and J. Zhang, Chem. Commun., 2011, 47, 10677 RSC
.
- N. Pathak, S. K. Gupta, K. Sanyal, M. Kumar, R. M. Kadama and V. Natarajana, Dalton Trans., 2014, 43, 9313 RSC
.
- U. Soni, A. Pal, S. Singh, M. Mittal, S. Yadav, R. Elangovan and S. Sapra, ACS Nano, 2014, 8, 113 CrossRef CAS PubMed
.
- K. Vanheusden, W. L. Warren, C. H. Seager, D. R. Tallant, J. A. Voigt and B. E. Gnade, J. Appl. Phys., 1996, 79, 7983 CrossRef CAS
.
- P. H. Kasai, Phys. Rev., 1963, 130, 989 CrossRef CAS
.
- M. Z. Z. Jin, J. Zhang, X. Guo, J. Yang, W. Li, X. Wang and Z. Zhang, J. Mol. Catal. A: Chem., 2004, 217, 203 CrossRef
.
- S. Livraghi, M. Chiesa, M. C. Paganini and E. Giamello, J. Phys. Chem. C, 2011, 115, 25413 CAS
.
- J. Matta, J.-F. Lamonier, E. Abi-Aad, E. A. Zhilinskaya and A. Aboukaïs, Phys. Chem. Chem. Phys., 1999, 1, 4975 RSC
.
- C. Lin, C. Zhang and J. Lin, J. Phys. Chem. C, 2007, 111, 3300 CAS
.
- L. S. Cavalcante, V. M. Longo, M. Zampieri, J. W. M. Espinosa, P. S. Pizani, J. R. Sambrano, J. A. Varela, E. Longo, M. L. Simoes and C. A. Paskocimas, J. Appl. Phys., 2008, 103, 63527 CrossRef
.
- A. Kar, S. Kundu and A. Patra, J. Phys. Chem. C, 2011, 115, 118 CAS
.
- D. Capsoni, M. Bini, V. Massarotti, P. Mustarelli, G. Chiodelli, C. B. Azzoni, M. C. Mozzati, L. Linati and S. Ferrari, Chem. Mater., 2008, 20, 4291 CrossRef CAS
.
- F. C. Romeiro, J. Z. Marinho, A. C. A. Silva, N. F. Cano, N. O. Dantas and R. C. Lima, J. Phys. Chem. C, 2013, 117, 26222 CAS
.
- R. Viswanatha, S. Sapra, S. Sen Gupta, B. Satpati, P. V. Satyam, B. N. Dev and D. D. Sarma, J. Phys. Chem. B, 2004, 108, 6303 CrossRef CAS PubMed
.
- Z. Wang, W. Zheng, J. Tol, N. S. Dalal and G. F. Strouse, Chem. Phys. Lett., 2012, 524, 73 CrossRef CAS
.
| This journal is © The Royal Society of Chemistry 2015 |

