 Open Access Article
Creative Commons Attribution 3.0 Unported Licence
Effects of added thiol ligand structure on aggregation of non-aqueous ZnO dispersions and morphology of spin-coated films†
Aloïs
Mispelon
a,
Junfeng
Yan
a,
Amir H.
Milani
a,
Mu
Chen
a,
Wenkai
Wang
a,
Paul
O'Brien
ab and
Brian R.
Saunders
*a
aPolymer Science and Technology Group, School of Materials, The University of Manchester, Grosvenor Street, Manchester, M9 13PL, UK. E-mail: brian.saunders@manchester.ac.uk
bSchool of Chemistry, The University of Manchester, Oxford Road, Manchester, M9 13PL, UK
First published on 3rd February 2015
Abstract
The ability to control the morphology of spin-coated semiconducting nanocrystal films using solution based methods is potentially important for optoelectronic device applications. In this study we sought to establish relationships between added bifunctional thiol ligand structure, triggered nanocrystal aggregation and spin-coated nanocrystal film morphology using ZnO nanocrystals. The latter nanocrystals were studied because they do not rely on adsorbed long-chain ligands for dispersion stability, which simplifies the analysis, and have potential application in solar cells. The dithiol ligands used in this study were 1,2-ethanedithiol, 1,2-benzenedithiol and 1,4-benzenedithiol. Dispersion stability was assessed visually and using turbidity measurements. A colloid stability phase diagram for ZnO/1,2-ethanedithiol dispersions in chlorobenzene was constructed and the ability of 1,2-ethanedithiol and 1,2-benzenedithiol to trigger dispersion aggregation was compared. The morphology of spin-coated nanocrystal films was investigated using optical microscopy, SEM and TEM. The data show that added 1,2-benzenedithiol was far more effective at triggering aggregation than 1,2-ethanedithiol and this effect was attributed to stronger inter-nanocrystal linkages. Moreover, spin-coated ZnO/1,2-benzenedithiol films strongly scattered light in the visible region which was attributed to the formation of polydisperse sub-micrometre aggregates. A mechanism for ligand triggered aggregation of dispersed ZnO nanocrystals was proposed. We propose design rules for bifunctional thiol ligand selection for controlling triggered aggregation and achieving enhanced light scattering of ZnO nanocrystal films. The latter may enable simpler processing of efficient ZnO photoelectrodes for dye sensitised solar cells.
Introduction
The unique optical and electronic properties of inorganic semiconducting nanocrystals originate from their quantum size effect and offer potential for a range of optoelectronic applications.1–4 ZnO nanocrystals have attracted considerable attention in the context of photoelectrodes in dye-sensitised solar cells (DSSCs),5,6 catalysis, sensors sunscreens, coatings, optics and electronic materials.7 Many of the potential applications of nanocrystals rely on the ability to carefully control their spatial arrangement. Whilst most studies have focussed on adjusting the inter-nanocrystal separation in deposited films,8,9 very few studies have investigated the potential for adjusting the assembly process before nanocrystal deposition by addition of bifunctional ligands.10 The latter approach, which we term triggered aggregation, is potentially powerful and versatile if the aggregation process can be controlled. For example, deposited pre-aggregated ZnO nanocrystals of controlled size are known to increase the efficiency of DSSCs through enhanced light scattering.6 Currently, design rules for controlling aggregation of dispersed semiconducting nanocrystal dispersions are lacking. Furthermore, there are uncertainties in the mechanisms that are responsible for aggregation of nanocrystals by added bifunctional ligands. Dithiols, which are the focus of this study, have proven effective for decreasing the inter-nanocrystal distance of spin-coated nanocrystals.8,9 The central motivations of the present study were to (a) improve the understanding of the mechanisms governing triggered aggregation of dispersed nanocrystals by added bifunctional thiols and (b) establish relationships between bifunctional ligand structure and the ability of spin-coated ZnO nanocrystal films to scatter light. We hypothesised that if sufficiently strong inter-nanocrystal attractive interactions could be formed though rational ligand selection then it would be possible to spin coat films with light scattering abilities comparable to those reported using pre-aggregated ZnO nanocrystals and employed in DSSCs.11 We also sought to establish simple design rules for controlling the morphology of spin-coated nanocrystal films using thiol ligands as the toolbox.ZnO has a wurtzite crystal structure12 with Zn-terminated (0001) and O-terminated (000![[1 with combining macron]](https://www.rsc.org/images/entities/char_0031_0304.gif) ) surfaces. The surface of ZnO can accommodate adsorbed acetate groups from the synthesis.7 Unlike other nanocrystals, additional ligand stabilisers are not required when ZnO is dispersed in chlorobenzene or chloroform solutions containing methanol.13 This property makes ZnO an ideal model nanocrystal for studying aggregation by addition of destablising ligands because the requirement for exchange of pre-adsorbed long chain ligands is absent. ZnO nanocrystals have received much attention in the literature7,14,15 and have been used to prepare DSSCs,6 perovskite solar cells3 and hybrid polymer solar cells.16 Zhang et al. showed that films containing sub-micrometre aggregates resulted in increased light harvesting by the adsorbed dye and improved power conversion efficiencies for DSSCs.6 Moreover the surface area of the nanocrystals that comprised the aggregates remained fully accessible. Here, we tested our proposal that ZnO nanocrystal films containing sub-micrometre sized aggregates of ZnO nanocrystals could be prepared directly from dispersions of well defined ZnO nanocrystals without the need to synthesise pre-aggregated ZnO nanocrystals.6
) surfaces. The surface of ZnO can accommodate adsorbed acetate groups from the synthesis.7 Unlike other nanocrystals, additional ligand stabilisers are not required when ZnO is dispersed in chlorobenzene or chloroform solutions containing methanol.13 This property makes ZnO an ideal model nanocrystal for studying aggregation by addition of destablising ligands because the requirement for exchange of pre-adsorbed long chain ligands is absent. ZnO nanocrystals have received much attention in the literature7,14,15 and have been used to prepare DSSCs,6 perovskite solar cells3 and hybrid polymer solar cells.16 Zhang et al. showed that films containing sub-micrometre aggregates resulted in increased light harvesting by the adsorbed dye and improved power conversion efficiencies for DSSCs.6 Moreover the surface area of the nanocrystals that comprised the aggregates remained fully accessible. Here, we tested our proposal that ZnO nanocrystal films containing sub-micrometre sized aggregates of ZnO nanocrystals could be prepared directly from dispersions of well defined ZnO nanocrystals without the need to synthesise pre-aggregated ZnO nanocrystals.6
The interaction of thiols with nanocrystals has been actively studied because of its ability to alter the band gaps17 and increase the electrical overlap of neighbouring nanocrystals in spin-coated films.8,9 Sadik et al.18 established that thiol adsorption was dominant for the Zn surface of ZnO. Whilst a number of reports involving ZnO have discussed monofunctional ligand adsorption,12,18,19 there is a scarcity of data concerning the effects of added bifunctional ligands on the colloidal stability of ZnO nanocrystal dispersions. Furthermore, there has been disagreement concerning whether the increased electrical transport between neighbouring PbS nanocrystals for deposited PbS nanocrystal/dithiol films occurs because of dithiol bridging or simply decreased inter-nanocrystal distance.8,9 Whilst those studies have focussed on deposited nanocrystal films and used solid state ligand exchange (SSLE), the approach used here of seeking to control aggregation of dispersed nanocrystals using added dithiols is relatively unexplored.10
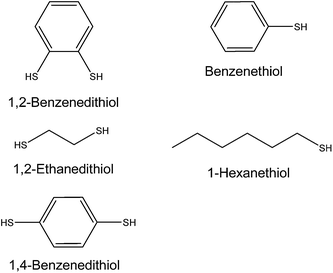
In our previous work we investigated the effects of added monofunctional ligands on ZnO nanocrystal dispersion stability.20 It was shown that the nature of the stabilising monofunctional amine ligand played a key role in the morphology of spin-coated hybrid polymer films. More recently, we investigated the effect of added 1,2-ethanedithiol on the dispersion stability of PbS nanocrystal dispersions and hybrid polymer/nanocrystal films. 1,2-Ethanedithiol caused triggered assembly of isotropic PbS aggregates which could be trapped within hybrid polymer/PbS films during spin coating.10 However, the PbS nanocrystals contained adsorbed long-chain ligands which complicated data interpretation. Furthermore, only one type of ligand was studied (1,2-ethanedithiol). Here, we employ ZnO nanocrystals as a model nanocrystal system and investigate the effects of ligand structure on triggered aggregation. The structures of the ligands used in this study are shown in Fig. 1.
In the present study we focus on 1,2-ethanedithiol and 1,2-benzenedithiol. These bifunctional ligands (and 1,4-benzenedithiol) can be removed from nanocrystal films by heating and have been popular choices for SSLE of deposited nanocrystals.17,21–23 The dithiols studied here have a range of sizes, defined here in terms of the S to S distance (LS–S), which are in the range of 3 to 6.5 Å (Table 1). Because a dissociative adsorption mechanism is often operative for thiol adsorption on nanocrystals9 deprotonation and thiolate binding are potentially important. Consequently, the pKa values of the ligands must be considered. Ligands with the lowest pKa values (Table 1) are expected to give the highest thiolate concentrations. In this study we address the roles of dithiol size and pKa for controlling triggered aggregation of ZnO nanocrystal dispersions.
| Ligand | L S–S a/Å | pKab | Ref. | β e |
|---|---|---|---|---|
| a Calculated distance between S atoms using known bond angles and bond lengths. b All values were calculated using DMSO as the solvent unless otherwise stated. c Calculated value using Fig. 10 of ref. 24 and the Hammett substituent constant of 0.15 for SH from ref. 27. d Experimentally determined value. e Values calculated for eqn (1) and (2). | ||||
| 1,2-Benzenedithiol | 3.0 | 6.8 | 24 | 3.4 |
| 1,2-Ethanedithiol | 4.0 | 16.8 | 24 | 5.1 |
| 1,4-Benzenedithiol | 6.5 | 9.4c | 25 | 3.4 |
| Benzenethiol | — | 10.3d | 26 | 4.4 |
| Hexanethiol | — | 16.7 | 24 | 4.1 |
In this study we first establish a stability phase diagram for ZnO/1,2-ethanedithiol dispersions and then compare the effects of added 1,2-ethanedithiol and 1,2-benzenedithiol on dispersion stability. By applying complementary microscopic and spectroscopic techniques we show that 1,2-benzenedithiol promotes stronger attractive inter-nanocrystal interactions compared to 1,2-ethanedithiol. The effects of these added ligands on the morphologies of the deposited films are also studied. A mechanistic explanation for the changes in colloidal stability for ZnO dispersions when dithiol ligands are present is proposed and tested qualitatively using the ligands shown in Fig. 1. We propose preliminary design rules that should enable selection of ligands for controlling morphology of deposited ZnO nanocrystal films prepared by triggered aggregation in the future. Furthermore, our data imply that addition of 1,2-benzenedithiol to ZnO nanocrystal dispersions may be a simple method for preparing photoelectrodes for DSSCs with enhanced light scattering.
Experimental
Materials
Zinc acetate dihydrate (≥98%), 1,2-ethanedithiol (>98%), 1,2-benzenedithiol (96%), 1,4-benzenedithiol (99%), benzenethiol (≥98%), hexanethiol (95%) were purchased from Aldrich and used as received. Chlorobenzene (99.8%) and methanol (99.8%) were also purchased from Aldrich and used as received.ZnO nanocrystal synthesis
ZnO nanocrystals were prepared following the method by Beek et al.13 A solution of zinc acetate dihydrate (2.95 g, 0.0135 mol) in methanol (125 mL) was heated at 60 °C. Meanwhile, a second solution of KOH (1.48 g, 0.026 mol) in 65 mL of methanol was prepared. The KOH solution was added dropwise to the flask over 10 min and the reaction temperature was maintained at 60 °C. The dispersion was then left to stir at 60 °C for 90 minutes after which time turbidity became apparent. Both heating and stirring ceased after 135 minutes and the dispersion was left to sediment overnight. The supernatant was removed and the nanocrystals were washed with methanol (2 × 50 mL). The nanocrystals were centrifuged and then redispersed in chloroform (10 mL).Dispersion preparation for UV-visible spectroscopy studies
For these studies dispersions containing ZnO nanocrystals (1 w/v%) in methanol (0.2 mL) were added to 10 mL of mixed chlorobenzene–methanol cosolvent (90 vol% of chlorobenzene). The latter cosolvent blend was used for all dispersions investigated in this study unless otherwise stated. The samples were sonicated for 10 minutes prior to ligand addition. [Caution: a fume cupboard should be used when working with thiols, which are noxious.] The test ligand was then added to give the proper concentrations and the mixture agitated. Unless otherwise stated the spectra were recorded after 5 min. For studies probing the rate of aggregation the UV-visible data were recorded within about 10 s from the point of the initial mixing of ligand and ZnO nanocrystals. The samples investigated using UV-visible spectroscopy contained a ZnO concentration (CZnO) of 0.016 w/v%. All concentrations used in this study are in terms of w/v%.Dispersion preparation for visual dispersion stability studies
All digital photographs were taken 5 min after the mixing of the ligand within the vial using CZnO = 0.016% unless otherwise specified. In the case of the gel study the concentrated dispersion was allowed to sit quiescently for 5 h prior to tube inversion.ZnO nanocrystal film preparation
The ZnO nanocrystal films were spin-coated using ZnO dispersions (0.16%) containing added ligand at the appropriate concentrations which are described below. The glass substrates (microscope slides) used for each film deposition were thoroughly cleaned using an acetone-soaked cleaning cloth and then sonicated in acetone for 15 min. They were then rinsed with deionised water and finally dried under a flow of nitrogen. The spin-coater (Laurell, Model WS-650Mz-23NPP) was programmed to first spin at 500 rpm for 15 s (phase 1), and then at 6000 rpm for another 15 s (phase 2). Approximately 0.1 mL of ZnO/ligand dispersion was added onto the spinning glass with a syringe during phase 1. At the end of phase 2, the process was repeated another 9 times to achieve a suitable film thickness for UV-visible spectroscopy studies. The thickness of deposited ZnO/1,2-ethanedithiol film was about 35 nm as determined by a Dektak profilometer.Nominal coverage of ZnO nanocrystals by added thiol ligands
In discussing adsorption of the ligands onto the ZnO nanocrystals we consider a calculated maximum nominal fractional surface coverage (θnom). The value for θnom of the ZnO nanocrystals was estimated by assuming (a) the nanocrystals were spherical, (b) adsorption could occur equally on all surfaces and (c) that adsorption involving only one of the thiol functional groups occurred. The following equations were derived using these assumptions.| θnom = βMR | (1) |
 | (2) |
The parameter MR is the mass ratio of added ligand to nanocrystals used, i.e., MR = CLig/CZnO where CLig is the concentration of ligand (w/v%). For eqn (2) the parameters ALig(m), ρZnO, DNC, NA and MLig are the cross-sectional area per ligand molecule adsorbed, density of ZnO, diameter of the nanocrystals, Avogadro's number and the molecular weight of the ligand, respectively. An ALig(m) value of 22 Å2 for thiol adsorption on the nanocrystals28 was used for this study. The value for ρZnO used was29 5.6 g cm−3 and a DNC value of 3.9 nm obtained from TEM was used (later). Values for β were calculated for the ligands and appear in Table 1. It is understood that ZnO nanocrystals are not spherical and that adsorption of thiols does not occur onto all surfaces equally.18 Furthermore, bidentate adsorption may occur for the dithiols. Nevertheless, the values for θnom calculated from eqn (1) provide a useful means for gauging the effectiveness of ligand-triggered aggregation as will be shown.
Physical measurements
UV-visible spectra were obtained using a Hitachi U-1800 spectrophotometer. The data were used both to estimate ZnO nanocrystal size and also to probe nanocrystal aggregation. The ability of dispersions to scatter light varies with the extent of aggregation and can be studied sensitively using turbidity (τ) – wavelength measurements. This method has been widely used for polymer dispersions30,31 and has more recently been applied successfully to study aggregation of hybrid polymer/ZnO nanocrystal films.20 Following Long et al.31 and Heller et al.32 the τ value for a dispersion varies as: | (3) |
![[thin space (1/6-em)]](https://www.rsc.org/images/entities/char_2009.gif) log
log![[thin space (1/6-em)]](https://www.rsc.org/images/entities/char_2009.gif) τ/d
τ/d![[thin space (1/6-em)]](https://www.rsc.org/images/entities/char_2009.gif) log
log![[thin space (1/6-em)]](https://www.rsc.org/images/entities/char_2009.gif) λ. The n-value is sensitive to aggregation and decreases abruptly when aggregates form.31 The value for τ is proportional to the numerical value of the absorbance (A) in regions of the UV-visible spectra where absorption of light does not occur (>350 nm in Fig. 2c, discussed below). Because the spectra discussed here show both the intrinsic absorbance of light by the ZnO nanocrystals (at λ ≤ 350 nm) and light scattering (λ > 350 nm) the numerical value for the absorbance has different meanings depending on λ. Strictly, the spectra should be considered in terms of optical density in the scattering region. However, to reduce complexity, and to maintain consistency with related studies which also use absorbance values to consider light scattering from nanocrystals,33 we use absorbance only in this study. Accordingly, the n-values were determined from −d
λ. The n-value is sensitive to aggregation and decreases abruptly when aggregates form.31 The value for τ is proportional to the numerical value of the absorbance (A) in regions of the UV-visible spectra where absorption of light does not occur (>350 nm in Fig. 2c, discussed below). Because the spectra discussed here show both the intrinsic absorbance of light by the ZnO nanocrystals (at λ ≤ 350 nm) and light scattering (λ > 350 nm) the numerical value for the absorbance has different meanings depending on λ. Strictly, the spectra should be considered in terms of optical density in the scattering region. However, to reduce complexity, and to maintain consistency with related studies which also use absorbance values to consider light scattering from nanocrystals,33 we use absorbance only in this study. Accordingly, the n-values were determined from −d![[thin space (1/6-em)]](https://www.rsc.org/images/entities/char_2009.gif) log
log![[thin space (1/6-em)]](https://www.rsc.org/images/entities/char_2009.gif) A/d
A/d![[thin space (1/6-em)]](https://www.rsc.org/images/entities/char_2009.gif) log
log![[thin space (1/6-em)]](https://www.rsc.org/images/entities/char_2009.gif) λ plots.
λ plots.
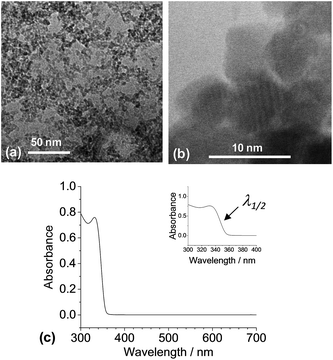 | ||
| Fig. 2 Characterisation of ZnO nanocrystals. TEM images are shown in (a) and (b). A UV-visible spectrum for the dispersion is shown in (c). The value for λ1/2 is explained in the text. | ||
TEM measurements were obtained using a Philips CM20 200 kV instrument. Dispersions were prepared and a holey carbon grid used to capture a droplet (after 5 min mixing) which was then allowed to dry at room temperature. SEM of spin-coated dispersions was performed using a Philips FEGSEM instrument. Optical microscopy was conducted with an Olympus BX41 microscope. Dynamic light scattering (DLS) measurements were carried out using a 50 mW He/Ne laser operated at 633 nm with a standard avalanche photodiode (APD) and 90° detection optics connected to a Malvern Zetasizer Nano ZS90 autocorrelator. These measurements were conducted using a CHCl3–methanol cosolvent blend following our earlier work.20
Results and discussion
ZnO nanocrystal characterisation
As reported earlier13 ZnO nanocrystals spontaneously dispersed in cosolvent blends of methanol and chlorobenzene (90 vol% chlorobenzene). This cosolvent blend was used throughout the study unless otherwise stated. TEM analysis (Fig. 2a) showed that the ZnO nanocrystals had a TEM number-average diameter (DTEM) of 3.9 nm (coefficient of variation = 18%). High resolution TEM (Fig. 2b) showed the crystalline nanocrystal nature with lattice fringes evident.ZnO nanocrystals show quantum size dependent band gaps for sizes less than about 7 nm.34 Meulenkamp35 established an empirical relationship between the λ1/2 (wavelength at which the absorbance is 50% of the peak value) and the nanocrystal size. Using an λ1/2 value of 347 nm (Fig. 2c) and Meulenkamp's expression (1240/λ1/2 = 3.301 + 294/Duv-vis2 + 1.09/Duv-vis) gave a particle diameter from the UV-visible spectroscopy data of 3.5 nm. The latter value agrees closely with DTEM (above). We used the DTEM value for this study.
Effect of added 1,2-ethanedithiol on ZnO nanocrystal dispersion stability
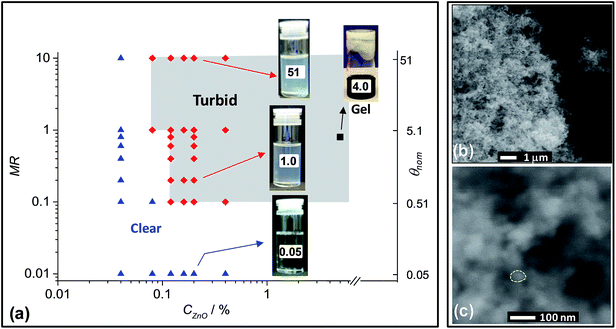
Addition of 1,2-ethanedithiol to dispersions containing CZnO values of greater than 0.12% caused a noticeable and rapid increase in turbidity if the MR value was greater than equal to 0.10 (depending on CZnO). A colloidal stability phase diagram was constructed from observation of a range of ZnO/1,2-ethanedithiol dispersions (Fig. 3a) (images of the dispersions used are shown in Fig. S1†). The onset of turbidity, and hence aggregation, was favoured by increasing MR (at fixed CZnO) or CZnO (at fixed MR). By contrast addition of 1-hexanethiol (a monofunctional ligand, Fig. 1) to ZnO dispersions (MR = 1) did not result in aggregation (see inset of Fig. S3a†). The inability of 1-hexanethiol to trigger ZnO nanocrystal aggregation strongly implicates the bifunctional nature of 1,2-ethanedithiol in the triggered aggregation that occurred for ZnO/1,2-ethanedithiol dispersions. The ability of added bifunctional thiols to trigger aggregation of ZnO nanocrystal dispersions has not been reported previously to our knowledge.Particulate gels can occur for destabilised dispersions provided36 the particle–particle bonds are sufficiently strong to prevent rearrangement and aggregate densification and the particle concentration is sufficiently high. Accordingly, gel formation was tested using a concentrated ZnO/1,2-ethanedithiol sample with CZnO = 5% and MR = 0.8. The particulate ZnO nanocrystal gel which formed (Fig. 3a) had a ZnO volume fraction of ∼1 vol%. This result shows that a high porosity, space-filling interconnected nanocrystal network formed. The latter conclusion is supported by SEM images (Fig. 3b and c) where it can be seen that the ZnO nanocrystals adopted a space-filling network structure. The primary aggregates that formed the struts of the network had a size of ∼30–50 nm and were relatively large compared to the ZnO nanocrystal size of 3.9 nm (Fig. 2a).
UV-visible spectroscopy was also used to study triggered aggregation of ZnO nanocrystals dispersions. Kinetic studies showed that triggered aggregation of ZnO dispersions occurred immediately after addition of 1,2-ethanedithiol (Fig. S2†). The data showed that the initial absorbance increased by more than a factor of three only 1 s after mixing and confirm that adsorption of 1,2-ethanedithiol to the surface of the ZnO nanocrystals occurred rapidly. Thiols are known to adsorb as thiolate on PbSe9 and ZnO12 and we assume a similar mechanism operates for 1,2-ethanedithiol for ZnO nanocrystals.
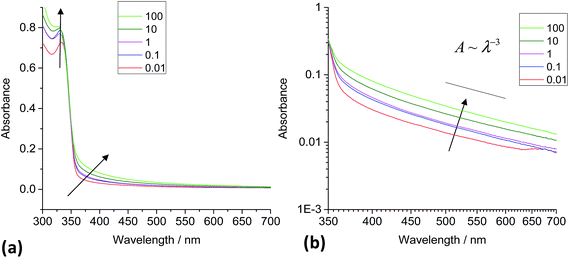
A series of UV-visible spectra also revealed that increases in absorbance occurred across the whole wavelength range when 1,2-ethanedithiol was added to ZnO dispersions and this increased with concentration (Fig. 4a). By contrast addition of 1-hexanethiol to ZnO dispersions did not significantly affect the turbidity (a digital photograph of a ZnO/1-hexanethiol dispersion is shown in Fig. S3a†). The absorbance values were not strongly affected by addition of 1-hexanethiol for MR values of 0.01 to 100 (Fig. S3†). The minor increase in the absorbance apparent for those data in the vicinity of 350 to 400 nm is not considered significant.
The absorbance increase for the wavelength region greater than 350 nm for ZnO/1,2-ethanedithiol (Fig. 4a) is governed by scattering caused by ZnO nanocrystal aggregation. The importance of scattering was tested by constructing log![[thin space (1/6-em)]](https://www.rsc.org/images/entities/char_2009.gif) A vs. log
A vs. log![[thin space (1/6-em)]](https://www.rsc.org/images/entities/char_2009.gif) λ plots for ZnO/1,2-ethanedithiol (Fig. 4b) and ZnO/1-hexanethiol (Fig. S3b†) dispersions. In the case of the 1,2-ethanedithiol dispersions significant scattering was observed with a n-value of about 3.0. This result supports the view that 1,2-ethanedithiol triggered ZnO aggregation at low MR values. The extent of scattering for the ZnO/1,2-ethanedithiol dispersions increased with MR (and hence θnom). The turbidity of the dispersions increased with MR (Fig. S1†). The increase of MR was caused by an increase in the volume fraction of aggregates present and/or their average size.
λ plots for ZnO/1,2-ethanedithiol (Fig. 4b) and ZnO/1-hexanethiol (Fig. S3b†) dispersions. In the case of the 1,2-ethanedithiol dispersions significant scattering was observed with a n-value of about 3.0. This result supports the view that 1,2-ethanedithiol triggered ZnO aggregation at low MR values. The extent of scattering for the ZnO/1,2-ethanedithiol dispersions increased with MR (and hence θnom). The turbidity of the dispersions increased with MR (Fig. S1†). The increase of MR was caused by an increase in the volume fraction of aggregates present and/or their average size.
Comparison of triggered aggregation of ZnO dispersions using 1,2-ethanedithiol and 1,2-benzenedithiol
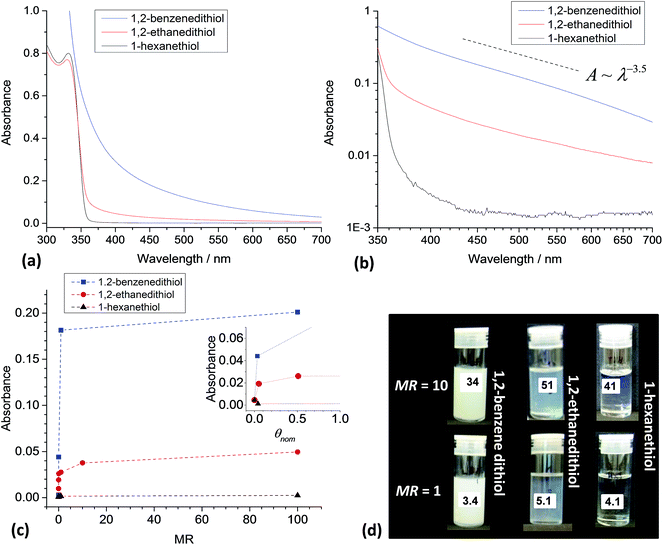
The importance of bifunctional ligand structure on triggered aggregation was probed by comparing the effects of added 1,2-ethanedithiol and 1,2-benezenedithiol on dispersion stability. We selected 1,2-benzenedithiol for comparison because it has a smaller size than 1,2-ethanedithiol (Table 1). It also has a lower pKa (Table 1) and consequently differences in aggregation tendencies were likely if either factor contributed to aggregation.UV-vis spectra are shown in Fig. 5a for ZnO dispersions in the presence of added 1,2-benzenedithiol, 1,2-ethanedithiol and 1-hexanethiol at MR = 1. The strong increase in the absorbance at wavelengths greater than 350 nm, extending throughout the visible range, is immediately apparent for added 1,2-benzenedithiol. The latter ligand does absorb light at λ values of less than 450 nm (Fig. S4†). For ZnO containing MR = 1, the concentration of 1,2-benzenedithiol was about 1 mM. Using the measured spectrum for 1,2-benzenedithiol (from Fig. S4†) a maximum absorbance at 380 nm due to 1,2-benzenedithiol of 0.03 can be estimated for the ZnO/1,2-benzenedithiol dispersion (MR = 1) shown in Fig. 5a. Consequently, the overwhelming majority of the absorbance values for the ZnO/1,2-benzenedithiol spectra at wavelengths of greater than ca. 380 nm originated from the ZnO nanocrystals. Therefore, the strongly increased absorbance values in the visible region for ZnO/1,2-benzenedithiol was due to enhanced light scattering by ZnO aggregates.
Fig. 5b shows log–log plots for A vs. λ. Linearity is evident for the dispersion containing 1,2-benzenedithiol with a n value magnitude of 3.5 and is comparable to that for the 1,2-ethanedithiol dispersion (3.0, from Fig. 4d). The most important difference for these spectra is that the absorbance values for ZnO/1,2-benzenedithiol increased by about an order of magnitude. The intensity of light scattering greatly increased which implies a much higher volume fraction of scattering particle and/or their size was induced by 1,2-benzenedithiol compared to 1,2-ethanedithiol. These data imply that 1,2-benzenedithiol is more efficient at triggering ZnO aggregation compared to 1,2-ethanedithiol.
Fig. 5c shows the variation of the absorbance measured at 450 nm with MR measured after 5 min of mixing. The use of absorbance data at 450 nm ensures negligible contribution from 1,2-benzenedithiol at all MR values. The absorbance values for the ZnO dispersions containing 1,2-benzenedithiol were much higher than those containing 1,2-ethanedithiol or 1-hexanethiol at the same MR. A strong increase of absorbance for the ZnO/1,2-benzenedithiol dispersion occurred at MR = 0.01 which suggests more pronounced adsorption of this ligand onto the nanocrystals. By contrast addition of 1-hexanethiol did not affect the absorbance. Whilst it is highly likely that 1-hexanethiol adsorption did occur (as reported for related monofunctional thiols for ZnO elsewhere18) this did not detract from dispersion stability because adsorption of 1-hexanethiol could not trigger bridging due to its monofunctional nature. We propose that 1-hexanethiol acted as a stabiliser for ZnO via the hexyl groups.
From eqn (1) and (2) an MR value of 0.01 corresponds to θnom values of 0.05 and 0.03, respectively for 1,2-ethanedithiol and 1,2-benzenedithiol (the absorbance data are plotted as a function of θnom in the inset of Fig. 5c). It is remarkable that such a small coverage by 1,2-ethanedithiol or 1,2-benzenedithiol is sufficient to trigger aggregation of the ZnO nanocrystals. This result implies that relatively few 1,2-ethanedithiol (or 1,2-benzenedithiol) molecules are required to trigger ZnO nanocrystal aggregation. It can be shown that a θnom value of 0.05 corresponds to an average of 11 1,2-ethanedithiol molecules per ZnO nanocrystal. Images for dispersions at higher θnom values (Fig. 5d) are generally in agreement with the order of the absorbance values shown in Fig. 5c. The data shown in Fig. 5 enable an order of the tendency of the added thiol ligands to trigger aggregation for ZnO nanocrystal dispersions to be proposed; the aggregation tendency decreases in the order 1,2-benzenedithiol > 1,2-ethanedithiol ≫ 1-hexanethiol.
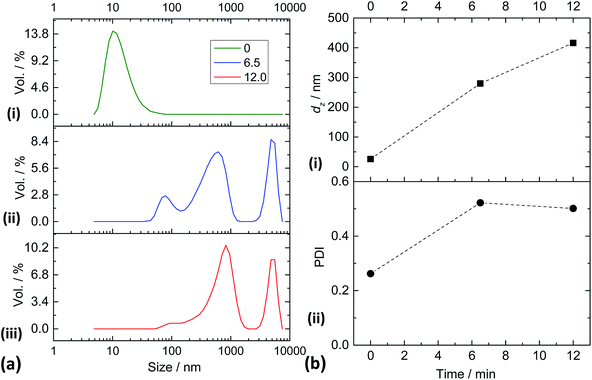
To further probe ligand triggered aggregation a DLS study was conducted. DLS, which measures z-average diameters (dz), is very sensitive to aggregates. Although the ZnO dispersions used for the dispersion stability studies (Fig. 4 and 5) had low turbidities in the absence of added ligand, they were not well suited to DLS studies due to the presence of aggregates. Earlier work showed that ZnO nanocrystals dispersed in CHCl3–methanol cosolvent blends gave hydrodynamic diameters that were comparable to the DTEM value.20 Accordingly, a CHCl3–methanol cosolvent blend (82 vol% CHCl3) was used here for the DLS study. Data for the ZnO dispersion are shown in Fig. 6a(i). The DLS data show a peak size of 10.1 nm which is indicative of good nanocrystal dispersion. This conclusion is supported by the observation that the dispersions had high transparency. Because of the latter a high CZnO value (1.3%) was required to obtain sufficient scattering for reliable DLS measurements. Exact agreement between the dz value (26 nm) and the DTEM (3.9 nm) was not expected because dz values are dominated by the largest particles or aggregates. The data (Fig. 6a(i)) indicate that some small aggregates were present in the absence of added ligand. Nevertheless, these dispersions had a high proportion of dispersed nanocrystals and were well suited for a DLS study of triggered aggregation.
DLS data were obtained 6.5 and 12 min after addition of 1,2-ethanedithiol to study triggered aggregation (see Fig. 6a(ii) and (iii)). Clearly, pronounced and rapid aggregation occurred for the dispersions after addition of the ligand. The species responsible for the peak size of 10 nm (Fig. 6a(i)) completely disappeared after 6.5 min in the presence of the ligand. We can therefore conclude that the yield of aggregates produced upon addition of 1,2-ethanedithiol after a mixing time of 6.5 min was 100% using the conditions reported here. It can be seen from Fig. 6b that the values for dz and polydispersity index (PDI) increased considerably as a result of triggered aggregation.
DLS experiments were also conducted for the ZnO/1,2-benzenedithiol dispersion using the same conditions as those used for Fig. 6. A viscous, turbid, paste formed immediately for the ZnO/1,2-benzenedithiol mixture. For this system excessive dispersion aggregation occurred and accurate dz values could not be measured. In summary, these experiments show that rapid and highly efficient triggered aggregation occurred when 1,2-ethanedithiol and 1,2-benzenedithiol were added to dispersed ZnO nanocrystals and support the dispersion stability studies discussed above.
Effects of added ligands on the morphology and light scattering of spin-coated ZnO films
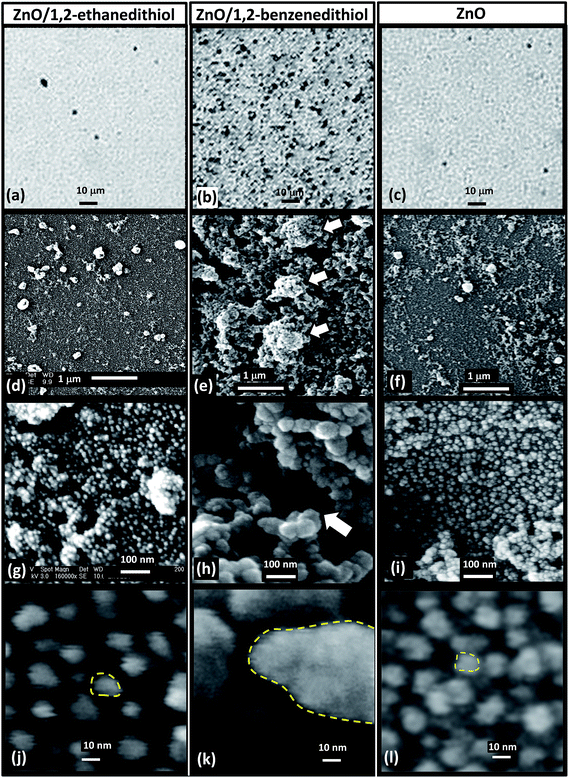
An aim of this study was to determine whether the in situ triggered aggregation could be used to enhance light scattering of spin cast ZnO nanocrystal films. This approach would, in principle, provide a simpler alternative approach to preparing improved ZnO photoelectrodes for DSSCs compared to that developed earlier involving synthesis of pre-aggregated ZnO nanocrystals.6,11 The starting point for our approach is well defined ZnO nanocrystals (Fig. 2). We show below that for spin-coated films prepared by triggered aggregation two populations of ZnO aggregates were present: nanometre-scale primary aggregates and larger sub-micrometre scale secondary aggregates.Optical micrographs of the spin-coated films showed large differences between the spin-coated ZnO/1,2-ethanedithiol and ZnO/1,2-benzenedithiol films (Fig. 7a and b) with many large secondary aggregates evident for the latter. However, there was little discernible difference between ZnO/1,2-ethanedithiol (Fig. 7a) and ligand-free ZnO (Fig. 7c) films. Low magnification SEM images (Fig. 7d–f) showed that some aggregation occurred for all films during spin-coating. However, the aggregates were distinctly larger and more prevalent for the ZnO/1,2-benzenedithiol films. We term these sub-micrometre sized species as secondary aggregates. They can also be seen in Fig. S5,† which shows a larger area of film. The deposited ZnO/1,2-benzenedithiol film contained polydisperse secondary aggregates with range of sizes in the region of ∼200 to 700 nm.
Higher magnification SEM images (Fig. 7g–l) also showed small primary aggregates. There appeared to be a difference in the size of the primary aggregates with those for the ZnO/1,2-benzenedithiol film being larger than those for ZnO/1,2-ethanedithiol. The primary aggregates were also probed using TEM (Fig. 8) and a difference in sizes could also be seen. The primary aggregates for deposited ZnO/1,2-benzenedithiol (Fig. 8b) were ∼40 nm; whereas, the primary aggregates for deposited ZnO/1,2-ethanedithiol (Fig. 8a) were ∼10 nm. Higher resolution TEM images were obtained of the ZnO primary aggregates for ZnO/1,2-benzendithiol (Fig. S6†) and individual ZnO nanocrystals could be seen. These data confirm that the primary aggregates comprise ZnO nanocrystals. Aggregated nanocrystals are considered a more attractive means for scattering light in DSSC photoelectrodes compared to addition of large homogeneous particles because the high surface area remains available for the former.6 An accessible, high, photoelectrode surface area maximises DSSC power conversion efficiency.
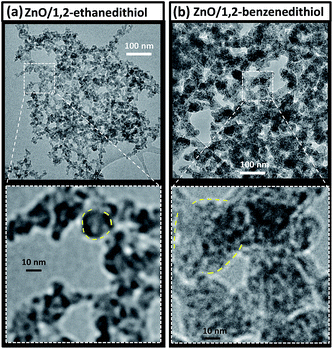 | ||
| Fig. 8 TEM images for ZnO/ligand mixtures. (a) shows images for ZnO/1,2-ethanedithiol. (b) shows images for ZnO/1,2-benzenedithiol. Selected primary aggregates are indicated with outlines. The conditions were the same as those used for Fig. 7. | ||
The differences noted above in the sizes of the primary aggregates were reflected by the apparent porosities evident from these images. The ZnO/1,2-benzenedithiol films had the greatest porosity as judged by SEM (Fig. 7e and h). The primary aggregate size and porosity of colloidal networks generally increase with aggregation rate37 with fast aggregation generally giving more porous networks.38,39 It can be proposed that the triggered aggregation for the ZnO/1,2-benzenedithiol dispersion was closer to diffusion limited compared to that for ZnO/1,2-ethanedithiol. It follows that the energy barriers that opposed aggregation of the ZnO nanocrystals were lowest in the presence of added 1,2-benzenedithiol.
The UV-vis spectroscopy data for the spin-coated films (Fig. 9) showed that pronounced light scattering was present for the ZnO/1,2-benzenedithiol nanocrystal films. The extent of light scattering was enhanced throughout the visible range. The scattering of visible light is maximised when particles (or aggregates) have a size that is comparable to the wavelength. The enhanced light scattering observed for the ZnO/1,2-benzenedithiol film is attributed to the presence of the polydisperse sub-micrometre sized secondary aggregates (∼200 to 700 nm) identified above (Fig. 7e and S5†).
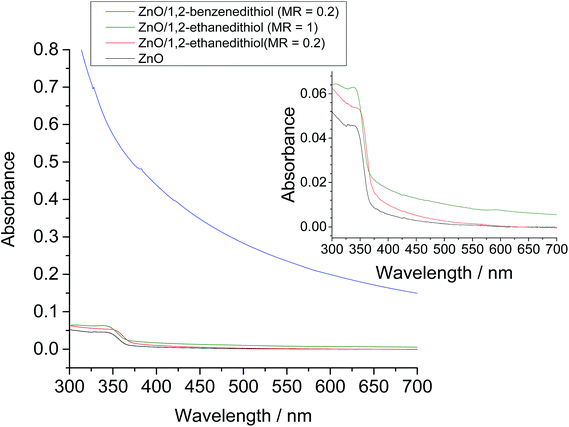 | ||
| Fig. 9 Effect of added ligands on the UV-visible spectra for spin-coated ZnO nanocrystal films. The MR values are given in the legend. For all films CZnO = 0.16%. | ||
Because the UV-visible spectrum for the spin-coated ZnO/1,2-ethanedithiol film (MR = 0.2) was similar to that for the ligand-free deposited ZnO (Fig. 9) there was less evidence of differences between the light scattering of these films. This observation matched the morphological similarities noted above for the ZnO/1,2-ethanedithiol and ZnO films in Fig. 7. It follows that 1,2-ethanedithiol (MR = 0.2) was less effective at causing large-scale morphology changes for spin cast ZnO/1,2-ethanedithiol. The attractive inter-nanocrystal interactions present for ZnO/1,2-ethanedithiol system were probably weak compared to the shear and capillary forces that were operative during the spin-coating process.40 However, pronounced light scattering extending further into the visible region could be achieved for the ZnO/1,2-ethanedithiol films by increasing the MR to 1.0 as can be seen from the increased absorbance values in the visible region of the UV-visible spectrum for the ZnO/1,2-ethanedithiol (MR = 1.0) film in Fig. 9. This result shows that the extent of light scattering within these deposited ZnO nanocrystal films is tuneable via bifunctional ligand concentration. This result is potentially important for future DSSC work where light scattering tuning is important.6
Proposed mechanism for bifunctional ligand triggered aggregation of ZnO dispersions
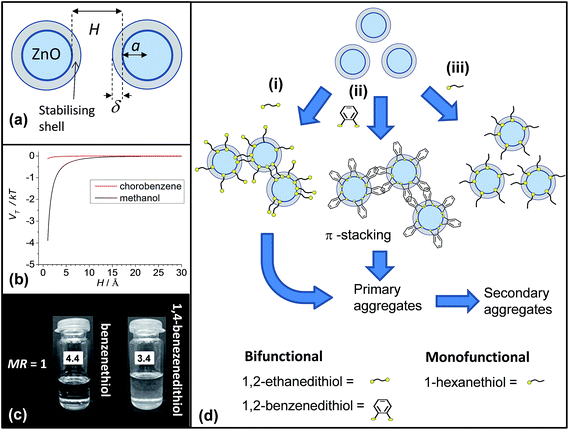
What is the mechanism for triggered aggregation by added ligands? An important experimental observation noted above is that ZnO nanocrystal dispersions in methanol are turbid. However, addition of chlorobenzene caused spontaneous redispersion of the ZnO nanocrystals as evidenced by a major decrease of turbidity. In the following we propose an explanation for this observation and extend it to propose a mechanism for triggered aggregation of ZnO nanocrystal dispersions by added bifunctional ligands.The total two-particle interaction energy (VT) for nanocrystals containing an adsorbed ligand layer dispersed in a solvent can be considered in terms of DLVO theory combined with a sterically stabilising ligand layer.41Fig. 10a depicts the geometry for the ZnO nanocrystals dispersions. The nanocrystals are approximated as spheres of radius, a, with an adsorbed ligand (acetate) layer with a thickness of δ.
The following equation applies for nanocrystals in the absence of dipole–dipole interactions:42
| VT = Vvdw + Velec + Vsteric | (4) |
 | (5) |
| Aeff = (AZnO1/2 − Asolv1/2)2 | (6) |
The parameters Aeff, AZnO and Asolv are the effective Hamaker constant, Hamaker constant of ZnO and Hamaker constant of the solvent, respectively.43
The term Vsteric originates from the energy required to compress or displace the ligand film and is assumed to be a step-function and is zero when H > 2δ and approaches infinity when H ≤ 2δ. ZnO nanocrystals contain residual acetate ligands.7,20 Rhodes et al., estimated that about 30% of the available surface contained acetate groups.20 Consequently, steric stabilisation afforded by these small and sparsely distributed surface acetate groups should be rather limited.
The values for AZnO, AMeOH and ACBZ are 92 zJ,44,45 39 zJ,46 80 zJ.47 These data give Aeff values for ZnO dispersed in methanol and chlorobenzene of 2.7 kT and 0.11 kT, respectively. Fig. 10b shows the variation of VT/kT calculated using these Aeff values. When H decreases to below 10 Å (the maximum estimated value of 2δ for touching acetate-covered nanocrystals) the magnitude of VT/kT increases for ZnO nanocrystals in methanol. The actual value for 2δ may approach zero as the acetate coverage of the nanocrystals is low (above) which means that the relatively large spaces between the sparsely distributed acetate groups would favour inter-nanocrystal contact according to Fig. 10b because H would approach zero. When the aggregates are added to chlorobenzene the magnitude of VT/kT should decrease dramatically (≪1, Fig. 10b) and favour redispersion as a consequence of the greatly diminished Aeff (above). This major decrease of VT would help explain why ZnO nanocrystals spontaneously redisperse in chlorobenzene cosolvent blends.
Turning now to the case of added ligands we can also use Fig. 10b. We first consider possible ligand exchange of acetate as a consequence of thiol adsorption. The adsorption of the thiol ligands onto ZnO is fast (as evidenced by Fig. S2†). The adsorbed ligands should not be shielded by residual acetate, which is smaller than 1,2-ethanedithiol or 1,2-benzenedithiol. It is difficult to find stability constant data for the ligands used in this study (Fig. 1). However, a model may be found by comparing the affinity of aspartic acid and cysteine for Zn. The first stepwise binding constants for these ligands are close to 106 and 109, respectively.48 These numbers are macroscopic and will reflect the affinity of the thiolate of cysteine (partially deprotonated) for the metal and the β-carboxylate of aspartic acid (fully deprotonated). Even so this difference amounts to a factor of 103 in favour of S-binding or a free energy difference of ∼17 kJ mol−1 at room temperature. These numbers suggest that on a labile metal such as Zn the displacement of a weak carboxylate ligand (e.g., acetate) by added thiol under ambient conditions should be favourable and potentially rapid.
When the nanocrystals dispersed in chlorobenzene collide the bifunctional thiols lock the nanocrystals together. This process is a bridging aggregation mechanism. The calculated VT values in Fig. 10b are too small in the presence of chlorobenzene for a Vvdw dominated aggregation mechanism to apply. An alternative explanation for dithiol-triggered ZnO aggregation is that adsorption of the thiol ligand caused displacement of a sterically stabilising ligand layer and that aggregation occurred due to a dominance of VT due to a stronger Vvdw contribution than expected from the calculations above. If that were the case then addition of benzenethiol (monofunctional aromatic thiol, Fig. 1), which is smaller than 1,2-benzenedithiol or 1,2-ethanedithiol), should cause aggregation. This proposal was tested (Fig. 10c) and aggregation was not observed. This test strongly supports our proposed bifunctional bridging mechanism. Furthermore, the ability of these bifunctional thiol ligands to bridge dispersed nanocrystals adds weight to the view that such bridging can also occur when added to spin-coated nanocrystal films prepared by SSLE as proposed by Klem et al.8
Fig. 10d(i) depicts the bridging of neighbouring ZnO nanocrystals by bifunctional (bilinker) ligands and is proposed to apply for both 1,2-ethanedithiol and 1,4-benzenedithiol.49,50 1,2-Benzenedithiol is well known to prefer bidentate binding, i.e., with both thiolate groups binding to the same site.9,50 Furthermore, adsorbed 1,2-benzendithiol can form aggregates on surfaces,51 which implies favourable intermolecular attractions can occur. Here, we assume that 1,2-benzendithiol adsorbs to the nanocrystals in a bidentate manner. To explain the strong aggregation observed for dispersed ZnO nanocrystals when 1,2-benzenedithiol was added we tentatively propose that bridging of neighbouring ZnO nanocrystals occurred via aryl–aryl non-covalent interactions (Fig. 10d(ii)). This general type of π-stacking has been reported for related systems.52 Presumably, for adsorbed 1-hexanethiol (Fig. 10d(iii)), or benzenethiol, the combination of lack of conjugation (for 1-hexanethiol), lower surface ligand concentration, or greater flexibility of orientation (for benzenethiol) prevented bridging and, hence, aggregation after adsorption. The bridging mechanisms that operate for these systems will be studied further in future work.
The mechanism above does explain the observations of aggregation in the presence of bifunctional thiol ligands. However, it does not explain the observation of stronger aggregation for ZnO nanocrystal dispersions in the presence of added 1,2-benzenedithiol compared with 1,2-ethanedithiol. There are two alternative explanations possible. The first is that aggregation is greater for 1,2-benzenedithiol due to the lower pKa of that ligand compared to 1,2-ethanedithiol (Table 1). A lower pKa can be expected to provide a greater concentration of thiolate groups for adsorption. The second possible explanation is that the extent of aggregation increases with decreasing bifunctional ligand size due to a higher surface concentration of adsorbed bifunctional ligands that can subsequently bridge neighbouring nanocrystals upon inter-nanocrystal collision.
We tested aggregation using 1,4-benzenedithiol (pKa = 9.4), which is a significantly larger ligand compared to 1,2-benzenedithiol (Table 1). A moderate turbidity was observed when 1,4-benzenedithiol was mixed with ZnO (Fig. 10c) at the same MR (of 1.0) that was used for 1,2-benzenedithiol and 1,2-ethanedithiol earlier (Fig. 5d). It follows that 1,4-benzenedithiol was less efficient at triggering aggregation than 1,2-benzenedithiol. This result is expected on the basis of both the increased size and relatively high pKa of 1,4-benzenedithiol (Table 1). Both factors would decrease the number of inter-nanocrystal linkages per unit area for bridging aggregation.
Conclusions
In this study the triggered aggregation of ZnO nanocrystals caused by bifunctional thiol ligands was studied. Space-filling aggregates formed upon addition of 1,2-ethanedithiol with a gel observed at a nanocrystal volume fraction of only 1 vol%. For added 1,2-ethanedithiol and 1,2-benzenedithiol triggered ZnO aggregation occurred at very low ligand concentrations and could be detected by UV-visible spectroscopy measurements when θnom was 0.05 and 0.03, respectively. The mechanism for bridging aggregation was explained in terms of DLVO theory. The efficiency of triggered aggregation was greatest for 1,2-benzenedithiol, which was attributed to this ligands smaller size and lower pKa. Both of these factors promote more inter-nanocrystal linkages per unit surface area in the aggregated state. The 1,2-benzenedithiol ligand promoted formation of secondary aggregates which scattered light strongly in the visible region for spin-coated ZnO films. All of the data point to a stronger inter-nanocrystal attraction when 1,2-benzenedithiol was used. Considering the ligands in Fig. 1 as a toolbox for triggered aggregation, we can suggest an ordering of ligand effectiveness for triggered ZnO dispersion aggregation and enhanced light scattering of deposited films. The effectiveness decreases in the order 1,2-benzenedithiol > 1,2-ethanedithiol ≃ 1,4-benzenedithiol ≫ benzenethiol ≃ 1-hexanethiol. Furthermore, the data imply that photoelectrodes that give enhanced light scattering should be able to be prepared for DSSCs using triggered aggregation of ZnO nanocrystal dispersions using added 1,2-benzenedithiol and in situ aggregation. The extent of light scattering of spin-coated ZnO nanocrystal films prepared by triggered aggregation can be improved by either using 1,2-benzenedithiol or using relatively high 1,2-ethanedithiol concentrations. This approach may provide a simpler method for photoelectrode construction compared to the pre-aggregation method that has been used for DSSCs.6Acknowledgements
BRS and POB would like to thank the EPSRC for funding this work (K010298/1). We would also like to thank the EPSRC's NOWNANO DTC for funding AM. We would like to thank Mr Haobai Chen for preparing the gel sample and obtaining the SEM micrographs for the ZnO nanocrystal gel.References
- S. A. McDonald, G. Konstantatos, S. Zhang, P. W. Cyr, E. J. D. Klem, L. Levina and E. H. Sargent, Nat. Mater., 2005, 4, 138–142 CrossRef CAS PubMed.
- C. B. Murray, C. R. Kagan and M. G. Bawendi, Annu. Rev. Mater. Sci., 2000, 30, 545–610 CrossRef CAS.
- J. Yan and B. R. Saunders, RSC Adv., 2014, 4, 43286–43314 RSC.
- Y. S. Wang, P. J. Thomas and P. O'Brien, J. Phys. Chem. B, 2006, 110, 21412–21415 CrossRef CAS PubMed.
- X.-H. Lu, Y.-Z. Zheng, S.-Q. Bi, J.-X. Zhao, X. Tao and J.-F. Chen, J. Power Sources, 2013, 243, 588–593 CrossRef CAS PubMed.
- Q. Zhang, T. P. Chou, B. Russo, S. A. Jenekhe and G. Cao, Angew. Chem., Int. Ed., 2008, 47, 2402–2406 CrossRef CAS PubMed.
- S.-W. Bian, I. A. Mudunkotuwa, T. Rupasinghe and V. H. Grassian, Langmuir, 2011, 27, 6059–6068 CrossRef CAS PubMed.
- E. J. D. Klem, D. D. MacNeil, P. W. Cyr, L. Levina and E. H. Sargent, Appl. Phys. Lett., 2007, 90, 183113 CrossRef PubMed.
- J. M. Luther, M. Law, Q. Song, C. L. Perkins, M. C. Beard and A. J. Nozik, ACS Nano, 2008, 2, 271–280 CrossRef CAS PubMed.
- R. Rhodes, P. O'Brien and B. R. Saunders, J. Colloid Interface Sci., 2011, 358, 151–159 CrossRef CAS PubMed.
- Q. Zhang, T. P. Chou, B. Russo, S. A. Jenekhe and G. Cao, Adv. Funct. Mater., 2008, 18, 1654–1660 CrossRef CAS.
- N. S. Pesika, Z. Hu, K. J. Stebe and P. C. Searson, J. Phys. Chem. B, 2002, 106, 6985–6990 CrossRef CAS.
- W. J. E. Beek, M. M. Wienk, M. Kemerink, X. Yang and R. A. J. Janssen, J. Phys. Chem. B, 2005, 109, 9505 CrossRef CAS PubMed.
- H. Wang, L. Xin, H. Wang, X. Yu, Y. Liu, X. Zhou and B. Li, RSC Adv., 2013, 3, 6538–6544 RSC.
- D. Weber, S. Botnaras, D. V. Pham, J. Steiger and L. De Cola, J. Mater. Chem. C, 2013, 1, 3098–3103 RSC.
- S. D. Oosterhout, M. M. Wienk, S. S. van Bavel, R. Thiedmann, L. J. A. Koster, J. Gilot, J. Loos, V. Schmidt and R. A. J. Janssen, Nat. Mater., 2009, 8, 818–824 CrossRef CAS PubMed.
- P. R. Brown, D. Kim, R. R. Lunt, N. Zhao, M. G. Bawendi, J. C. Grossman and V. Bulović, ACS Nano, 2014, 8, 5863–5872 CrossRef CAS PubMed.
- P. W. Sadik, S. J. Pearton, D. P. Norton, E. Lambers and F. Ren, J. Appl. Phys., 2007, 101, 104514 CrossRef PubMed.
- L. J. A. Koster, S. Khodabakhsh and N. C. Greenham, Soft Matter, 2014, 10, 6485–6490 RSC.
- R. Rhodes, M. Horie, H. Chen, Z. Wang, M. L. Turner and B. R. Saunders, J. Colloid Interface Sci., 2010, 344, 261–271 CrossRef CAS PubMed.
- A. de Kergommeaux, J. Faure-Vincent, A. Pron, R. de Bettignies and P. Reiss, Thin Solid Films, 2013, 535, 376–379 CrossRef CAS PubMed.
- G. Sarasqueta, K. R. Choudhury and F. So, Chem. Mater., 2010, 22, 3496–3501 CrossRef CAS.
- M. H. Zarghami, Y. Liu, M. Gibbs, E. Gebremichael, C. Webster and M. Law, ACS Nano, 2010, 4, 2475–2485 CrossRef CAS PubMed.
- H.-Z. Yu, Y.-M. Yang, L. Zhang, Z.-M. Dang and G.-H. Hu, J. Phys. Chem. A, 2014, 118, 606–622 CrossRef CAS PubMed.
- D. A. Armstrong, Q. Sun, G. N. R. Tripathi, R. H. Schuler and D. McKinnon, J. Phys. Chem., 1993, 97, 5611–5617 CrossRef CAS.
- F. G. Bordwell and D. L. Hughes, J. Org. Chem., 1982, 47, 3224–3232 CrossRef CAS.
- C. Hansch, A. Leo and R. W. Taft, Chem. Rev., 1991, 91, 165–195 CrossRef CAS.
- U. K. Gautam, M. Rajamathi, F. Meldrum, P. Morgand and R. Seshadria, Chem. Commun., 2001, 629 RSC.
- D. R. Lide. CRC Handbook Chemistry and Physics, CRC Press, 85th edn, 2002 Search PubMed.
- E. Daly and B. R. Saunders, Langmuir, 2000, 16, 5546–5552 CrossRef CAS.
- J. A. Long, D. W. J. Osmond and B. Vincent, J. Colloid Interface Sci., 1973, 42, 545–553 CrossRef CAS.
- W. Heller and W. J. Pangonis, J. Chem. Phys., 1957, 26, 498–506 CrossRef CAS PubMed.
- M. E. Kern and D. F. Watson, Langmuir, 2014, 30, 13293–13300 CrossRef CAS PubMed.
- U. Koch, A. Fojtik, H. Weller and A. Henglein, Chem. Phys. Lett., 1985, 122, 507–510 CrossRef CAS.
- E. A. Meulenkamp, J. Phys. Chem. B, 1998, 102, 5566 CrossRef CAS.
- M. Whittle and E. Dickinson, Molecular physics, 1997, 90, 739–758 CrossRef CAS.
- E. Dickinson, J. Colloid Interface Sci., 2000, 225, 2–15 CrossRef CAS PubMed.
- P. Meakin, Adv. Colloid Interface Sci., 1988, 28, 249–331 CrossRef CAS.
- M. Whittle and E. Dickinson, Molecular physics, 1997, 90, 739–757 CrossRef CAS.
- D. T. W. Toolan, S. Fujii, S. J. Ebbens, Y. Nakamura and J. R. Howse, Soft Matter, 2014, 10, 8804–8812 CAS.
- Z. Farrell, C. Shelton, C. Dunn and D. Green, Langmuir, 2013, 29, 9291–9300 CrossRef CAS PubMed.
- B. R. Saunders and M. L. Turner, Adv. Colloid Interface Sci., 2008, 138, 1 CrossRef CAS PubMed.
- D. J. Shaw. Introduction to colloid and surface chemistry, Butterworth Heinemann, Oxford, 4th edn, 1993, p. 200 Search PubMed.
- L. Bergstrom, Adv. Colloid Interface Sci., 1997, 70, 125–169 CrossRef CAS.
- H. Zhang and J. F. Banfield, CrystEngComm, 2014, 16, 1568–1578 RSC.
- I. Dekany, Pure Appl. Chem., 1993, 65, 901–906 CrossRef CAS.
- C. J. van Oss, S. N. Omenyi and A. W. Neumann, Colloid Polym. Sci., 1979, 257, 737–744 CAS.
- IUPAC Stability Constants Database, www.iupac.org/index.php?id=410.
- J. J. Choi, J. Luria, B.-R. Hyun, A. C. Bartnik, L. Sun, Y.-F. Lim, J. A. Marohn, F. W. Wise and T. Hanrath, Nano Lett., 2010, 10, 1805 CrossRef CAS PubMed.
- M. Kiguchi, H. Nakamura, Y. Takahashi, T. Takahashi and T. Ohto, J. Phys. Chem. C, 2010, 114, 22254–22261 CAS.
- Y. J. Lee, I. Jeon, W. Paik and K. Kim, Langmuir, 1996, 12, 5830–5837 CrossRef CAS.
- X. Hu and D. Yu, RSC Adv., 2012, 2, 6570–6575 RSC.
Footnote |
| † Electronic supplementary information (ESI) available. See DOI: 10.1039/c4ra15013a |
| This journal is © The Royal Society of Chemistry 2015 |

