Environmentally benign, recyclable nano hollandite and metal intercalated nano hollandites for hydrogen sulfide removal

Manikandan Prabu and Kuppukkannu Ramalingam*
Department of Chemistry, Annamalai University, Annamalainagar 608 002, Tamil Nadu, India. E-mail: krauchem@yahoo.com; Fax: +91 414 42265; Tel: +91 413 2202834

Received 17th November 2014 , Accepted 5th February 2015

First published on 5th February 2015


Abstract

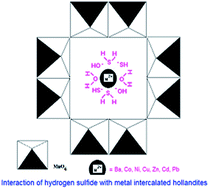
Hollandite, a 2 × 2 tunnel structure, octahedral molecular sieve (OMS-2) with Ba2+ as counter cation was prepared and characterized by PXRD, IR, SEM, EDX, HRTEM, XPS and TG-DTA techniques. HRTEM of the hollandite showed the particles to be nanorods (<20 nm) and the SAED confirmed its crystalline nature. Seven metal intercalated hollandites were prepared by ion exchange process. Metal intercalated hollandites were analyzed by ICP-OES. The metal ion intercalation was in the range of 1.09 to 2.99% by weight. Order of increasing concentrations of divalent metal ions on intercalation is: Co < Zn < Ni < Cu < Cd < Pb. The observed order is an indication of the exchanging ability of the divalent ion with Ba2+ ion of the hollandite in aqueous medium. Thermal analysis of H2S passed hollandite showed the hollandite to be a superior scrubber over birnessite. Maximum scrubbing of H2S (27%) was observed for copper intercalated hollandite and a minimum (22%) for zinc intercalated hollandite. The involvement of copper in scrubbing is important because of the Cu2+⋯SHn, a typical soft–soft interaction. Overall H2S scrubbing ability followed the order: birnessite (18%) < hollandite (20%) < metal ion intercalated hollandite (27%) and the scrubbing efficiency is remarkable for a dry scrubber under laboratory conditions. Hydrogen sulfide scrubbed hollandite showed relatively poor recyclability compared to intercalated material. Intercalated metal ion increases structural integrity, stabilizes the active metal against reduction and increases the scrubbing ability. The scrubber is recyclable by a simple heating process. The scrubber is benign to nature as it's a synthetic analogue of naturally occurring marine nodule type of material.

1. Introduction

Marine nodule type manganese oxides have been intensively investigated during the past few decades because of their economic values and potential applications. Synthetic analogues of the manganese oxides are used as ion sieves, molecular sieves and catalysts. MnO2 is used as a cathode material in lithium batteries. The material possesses excellent cation-exchange, electrochemical and magnetic properties.1–4 Manganese dioxide shows two important structural variations: (i) layer structure and (ii) tunnel structure. Best example of a layer structured manganous oxide is birnessite, which is a two dimensional layered structure that contains edge-shared MnO6 octahedra with cations and water molecules occupying the interlayer region.5 The tunnel structured are, pyrolusite (1 × 1), ramsdellite (1 × 2), spinel (1 × 3), hollandite (2 × 2), romanechite (2 × 3), and todorokite (3 × 3).6 The tunnel structures are formed by edge and corner shared MnO6 octahedra which are also known as octahedral molecular sieve (OMS) materials.7–14 Manganese oxide octahedral molecular sieve materials have straight channels inside the structure with varying pore diameters. OMS-2 material consists of two sheets of MnO6 octahedra joined at edges to form the 2 × 2 tunnel structure. One of the unique properties of the OMS-2 type of materials is the presence of both, Mn3+ and Mn4+ ions in the manganese oxide framework. The average oxidation state of manganese in the OMS-type of materials is in the range of 3.40 to 3.99, depending on the Mn4+/Mn3+ ratio. Cryptomelane-type (2 × 2) manganese oxide (OMS-2) materials are a group of important OMS materials because of their use in catalysis, separations, chemical sensors, and batteries. The pore diameter of the tunnel is about 0.46 nm. The tunnels (2 × 2) are partially filled with uni- or divalent cations such as Ba2+ (hollandite), K+ (cryptomelane), Na+ (manjiroite), and Pb2+ (coronadite).15 Reflux method was mostly used to prepare bulk OMS-2 materials.16,17 Other metal cations can be introduced into the tunnel by post ion exchange18–20 or into the framework by substitution during synthesis.21,22 Substitution in framework sites of manganese octahedral molecular sieves by other metals is possible by doping the original reactant solutions with cations.23,24 The doping amounts of foreign cations are limited because these cations are not easy to incorporate into the structures. Coal gasification and chemical industries generate large amounts of hydrogen sulfide gas which is responsible for a serious environmental problem. H2S gas is very corrosive, and highly toxic for the living organisms even at relatively low concentration. Furthermore, it is a constituent of sulphate aerosol which decreases droplet radius in cloud. The increase of aerosol concentration weakens rain fall and hydrological cycle in polluted cloud. Several commercial techniques are available for the removal of H2S, including aqueous NaCl, iron-based sorbents, activated carbon, FeOOH, Fe2O3, metal oxides, sewage sludge, and aqueous solutions. However, the efficiency and the environment friendliness of the scrubbers need improvement. Various types of manganous oxides have been tested as scrubbers.25–27 Therefore, there is a need for research on efficient and economical methods for the removal of H2S which is inimical to the environment.28,29 Use of geochemically benign manganous oxide variants as scrubbers of environmentally highly toxic hydrogen sulfide is doubly beneficial. CO2 scrubbing by birnessite has been reported from our laboratory.30 In this paper we report the scrubbing of H2S by hollandite and metal intercalated hollandites.
image file: c4ra14714f-u1.tif

2. Experimental

2.1. Preparation of hollandite

Ba(CH3COO)2 (3.19 g) was added to 100 mL of 0.3 M Mn(CH3COO)2 solution, followed by 100 mL of 0.2 M KMnO4 solution (All the reagents are Sigma-Aldrich >99% purity). The solution was refluxed at 100 °C for 24 h, and the product was filtered, washed, and dried at 80 °C for 24 hours.

2.2. Intercalation of metal ions into hollandite

Metal ions such as Fe2+, Co2+, Ni2+, Cu2+, Zn2+, Cd2+ and Pb2+ (iron(II) and nickel(II) sulfates and other five metal(II) chlorides (Sigma-Aldrich > 99% purity)) have been intercalated into hollandite by the following ion exchange process. Hollandite (1 g) was added with 50 mL of 1 M M2+ solution in 100 mL Erlenmeyer flask, and kept for 24 hours. Then the solution was stirred vigorously with a magnetic stirrer for about 24 hours and filtered, washed with distilled water (10 mL aliquot) for five times, and dried at 60 °C in an air oven. The obtained sample was dried and powdered. The hollandite and the intercalated samples were analyzed by inductively coupled plasma/optical emission spectrometry (ICP-OES) technique and the results are shown in the Table 1. The metal ion intercalation has been in the range of 1.09 to 2.99%. The results of three different intercalations agreed within ±0.1%. The order of concentrations of divalent metal ions on intercalation is: Co < Zn < Ni < Cu < Cd < Pb. The observed order is an indication of the exchanging ability of the particular divalent ion with Ba2+ ion of the hollandite in aqueous medium.
Table 1 ICP-OES analytical data for hollandite and the intercalated hollandites
S. no   Weight in %
Ba Mn ‘M’
a Formation of Fe2(SO4)3 on reaction with MnO2.
1 BaH 14.40 34.21
2 FeHa 4.95 0.10 27.45
3 CoH 14.50 31.19 1.09
4 NiH 17.18 45.10 1.83
5 CuH 11.00 26.91 2.05
6 ZnH 13.85 39.78 1.29
7 CdH 16.74 49.92 2.82
8 PbH 7.84 24.41 2.99


2.3. H2S scrubbing process

FeS (4.0 × 10⁻⁴ kg) was taken in a round bottom flask. A solution of H2SO4 (4 N) was added slowly through a separating funnel to the round bottom flask. The released H2S gas was passed through a tightly packed MnO2 (5.0 × 10⁻⁴ kg) in a glass tube of 5 × 10⁻³ m diameter. The outlet was connected to a solution containing Pb(NO3)2 to precipitate excess H2S as PbS. The reaction was carried out in a fume cupboard. A blank run was carried out without the scrubber and the precipitate of PbS obtained was used as the standard to evaluate the scrubbing ability.

2.4. Characterization

The hollandite, metal intercalated hollandite and H2S scrubbed hollandite were characterized by powder X-ray diffraction (PXRD), infrared spectroscopy (IR), scanning electron microscopy (SEM), energy dispersive X-ray spectroscopy (EDX), high resolution transmission electron microscopy (HRTEM), X-ray photo electron spectroscopy (XPS) and thermo gravimetric and differential thermal analysis (TG-DTA) techniques. Powder X-ray diffraction patterns were recorded with a BRUKER-D8, X-ray diffractometer using Cu-Kα radiation (step time = 30.6, voltage = 40 kV, current = 30 mA, range of 2θ = 5.0 to 80.0°). Avatar Nicolet 360 FT-IR spectrophotometer (range: 4000 and 450 cm−1, 120 scans at a resolution of 1.0 cm−1) was used for recording the infrared spectra of the complexes. Spectra were taken as potassium bromide discs of the compounds (a KBr disk of the compound will contain about 1 to 2% of the active compound). In a typical disk preparation, ∼4 × 10⁻⁶ kg of the active compound was thoroughly ground to a fine powder with a pestle & mortar and then subsequently, ∼4 × 10⁻³ kg of KBr (spectrometric grade, Sigma-Aldrich) from the oven was added and ground to a fine powder. Thin disk was pressed from the powder with a hydraulic pellet press. Thermogravimetric experiments were carried out in nitrogen atmosphere using alumina as reference with NETZSCH STA 449F3 instrument. The heating rate of the furnace was fixed at 10 °C per minute and the samples were heated up to 700 °C by taking approximately 1 × 10⁻⁵ kg of the sample in a platinum crucible for each thermogravimetric experiment. Samples for electron spectroscopy were treated with dry absolute alcohol for dehydrating the samples. Scanning electron micrographs of the samples were recorded with JSM-6390 VERSION 1.0 & FEI QUANTA FEG 200 – high resolution scanning electron microscope (resolution of secondary electron image (SEI) 3.0 nm at an accelerating voltage 30 kV; 8.0 nm at accelerating voltage 3 kV, Magnification ×5 (WD 48 mm) to ×300[thin space (1/6-em)]000 (WD 8 mm)) HRTEM was obtained by employing Tecnai F20, with an accelerating voltage of 200 kV, PTP resolution: 0.24 nm and information limit: 0.14 nm. Metal ion concentrations were determined by PERKIN ELMER OPTIMA 5300 DV ICP-OES. About 20 × 10−5 kg of the sample was accurately weighed and dissolved in HCl–HNO3 (3[thin space (1/6-em)]:[thin space (1/6-em)]1 v/v) and made up to 50 mL in a standard measuring flask for ICP-OES analysis. A calibrant was used for each element under analysis.

3. Results and discussion

3.1. Characterization of hollandite and metal intercalated hollandites

The hollandite is denoted as BaH. The metal ion intercalated hollandites are denoted as FeH, CoH, NiH, CuH, ZnH, CdH, PbH. On intercalation of Fe2+ in to hollandite, the sample changed its color from grey black to yellow, indicating its decomposition.

PXRD pattern for hollandite is shown in Fig. 1a. The pattern shows characteristic signals at 28.4, 28.7, 37.40 and 41.5° and matched with the JCPDS: 78-0962 corresponding to Ba–MnO2 hollandite.24 Fig. 1b–h correspond to PXRD patterns of FeH, CoH, NiH, CuH, ZnH, CdH, PbH respectively. Fe intercalate of hollandite showed a different PXRD pattern altogether indicating the decomposed hollandite.


image file: c4ra14714f-f1.tif
Fig. 1 PXRD of (a) BaH, (b) FeH, (c) CoH, (d) NiH, (e) CuH, (f) ZnH, (g) CdH, and (h) PbH.

Representative scanning electron micrographs of the metal intercalated hollandites, CuH, ZnH, CdH and PbH are shown in Fig. 2a–d respectively. The Cu, Zn, Cd intercalated samples are of identical morphology and they appeared as microfibers. The Pb intercalated hollandite showed the particles to be of spherical shape. EDX spectra of CuH, ZnH, CdH and PbH are shown in Fig. 3a–d which confirmed the presence of Mn, Ba, and the corresponding intercalated metal ions. Representative HRTEM and Selected area electron diffraction (SAED) of the hollandites are shown in Fig. 4. TEM showed the particles to be nanorods (<20 nm). Fig. 4d showed the SAED spectrum of the hollandite which indicated its crystalline nature.


image file: c4ra14714f-f2.tif
Fig. 2 SE micrographs of metal intercalated hollandite (a) CuH, (b) ZnH, (c) CdH, and (d) PbH.

image file: c4ra14714f-f3.tif
Fig. 3 EDX spectra of metal intercalated hollandite (a) CuH, (b) ZnH, (c) CdH, and (d) PbH.

image file: c4ra14714f-f4.tif
Fig. 4 HRTEM of BaH (a) 20 nm, (b) 50 nm, (c) 100 nm, and (d) SAED of BaH.

Representative XPS spectrum of PbH is shown in Fig. 5. A survey spectrum is shown in Fig. 5a. Presence of Mn, Ba, Pb and oxygen apart from carbon is evident from the survey scan. Fig. 5b shows the presence of Mn 2p1/2 signal at 654.17 eV which can be attributed to a mixture of Mn4+ and Mn3+ species.31 Fig. 5c shows the presence of barium 3d5/2 signal at 779.68 eV in agreement with those reported earlier (http://www.srdata.nist.gov/xps/Default.aspx). The corresponding signal of barium in the free state is 781.02 eV indicating marginal increase in positive charge on barium. Fig. 5d depicts the presence of Pb2+ 4f3/2 signal at 139.35 (138.03) eV and the values in parentheses correspond to the free ion binding energies. The observed values indicate minor changes in the electronic environments of the cations. However, XPS unambiguously established the intercalation of the metal ions in to the hollandite framework.


image file: c4ra14714f-f5.tif
Fig. 5 XPS survey spectrum of PbH (a) survey spectrum, (b) Mn, (c) Ba, and (d) Pb.

Fig. 6a–h show TG-DTA for BaH, FeH, CoH, NiH, CuH, ZnH, CdH and PbH respectively. DTA shows a clear exothermic reaction around 340 °C in all the compounds (red curve) due to initial absorption of nitrogen gas in to the tunnels and a concomitant steep loss of mass was observed in the TG curve (blue curve) as the first step of thermal decomposition. The second step was a flat range without any conspicuous loss of mass up to 500 °C. In the temperature range of 550–700 °C, a further loss of ∼2% mass was observed due to a loss of lattice trapped gas and carbon. The total mass loss up to 700 °C was approximately 18% which is far higher than the loss observed in birnessite in a similar thermal decay. The observation shows that the 2 × 2 tunnelled hollandite retains more water molecules in the lattice than the birnessite.30


image file: c4ra14714f-f6.tif
Fig. 6 TG and DTA curves of sample (a) BaH, (b) FeH, (c) CoH, (d) NiH, (e) CuH, (f) ZnH, (g) CdH and (h) PbH.

Fig. 7a and b depicts the representative infrared spectra (IR) of the hollandite and copper intercalated hollandites. The broad band at 3405 cm−1 is due to stretching vibrations of interlayer water molecules. The band at 1617 cm−1 is assigned to the bending vibration of H2O and structural OH groups. Bands around 734 (sh), 553, 558 (split bands) cm−1 are characteristic bands of manganese oxides with tunnel structure.30 The observation signifies the stabilization of the tunnel structure after metal ion intercalation. IR of copper intercalated sample shows four medium intensity bands at 513, 602, 622 and 630 cm−1 indicating Cu–O interactions. The band around 734 cm−1 is retained in the intercalated spectrum suggesting the existence of the parent structure.


image file: c4ra14714f-f7.tif
Fig. 7 FTIR spectra of (a) BaH and (b) CuH.

3.2. Characterization of H2S passed hollandite and metal intercalated hollandite

Dark brown colored metal intercalated hollandites on passing H2S turned yellow and on aging, the yellow colour faded out. The most intense yellow colour was observed in the case of hollandite and retained the colour for a longer duration compared to other metallated hollandites. The yellow colored FeH sample on passing H2S turned black indicating the formation of ferrous sulfide. The colour changes confirmed the absorption of H2S gas by the material and the concomitant chemical change. A typical sulphidation reaction takes place as follows:
MOx (s) + H2S(g) → MS(s) + H2O(g)

Presence of additional metal ion increases structural integrity and stabilizes the active metal against reduction and increases the scrubbing ability. Fig. 8a–h shows the PXRD patterns for H2S passed BaH, FeH, CoH, NiH, CuH, ZnH, CdH, and PbH respectively. PXRD patterns excepting that of iron intercalate were identical. In general, PXRD patterns of H2S passed hollandite and metal intercalated hollandites were different. Examination of the PXRD patterns with the JCPDS data bank revealed the presence of a mixture of BaS, MnS and the intercalated metal sulfide. For the Co, Ni, Cu, Pb, Zn, Cd intercalated hollandites, the major products on H2S scrubbing are BaS (24.1, 28.0, 39.9°; JCPDS: 750896), MnS (27.6, 45.9, 54.4°; JCPDS: 894953), MnS2, the hauerite (29.2, 41.8, 49.5°; JCPDS: 762052) and the free hollandite as evident from the PXRD patterns. Iron intercalated hollandite on passing H2S, showed the formation of a mixture of BaS (24.1, 28.0, 39.9°; JCPDS: 750896), Fe3S2 (25.9, 33.2, 52.0°; JCPDS: 370475).


image file: c4ra14714f-f8.tif
Fig. 8 PXRD of H2S passed (a) BaH, (b) FeH, (c) CoH, (d) NiH, (e) CuH, (f) ZnH, (g) CdH, and (h) PbH.

Fig. 9 shows SEM images of H2S passed metal intercalated hollandites. A comparison of the SEM of the metal intercalated images with those of the H2S passed materials show a clear change in morphology. However, nano wires of unreacted material were also visible on the surface. Fig. 10a–d displays EDX spectra of H2S passed CuH, ZnH, CdH and PbH respectively. The spectra confirmed the presence of S, Mn, Ba, and the presence of intercalated divalent ions of Cu, Zn, Cd and Pb in the sample other than oxygen and carbon. The peak intensity of sulphur represents the extent of absorption of H2S gas by the material. HRTEM of the H2S passed hollandite (Fig. 11) showed spherical particles of varying homogeneity smeared over the nanorods. The unreacted hollandite appeared as nano rods and the small percentage of spherical particles are the metal sulfides. The SAED showed the highly crystalline nature of the scrubbed hollandite lattice.


image file: c4ra14714f-f9.tif
Fig. 9 SEM images of H2S passed metal intercalated hollandite samples (a) CuH, (b) ZnH, (c) CdH, and (d) PbH.

image file: c4ra14714f-f10.tif
Fig. 10 EDX spectrum of metal intercalated hollandite sample (a) CuH, (b) ZnH, (c) CdH, and (d) PbH.

image file: c4ra14714f-f11.tif
Fig. 11 HRTEM image of H2S passed BaH (a) 20 nm, (b) 50 nm, (c) 100 nm, and (d) SAED spectrum of BaH.

Fig. 12 shows the XPS spectrum of H2S passed BaH. A survey spectrum showed (Fig. 12a) the presence of Mn, Ba, S and oxygen apart from carbon. Fig. 12b showed the presence of Mn 2p1/2 signal at 655.45 eV which is higher than the binding energy of BaH indicating the anion surcharged atmosphere around the cations after scrubbing. The binding energy is still close to a formal oxidation state of ∼+3.5 for manganese. Fig. 12c shows the presence of barium 3d5/2 signal at 783.25 eV which is a significant increase compared to that in BaH and is attributable to the increased anionic population around the cations after scrubbing. Fig. 12d shows the presence of signal due to sulphur 2p at 165.06 eV which confirmed the scrubbing of H2S gas by hollandite. Fig. 13 is a representative XPS spectrum of cobalt intercalated hollandite. Mn 2p3/2 and 2p1/2 signals appear almost unaltered at 640.25 and 651.98 eV with reference to free MnO2. Cobalt 2p3/2 signal appears at 780.87 eV significantly higher than the BE observed for CoS2/CoS.32 The observation indicates the involvement of cobalt in scrubbing H2S. Table 2 gives the important binding energies associated with the XPS emissions. Binding energies associated with Mn 2p3/2 electrons showed a width of 640.25–643.73 eV and the 2p1/2 electrons 650.94–655.45 eV. The Ba 3d5/2 binding energies are observed in the range of 779.12 to 783.25 eV. The maximum binding energy change was observed for hollandite after scrubbing. Other than hollandite, among the metal intercalated, cadmium and lead intercalates showed higher binding energies. The increased binding energies reflect an increased anionic environment of OH, SH, H2S and H2O in the solid.


image file: c4ra14714f-f12.tif
Fig. 12 XPS of H2S passed BaH (a) survey spectrum of BaH (b) Mn, (c) Ba, and (d) S.

image file: c4ra14714f-f13.tif
Fig. 13 XPS spectrum of cobalt interacted hollandite on H2S scrubbing.
Table 2 XPS binding energies (eV)
Compound Ba 3d5/2 Mn 2p3/2 Mn 2p1/2 Ma 2p3/2 S 2p
a M = Co, Ni, Cu, Zn, Cd, Pb.b Turned dark yellow on passing H2S and retained the colour for the longest duration.c 3d5/2.d Appeared as a single band for 4f7/2 and 4f5/2.
1 BaH 779.68 642.57 654.17
2 H2S passed BaHb 783.25 643.60 655.45 165.06
3 H2S passed CoH 780.87 640.25 651.98 780.87 165.08
4 H2S passed NiH 779.12 640.96 652.87 851.32 166.15
5 H2S passed CuH 779.99 641.42 653.94 932.67 164.10
6 H2S passed ZnH 779.34 639.24 650.94 1022.79 164.06
7 H2S passed CdH 781.96 642.14 653.51 407.78c 166.04
8 H2S passed PbH 782.09 643.73 655.04 139.35d 165.53


A plot of binding energies of Ba 3d5/2 and Mn 2p1/2 electrons against the intercalated ‘dn’ electron configuration is shown in Fig. 14. The d electron configuration of manganese was taken as 3.5 as its formal oxidation state is known to be between +3 and +4 in hollandite. For both the Ba 3d5/2 and Mn 2p1/2 electrons the binding energies show a maximum for hollandite. Ba 3d5/2 electron binding energy shows a minimum for nickel (d8) intercalate and shows a second maximum for copper (d9). The involvement of copper in scrubbing is important because of the fact that Cu2+ ion is a typical soft acid. Similarly, sulphur is a typical soft base. Therefore, the interaction between the two species, Cu2+⋯SH2 is highly favoured due to a typical ‘soft–soft’ interaction. Mn 2p1/2 electron binding energy shows a second maximum for copper intercalate as well. A plot of sulphur 2p electron binding energies against the d electron configurations is shown in Fig. 15. The sulphur 2p electron binding energy variation depicted in the figure is found to show a maximum for nickel intercalates (d8). The observed trends clearly establish the involvement of intercalated metal in the scrubbing process. Increased binding energies of the electrons of different cations unequivocally prove the fact that the residual positive charge on them increase. The observed binding energies of the electrons of the cations reflect an environment of predominantly of OH and SH anions and H2S and in situ generated H2O molecules. The conclusion is supported by reports of large binding energies associated with the cations of highly ionic salts such as BaH2, Ni(OH)2, Ni(NO3)2 and NiCl2.33–38 Cadmium and lead intercalates showed larger binding energy increases compared to other first row transition elements. However, there was no pronounced difference in scrubbing ability of the heavier cation intercalated hollandites. The XPS investigation establishes the involvement of intercalated metal ions in the scrubbing process. A highly surcharged atmosphere of anions around the cations in the solid material is also evident from the analysis. Formation of metal sulfides and existence of strong ionic interactions must be responsible for the increased binding energies of the electrons.


image file: c4ra14714f-f14.tif
Fig. 14 Ba 3d5/2 and Mn 2p1/2 binding energy variations with intercalated d electron configuration.

image file: c4ra14714f-f15.tif
Fig. 15 S 2p binding energy variations with intercalated d electron configuration.

Fig. 16a–h show TG-DTA for H2S passed BaH, FeH, CoH, NiH, CuH, ZnH, CdH and PbH respectively. An abrupt weight loss was observed at 120 °C as an exothermic decomposition followed by another dramatic steep loss of mass at 515 °C. The second thermal decay was a clear exoergic process. An increased mass loss observed due to the scrubbed H2S and the H2O generated as a by product of absorption of H2S. In general, MnO2 is stable up to 400 °C, in the present analysis 40% of mass loss was observed clearly indicating the loss of trapped H2O and H2S.


image file: c4ra14714f-f16.tif
Fig. 16 TG and DTA curves of H2S passed samples (a) BaH, (b) FeH, (c) CoH, (d) NiH, (e) CuH, (f) ZnH, (g) CdH, and (h) PbH.

Fig. 17 shows the FTIR spectrum of H2S passed hollandite. Spectrum shows well resolved bands at 507 and 616 cm−1 suggesting the change in Mn–O vibrations on H2S scrubbing. A weak band at 435 cm−1 indicates Mn–S stretching vibration.


image file: c4ra14714f-f17.tif
Fig. 17 FTIR spectrum of H2S passed BaH.

3.3. Recyclability and efficiency

Grey coloured hollandite and the metal intercalated hollandites on H2S scrubbing turned yellow, on aging, in air the colour faded gradually. Maximum scrubbing of H2S (27%) was observed for zinc intercalated hollandite and a minimum (22%) for lead intercalated hollandite. Present investigation showed the following overall H2S scrubbing ability: birnessite (18%) < hollandite (20%) < metal ion intercalated hollandite (27%), the efficiencies being accurate to 1% for three experimental determinations for mass increase after scrubbing process. The scrubbing efficiency is remarkable for a dry scrubber under laboratory conditions. The material was stable below 400 °C. The scrubbing ability of the scrubber was restored on heating the used material at 110 °C for an hour. The major products on H2S scrubbing are BaS (24.1, 28.0, 39.9°; JCPDS: 750896), MnS (27.6, 45.9, 54.4°; JCPDS: 894953), MnS2, the hauerite (29.2, 41.8, 49.5°; JCPDS: 762052) as evident from the PXRD patterns. The intercalated metals are present only to a maximum of 2.99% (Pb) by weight. The intercalated metal sulfides have not been identified by powder XRD indicating their relative miniscule percentage after scrubbing. Recycling of the scrubber indicated only a variation of 1% in their scrubbing ability after three cycles. The observation is a clear indication of the fact that the formation of metal sulphides did not affect the recyclability of the scrubbers. The metal intercalation process is aimed at improving the interaction between the scrubber and the runoff to be scrubbed at the molecular level. In addition, the metal intercalation process increases the structural integrity of the scrubber. Once the scrubber is intercalated with a metal ion, it reaches a saturation point beyond which further use of this material to scrub metal ions from waste waters will be relatively less.

4. Conclusions

Hollandite was prepared and characterized by various physical techniques. XPS survey scan showed the presence of Mn, Ba. BE specific scans showed the presence of Mn 2p1/2 signal at 654.2 eV and Mn 2p3/2 at 642.6 eV which can be attributed to a mixture of Mn4+ and Mn3+ species. HRTEM of the hollandite showed it to be nanorods (<20 nm) and the SAED showed the partial crystalline nature of the sample. On H2S scrubbing, the products were analyzed by PXRD, FTIR. The PXRD pattern accounted qualitatively for a mixture of S and MnS in birnessite and BaS, S and MnS in hollandite. Thermal analysis on hollandite after the scrubbing process revealed an increased mass loss is due to the scrubbed H2S and the concomitant release of H2O as a product of sulphidation. The observation contrasted well with the thermal analysis pattern of birnessite which showed a much less loss of mass. The metal ion intercalation analyzed by ICP-OES showed the range of metal ion as 1.09 to 2.99%. The results of three different intercalations agreed within ±0.1%. The order of concentrations of divalent metal ions on intercalation is: Co < Zn < Ni < Cu < Cd < Pb. The observed order is an indication of the exchanging ability of the particular divalent ion with Ba2+ ion of the hollandite in aqueous medium.

HRTEM images of the H2S passed intercalated hollandites showed the presence of spherical nanosized particles of the sulfides smeared over the unreacted hollandite nanorods. EDX indicates the presence of Ba, Mn and S in the H2S passed hollandite. All the intercalated hollandites showed mass losses ranging from 10–22% during thermal analysis. The initial phase of decomposition extended up to 400 °C. The decompositions are exothermic in nature. Thermal analysis of the hollandite showed a discrete steep decay at 340 °C and the total loss of mass was ∼48%. The mass of precipitated PbS during the H2S scrubbing study showed a minimum for zinc intercalated hollandite (22%) and a maximum (27%) for lead intercalated hollandite. The present investigation showed the following overall H2S scrubbing ability: birnessite (18%) < hollandite (20%) < metal ion intercalated hollandite (27%) and the scrubbing efficiency is remarkable for a dry scrubber under laboratory conditions. Presence of additional metal ion increases pore structure integrity, reduces the probability of stable metal sulfide formation and stabilizes the active metal against reduction and improves the recyclability.

Acknowledgements

Financial support to carry out this work in the form of a research grant (no. 01(2397)/10/EMR-II) by Council of Scientific and Industrial Research (CSIR), New Delhi, India is gratefully acknowledged.

References

  1. A. R. Armstrong, H. Huang, R. A. Jennings and P. G. Bruce, J. Mater. Chem., 1998, 8, 255–259 RSC.
  2. H. Cao and S. L. Suib, J. Am. Chem. Soc., 1994, 116, 5334–5342 CrossRef CAS.
  3. Q. Feng, H. Kanoh and K. Ooi, J. Mater. Chem., 1999, 9, 319–333 RSC.
  4. Y. F. Shen, R. P. Zerger, R. N. DeGuzman, S. L. Suib, L. McCurdy, D. L. Potter and C. L. O'Young, Science, 1993, 260, 511–515 CAS.
  5. S. Ching, D. J. Petrovay, M. L. Jorgensen and S. L. Suib, Inorg. Chem., 1997, 36, 883–890 CrossRef CAS.
  6. Q. Feng, K. Yanagisawa and N. Yamasaki, J. Porous Mater., 1998, 5, 153–162 CrossRef CAS.
  7. S. Turner, M. D. Siegel and P. R. Buseck, Nature, 1982, 296, 841–842 CrossRef CAS.
  8. D. L. Bish and J. E. Post, Am. Mineral., 1989, 74, 177–186 CAS.
  9. R. G. Burns, V. M. Burns and H. W. Stockman, Am. Mineral., 1983, 68, 972–980 CAS.
  10. D. C. Golden, C. C. Chen and J. B. Dixon, Science, 1986, 231, 717–719 CAS.
  11. D. C. Golden, C. C. Chen and J. B. Dixon, Clays Clay Miner., 1987, 35, 271–280 CAS.
  12. J. E. Post, Proc. Natl. Acad. Sci. U. S. A., 1999, 96, 3447–3454 CrossRef CAS.
  13. J. E. Post and D. L. Bish, Am. Mineral., 1988, 73, 861–869 CAS.
  14. J. E. Post and D. R. Veblen, Am. Mineral., 1990, 75, 477–489 CAS.
  15. X. Wang and J. Li, Chem.–Eur. J., 2003, 9, 300–306 CrossRef CAS PubMed.
  16. J. Cai, J. Liu and S. L. Suib, Chem. Mater., 2002, 14, 2071–2077 CrossRef CAS.
  17. R. N. De Guzman, Y. F. Shen, B. R. Shaw, S. L. Suib and C. L. O’Young, Chem. Mater., 1993, 5, 1395–1400 CrossRef CAS.
  18. D. C. Golden, J. B. Dixon and C. C. Chen, Clays Clay Miner., 1986, 34, 511–520 CAS.
  19. A. Dyer, M. Pillinger, J. Newton, R. Harjula, T. Moller and S. Amin, Chem. Mater., 2000, 12, 3798–3804 CrossRef CAS.
  20. G. G. Xia, Y. G. Yin, W. S. Willis, J. Y. Wang and S. L. Suib, J. Catal., 1999, 185, 91–105 CrossRef CAS.
  21. X. Chen, Y. F. Shen, S. L. Suib and C. L. O'Young, Chem. Mater., 2002, 14, 940–948 CrossRef CAS.
  22. R. N. De Guzman, Y. F. Shen, E. J. Neth, S. L. Suib, C. L. O'Young, S. Levine and J. M. Newsam, Chem. Mater., 1994, 6, 815–821 CrossRef CAS.
  23. S. L. Suib, Curr. Opin. Solid State Mater. Sci., 1998, 3, 63–70 CrossRef CAS.
  24. D. Zhai, B. Li, C. Xu, H. Du, Y. He, C. Wei and F. Kang, J. Power Sources, 2011, 196, 7860–7867 CrossRef CAS PubMed.
  25. D. J. Couling, H. V. Nguyen and W. H. Green, Fuel, 2012, 97, 783–795 CrossRef CAS PubMed.
  26. T.-H. Ko, H. Chu and L.-K. Chaung, Chemosphere, 2005, 58, 467–474 CrossRef CAS PubMed.
  27. M. I. Zaman, S. Mustafa, S. Khan, M. I. Khan, A. Niaz and Y. Muhammad, Sep. Sci. Technol., 2013, 48, 1709–1716 CrossRef CAS.
  28. R. Chandra Sahu, R. Patel and B. C. Ray, Fuel Process. Technol., 2011, 92, 1587–1592 CrossRef PubMed.
  29. N. Rakmak, W. Wiyaratnb, C. Bunyakan and J. Chungsiriporn, Chem. Eng. J., 2010, 162, 84–90 CrossRef CAS PubMed.
  30. K. Ramalingam, T. Kamatchi and P. A. Sumod, Transition Met. Chem., 2006, 31, 429–433 CrossRef CAS PubMed.
  31. J. Chen, X. Tang, J. Liu, E. Zhan, J. Li, X. Huang and W. Shen, Chem. Mater., 2007, 19, 4292–4299 CrossRef CAS.
  32. http://www.srdata.nist.gov/xps/Default.aspx: NIST X-ray Photoelectron Spectroscopy Database, Version 4.1 (National Institute of Standards and Technology, Gaithersburg, 2012), http://www.srdata.nist.gov/xps/.
  33. P. Dufresne, E. Payen, J. Grimblot and J. P. Bonnelle, J. Phys. Chem., 1981, 85, 2344–2351 CrossRef CAS.
  34. H. F. Franzen, J. Merrick, M. Umana, A. S. Khan, D. T. Peterson, J. R. Mc Creary and J. Thorn, J. Electron Spectrosc. Relat. Phenom., 1977, 11, 439–443 CrossRef CAS.
  35. J. C. Klein and D. M. Hercules, J. Catal., 1983, 82, 424–441 CrossRef CAS.
  36. A. N. Mansour and C. A. Melendres, Surf. Sci. Spectra, 1994, 3, 247–254 CrossRef CAS.
  37. H. Seyama and M. Soma, J. Chem. Soc., Faraday Trans., 1984, 80, 237–248 RSC.
  38. C. A. Tolman, W. M. Riggs, W. J. Linn, C. M. King and R. C. Wendt, Inorg. Chem., 1973, 12, 2770–2778 CrossRef CAS.

This journal is © The Royal Society of Chemistry 2015
Click here to see how this site uses Cookies. View our privacy policy here.