Characterization and prediction of blend properties and evaluation of engine performance and emission parameters of a CI engine operated with various biodiesel blends
A. Sanjid*,
H. H. Masjuki,
M. A. Kalam*,
S. M. Ashrafur Rahman*,
M. J. Abedin and
I. M. Rizwanul Fattah
Centre for Energy Sciences, Department of Mechanical Engineering, Faculty of Engineering, University of Malaya, Kuala Lumpur, 50603, Malaysia. E-mail: rahman.ashrafur.um@gmail.com; sanjidum@gmail.com; kalam@um.edu.my; Fax: +60 3 79675317; Tel: +60 3 79674448
First published on 6th January 2015
Abstract
The present research is aimed to investigate the feasibility of using palm (PB), mustard (MB) and Calophyllum biodiesel (CB) as renewable and alternative fuels. Biodiesels were produced from the respective crude vegetable oils and physicochemical properties of the biodiesel–diesel blends were graphically compared for all possible biodiesel blends at every 10% composition interval. By applying the curve-fitting method, equations were developed for predicting important properties, which show very close fit to the experimental data. This will help future research such as the optimization of blending percentage, engine combustion and performance and emission analysis. As up to 20% blends of biodiesels showed similar properties to diesel fuel, the engine performance and emission of the 10% and 20% biodiesel–diesel blends were studied for all three feedstocks, as well as diesel fuel, to perform a comparative study. An average of 7–12% BSFC increment was observed for biodiesel blends compared to diesel fuel. The brake power was decreased on average of 4.1–7.7% while operating on the biodiesel blends. Nitric oxide (NO) emission increased 9–17% and hydrocarbon and carbon monoxide (CO) emission showed improved results for the biodiesel blends. An average of 23–43% lower HC and 45–68% lower CO emission resulted from the biodiesel blends compared to those from diesel fuel.
1. Introduction
In the recent decade, the ever increasing trend of energy consumption due to industrialization and development has caused serious threats to the energy resources and environment. The current reserve of liquid fuel has the capacity to meet only half of the global energy demand until 2023.1 In addition, this tremendous stream of fossil fuel use hazardously affects the global environment, which includes global warming, deforestation, eutrophication, ozone depletion, photochemical smog and acidification.2 The world is now moving towards green technology by encouraging the usage of cleaner, safer and renewable energy.3 Greater energy conservation, pollution reduction, and the resolving of foreign exchange and other socio-economic issues stimulate the rapid growth of biofuel industries over the next decade. Biodiesel is progressively gaining acceptance as an alternative and renewable energy source, and market demand will rise intensely in the near future.4,5 According to the International Energy Agency (IEA), around 27% of the total transport fuel will be replaced completely by biofuels by 2050.6Biodiesel fuels are mono alkyl esters and are generally derived from fatty esters of vegetable oil or animal fat. Trans-esterification is the most popular chemical treatment to reduce viscosity and improve other properties.7 Trans-esterified vegetable oils are widely being used in diesel engines at present and meet the standard specifications of the ASTM and EN test methods. Biodiesels and their blends have similar properties as diesel fuel and are favoured due to their lower exhaust emission.
Palm has been reported as the most productive plant among all biofuel feed stocks. At present more than 95% of the world's biofuel production is produced from edible oils.8,9 The world's total palm oil production is 45 million tonnes per year, and its maximum production is in Southeast Asia.5 However, producing biofuel from edible oil sources has received criticism from several non-governmental organisations worldwide.10 Therefore, using non-edible vegetable oils as biofuels, which are not suitable for human food, can replace the current dependence on edible oil sources. Calophyllum inophyllum can be trans-esterified and is a very promising non edible source of biofuel. The production of Calophyllum inophyllum is still in the nascent state compared to palm biodiesel production. Mustard oil is also a potential feedstock of biofuel. In most of the studies reviewed, it was found that low-quality seeds, which are unsuitable for food use, were adopted for fuel production.11 Canola or rapeseed has gained widespread acceptance as biodiesel feedstock and is from the same plant family of mustard. However, the advantage of mustard oil is that it contains a high amount of erucic acid, which makes it generally non edible (although mustard oil is used as a condiment). Hence, mustard oil is more suitable for industrial use, and unlike canola, using mustard as biodiesel feedstock would not interfere with the food supply.12 Therefore, mustard seems to be a more feasible feedstock for biodiesel production.13
This study was undertaken to investigate the possibilities and comparative evaluation of using palm, mustard and Calophyllum inophyllum biofuels in diesel engines. All three biodiesels were blended with diesel fuel in 10–90% biodiesel–diesel blends. Important physicochemical properties were measured for all of these blends and presented graphically to understand clearly the effects of blending, which indicated their potential as biodiesels for future research. However, as 10% and 20% blends for all three biodiesels showed fuel properties very close to that of diesel fuel, they were further used in measuring engine performance and emission and were compared with diesel fuel.
2. Methodology
2.1 Feedstock and chemicals
Palm and Calophyllum inophyllum oil were purchased from the Forest Research Institute of Malaysia (FRIM). FRIM usually collects their feedstock from local farms in Malaysia and Indonesia. Mustard oil extracted from low quality inedible seeds was purchased from local farms in Bangladesh. All the chemicals needed for transesterification were purchased from LGC Scientific, Kuala Lumpur, Malaysia.2.2 Production process of biodiesel
Crude oils were poured in a rotary evaporator and heated for 1 h at 95 °C under vacuum in order to eliminate moisture.To produce biodiesel from crude vegetable oil, transesterification was performed by two steps: (1) acid esterification and (2) base transesterification processes. Methanol was used as solvent with sulphuric acid (H2SO4) for acid esterification and potassium hydroxide (KOH) for base transesterification. Acid esterification is needed if the acid value of the crude oil is higher than 4 mg KOH per g. The acid value was calculated by performing titration. For Calophyllum oil, both steps were needed as its acid value was high, and for palm oil and mustard oil, only base transesterification was needed.
Using an acid catalyst, the first step reduced the free fatty acids (FFA) level of the crude vegetable oil up to 1–2%. A favorite jacket reactor of 1 litre capacity was used with an IKA Eurostar digital model stirrer and Wiscircu water bath arrangement. One litre of crude vegetable oil with 200 ml methanol and 0.5% v/v sulphuric acid were added in the flask for acid catalysed esterification. The mixture was constantly stirred at 700 rpm, and a temperature range of 50–60 °C was maintained at atmospheric pressure by circulating hot water through the jacket. To determine the FFA level, 5 ml sample was taken from the flask at an interval of 10 minutes, and the esterification process was carried out until the FFA level was reduced up to 1–2%. After completing the acid esterification process, the product was poured into a separating funnel, where sulphuric acid and excess alcohol with impurities were moved to the top. The top layer was separated and lower layer was collected for base transesterification.
The same experimental setup was used for the alkaline catalysed transesterification process. Moreover, 1% w/w of KOH (base catalyst) dissolved in 25% v/v of methanol was poured into the glass reactor. Then, the mixture was stirred at the same speed and the temperature was maintained at 70 °C. The mixture was heated and stirred for 3 h and again poured into a separating funnel, where it formed two layers. The lower layer contained glycerol and impurities and upper layer contained methyl ester of the vegetable oil. The lower layer was discarded and yellow upper layer was washed with hot distilled water (100% v/v) and stirred gently to remove remaining impurities and glycerol. The biodiesel was then placed in a IKA RV10 rotary evaporator to reduce the moisture content. Finally, moisture was absorbed by using sodium sulphate and the final product was collected after filtration.
2.3 Characterization of fuel properties
The quality of the oil is expressed in terms of the fuel properties such as viscosity, density, calorific value, flash point, pour point and cloud point. The important physical and chemical properties of the crude oils and their methyl esters were tested according to the ASTM D6751 standard.2.4 Biodiesel blending
Each test fuel blend was prepared prior to the property test and engine test. Each test fuel blend was stirred at 2000 rpm for 20 minutes in a homogenizer device. The homogenizer was fixed onto a vertical stand by a clamp, which allows its height to be changed. The engine test was carried out using 7 fuel samples, including diesel fuel and 10% and 20% blends of each feedstock. These blends were chosen based on reports by the researchers, which mentioned that up to 20% of biodiesel blend could be used in a diesel engine without any modification.8 The blend compositions of all of the fuel samples are given in Table 1.| No. | Fuel samples | Samples description |
|---|---|---|
| 01 | Diesel | 100% diesel fuel |
| 02 | PB10 | 10% palm biodiesel + 90% diesel fuel |
| 03 | PB20 | 20% palm biodiesel + 80% diesel fuel |
| 04 | CB10 | 10% Calophyllym biodiesel + 90% diesel fuel |
| 05 | CB20 | 20% Calophyllym biodiesel + 80% diesel fuel |
| 06 | MB10 | 10% mustard biodiesel + 90% diesel fuel |
| 07 | MB20 | 20% mustard biodiesel + 80% diesel fuel |
2.5 Engine test
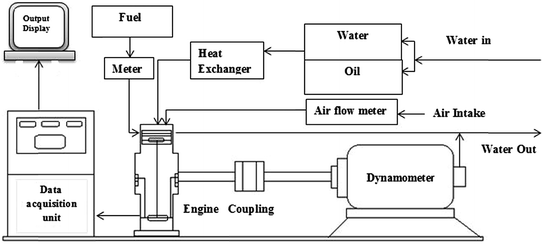
A 4-cylinder diesel engine was used in this experiment; its specifications are summarized in Table 2. A schematic diagram of the engine test bed is shown in Fig. 1. At first, the engine was warmed up for 5 minutes so that fluctuation of emissions can be avoided. Tests were carried out at different engine speeds ranging from 1000 to 4000 rpm and at full load condition. For the engine performance and exhaust emission tests, every fuel sample was tested three times and their average results are reported in this study. The engine was connected with a test bed and a computer data acquisition system. Therefore, the test bed was connected to the data acquisition board, which collects the signal, rectifies, filters and converts the signal into the data to be read. The data acquisition board was connected to the laptop, where the user could monitor, control and analyze the data using software through the REO-DCA controller. All the performance data were measured in step rpm test mode. At every 500 rpm increment, the engine was stabilized for 20 seconds and data was acquired for the next 20 seconds.| Engine type | 4 cylinder inline |
| Displacement | 2.5 L (2476 cm3) |
| Bore | 91.1 mm |
| Stroke | 95.0 mm |
| Torque | 132 N m, at 2000 rpm |
| Maximum engine speed | 4200 rpm |
| Compression ratio | 21![[thin space (1/6-em)]](https://www.rsc.org/images/entities/char_2009.gif) : :![[thin space (1/6-em)]](https://www.rsc.org/images/entities/char_2009.gif) 1 1 |
| Cooling system | Water cooled |
| Combustion chamber | Swirl type |
| Lubrication system | Pressure feed |
2.6 Apparatus for engine emission studies
A BOSCH exhaust gas analyzer (model BEA-350) was used to measure the exhaust emissions of NO and HC in ppm and CO in volume percent. The details of the gas analyzer are shown in Table 3. In this research work exhaust emission was measured at various speeds ranging from 1000 rpm to 4000 rpm at an interval of 500 rpm at full load conditions by inserting the probe into the tailpipe.| Equipment name | Model | Measuring element | Measuring method | Upper limit | Accuracy |
|---|---|---|---|---|---|
| BOSCH gas analyser | BEA-350 | CO | Non-dispersive infrared | 10.00 vol% | ±0.02 vol% |
| HC | Flame ionization detector | 9999 ppm | ±1 ppm | ||
| NO | Heated vacuum type chemiluminescence detector | 5000 ppm | ±1 ppm |
3. Results and discussion
3.1 Characterization of palm, mustard and Calophyllum inophyllum oil
Biodiesel production process selection and duration depend on the physicochemical properties of the feedstock. The acid value, FFA, density and kinematic viscosity influence the production steps and also the extra processing steps such as filtration, heating, centrifuging and drying. Table 4 shows the measured physicochemical properties of the crude vegetable oil feedstocks used to produce the biodiesels.| Properties | Units | Standards | Palm oil | Mustard oil | Calophyllum inophyllum oil |
|---|---|---|---|---|---|
| Acid value | mg KOH per g oil | ASTM D664 | 3.47 | 3.64 | 10.72 |
| Kinematic viscosity at 40 °C | mm2 s−1 | ASTM D445 | 38.10 | 45.52 | 48.82 |
| Density at 15 °C | kg m−3 | ASTM D4052 | 890 | 898 | 921 |
| Flash point | °C | ASTM D93 | 174.5 | 212.5 | 217.5 |
| Pour point | °C | ASTM D97 | 5 | −14 | −3 |
| Cloud point | °C | ASTM D2500 | 17 | −13 | −2 |
| Calorific value | MJ kg−1 | ASTM D240 | 39.4 | 40.10 | 38.4 |
| Oxidation stability | h | EN ISO 14112 | 3.42 | 11.30 | 2.72 |
From Table 4, it can be seen that Calophyllum inophyllum oil showed the highest kinematic viscosity and density values, followed by mustard oil and palm oil. Due to these high values of viscosity and density, the crude oils cannot be used in the diesel engine directly or without any modification. High viscosity negatively affects the volume flow and spray characteristics in the injection manifold, as well as leads to blockage and gum formation. Therefore, it is suggested that the vegetable oils should be converted to biodiesel to reduce viscosity and density before using them in diesel engines.
The flash point results showed that Calophyllum inophyllum oil possesses the highest flash point, followed by mustard and palm oil. All of these crude vegetable oils have very high flash points (>160 °C), which confirm that these feedstock are safe for storage, transportation and handling. Mustard oil showed the lowest cloud point and pour point among all of the tested feedstocks. By analyzing the cloud point and pour point result, it can be concluded that mustard oil possesses better cold flow properties than palm and Calophyllum inophyllum. Calorific value is an important fuel selection parameter. Again, mustard oil was found to be superior to the other two biodiesel feedstocks, considering its highest calorific value, followed by that of palm and then Calophyllum inophyllum oil. Oxidation stability results showed that mustard oil has the highest oxidation stability, followed by palm and then Calophyllum inophyllum feedstock. Thus, it would not get easily oxidized during storage and transportation.
3.2 Characterization of produced biodiesels and their blends
Physicochemical properties of the biodiesels show variations depending upon the feedstock quality, chemical composition, production process, storage and handling process. Measured physicochemical properties of the produced biodiesels are shown in Table 5. The kinematic viscosity, density, calorific value, oxidation stability and flash point of 10–90% biodiesel–diesel blends of the produced biodiesels were also measured and shown in Table 6.| Properties | Units | Standards | ASTM D6751 | Mustard biodiesel | Palm biodiesel | Calophyllum biodiesel | Diesel |
|---|---|---|---|---|---|---|---|
| Kinematic viscosity at 40 °C | mm2 s−1 | ASTM D445 | 1.9–6 | 4.967 | 4.723 | 4.017 | 3.0699 |
| Density at 15 °C | kg m−3 | ASTM D1298 | 860–900 | 864.8 | 862.2 | 859.2 | 821 |
| Flash point | °C | ASTM D93 | >130 | 149.5 | 182.5 | 172.5 | 72.5 |
| Cloud point | °C | ASTM D2500 | — | 5 | 6 | 16 | −8 |
| Pour point | °C | ASTM D97 | — | −18 | 3 | 15 | −6 |
| Calorific value | MJ kg−1 | ASTM D240 | — | 40.41 | 39.79 | 39.91 | 45.27 |
| Oxidation stability | h | EN ISO 14112 | 3 | 15.92 | 3.92 | 3.18 | — |
| Cetane number | — | ASTM D613 | 47 min | 76 | 51 | 59 | 48 |
| Properties | Units | Biodiesel | Biodiesel–diesel blend% | ||||||||
|---|---|---|---|---|---|---|---|---|---|---|---|
| 10 | 20 | 30 | 40 | 50 | 60 | 70 | 80 | 90 | |||
| Kinematic viscosity at 40 °C | mm2 s−1 | Mustard | 3.4761 | 3.67 | 3.77 | 3.9823 | 4.2896 | 4.5676 | 4.8717 | 5.2231 | 5.4672 |
| Palm | 3.37 | 3.47 | 3.62 | 3.73 | 4.01 | 4.21 | 4.37 | 4.51 | 4.63 | ||
| Calophyllum | 3.1 | 3.27 | 3.35 | 3.46 | 3.55 | 3.65 | 3.75 | 3.85 | 3.95 | ||
| Calorific value | MJ kg−1 | Mustard | 44.886 | 44.486 | 43.983 | 43.445 | 42.892 | 42.455 | 41.86 | 41.467 | 41.085 |
| Palm | 43.8 | 43.6 | 43.5 | 42.7 | 42.2 | 41.7 | 41.2 | 40.8 | 40.1 | ||
| Calophyllum | 44.33 | 44.12 | 43.8 | 42.9 | 42.5 | 41.9 | 41.5 | 41 | 40.3 | ||
| Flash point | °C | Mustard | 77.5 | 80.5 | 83.5 | 89.5 | 92.5 | 110.5 | 126.5 | 138.5 | 142.5 |
| Palm | 87.5 | 95.5 | 105.5 | 120.5 | 128.5 | 146.5 | 168.5 | 174.5 | 178.5 | ||
| Calophyllum | 82.5 | 90.5 | 100.5 | 110.5 | 122.5 | 140.5 | 160.5 | 164.5 | 168.5 | ||
| Density at 15 °C | kg m−3 | Mustard | 824.2 | 827.3 | 835.6 | 842.2 | 845.5 | 847.9 | 852.6 | 856.5 | 859.2 |
| Palm | 823.1 | 826.8 | 831.2 | 839.6 | 843.2 | 845.5 | 849.3 | 852.2 | 856.4 | ||
| Calophyllum | 822.4 | 824.2 | 830.2 | 837.1 | 842.1 | 844.5 | 847.2 | 850.3 | 854.2 | ||
| Oxidation stability | h | Mustard | 69.66 | 50.23 | 44.98 | 40.56 | 35.06 | 30.96 | 22.23 | 20.79 | 18.72 |
| Palm | 58.2 | 31.5 | 18.75 | 13.84 | 9.74 | 7.82 | 5.55 | 4.55 | 4.1 | ||
| Calophyllum | 40.2 | 29.2 | 17.35 | 12.88 | 8.74 | 6.82 | 4.98 | 4.12 | 3.8 | ||
All the tested biodiesels showed higher kinematic viscosity and density values compared to diesel fuel. In percentage, the kinematic viscosity of PB, MB and CB were found to be 87%, 53% and 30% higher than that of diesel fuel, respectively. In contrast, density values of PB, MB and CB were found to be 5%, 5.5% and 4% higher than that of diesel fuel, respectively. CB showed lower density and viscosity than PB and MB. Thus, CB showed superior quality as a biodiesel over PB and MB considering its kinematic viscosity and density. Thus, using CB would be more economical, as it might cause lower fuel consumption than PB and MB. However, kinematic viscosity and density values for produced biodiesels remained within the ASTM specification for biodiesel standard. From Table 6, the kinematic viscosities of the biodiesel blends varied from 3.47 mm2 s−1 to 5.46 mm2 s−1, 3.10 mm2 s−1 to 3.95 mm2 s−1 and 3.37 mm2 s−1 to 4.63 mm2 s−1 for the 10–90% mustard, Calophyllum and palm biodiesel–diesel blends, respectively. From Table 6, the densities of the biodiesel blends varied from 824.2 kg m−3 to 859.2 kg m−3, 822.4 kg m−3 to 854.2 kg m−3 and 823.1 kg m−3 to 856.4 kg m−3 for the 10–90% mustard, Calophyllum and palm biodiesel–diesel blends, respectively. However, all the biodiesel blends meet the ASTM standard for biodiesel viscosity and density range.
PB showed the highest flash point among all the tested fuels. Thus, it provides an advantage for storage, transport and handling compared to MB, CB or diesel fuel. In percentage, flash point values of PB, MB and CB were found to be 152%, 96% and 137% higher than that of diesel fuel, respectively. Lower volatility of biodiesel than diesel fuel might be a reason behind the higher flash point value. Flash point values for all the biodiesels were found within the ASTM specification for biodiesel standard. From Table 6, the flash points of the biodiesels varied from 77.5 °C to 149.5 °C, 82.5 °C to 172.5 °C and 87.5 °C to 182.5 °C for the 10–90% mustard, Calophyllum and palm biodiesel–diesel blends, respectively.
MB showed promising cold flow properties superior to the other tested biodiesels. The cloud point and pour point of MB was found to be considerably lower than those of PB and CB. Thus MB can be used in cold climates, where PB or CB might suffer from freezing. However, diesel fuel was found to still be better than all the biodiesels, considering its current use in cold climates.
In percentage, the calorific values of PB, MB and CB were found to be 11.5%, 10% and 11.3% lower, respectively, than that of diesel fuel. As biodiesels are oxygenated fuels and contain less carbon than diesel, a decrease in calorific value is evident. The calorific value of MB was found as 40.41 MJ kg−1. It might be considered a unique finding for MB, as this value is higher than most of the conventional biodiesels found in the market. Thus MB would provide advantages over CB and PB considering the calorific value. From Table 6, the calorific value of the biodiesel blends varied from 44.88 MJ kg−1 to 41.08 MJ kg−1, 44.33 MJ kg−1 to 40.30 MJ kg−1 and 43.80 MJ kg−1 to 40.10 MJ kg−1 for the 10–90% mustard, Calophyllum and palm biodiesel–diesel blends, respectively.
As biodiesels are oxygenated fuels, oxidation stability is very important during long time storage. Oxidation stability results showed that MB possessed the highest oxidation stability, followed by PB and then CB. Thus MB provides advantages over PB and CB considering storage capability. Oxidation stability depends on the respective fatty acid composition of biodiesels. From Table 6, the oxidation stability of the biodiesel blends varied from 69.66 h to 15.92 h, 40.2 h to 3.18 h and 58.2 h to 4.1 h for the 10–90% mustard, Calophyllum and palm biodiesel–diesel blends, respectively. All the biodiesel blends meet the EN ISO 14112 standard for biodiesel oxidation stability range.
Cetane numbers of PB, MB and CB were found to be 6%, 58%, and 22% higher than that of diesel fuel, respectively. In addition, MB showed the highest iodine value and CB showed the highest saponification number among the three tested biodiesels. As the cetane number, iodine value and saponification number were calculated from the fatty acid composition of the respective biodiesels, and these values are completely dependent on their chemical compositions. On the contrast, PB showed the lowest acid value, followed by MB and then CB. Thus, PB might cause less corrosion to the engine than MB or CB.
3.3 Prediction of blend properties
In this study, calorific value, oxidation stability, density and flash point are plotted against kinematic viscosity (Fig. 2). Mathematical equations are formed using polynomial regression analysis, and the equations are shown in Table 7. The calorific value, oxidation stability, density and flash point can be easily calculated by these equations if the kinematic viscosity is known.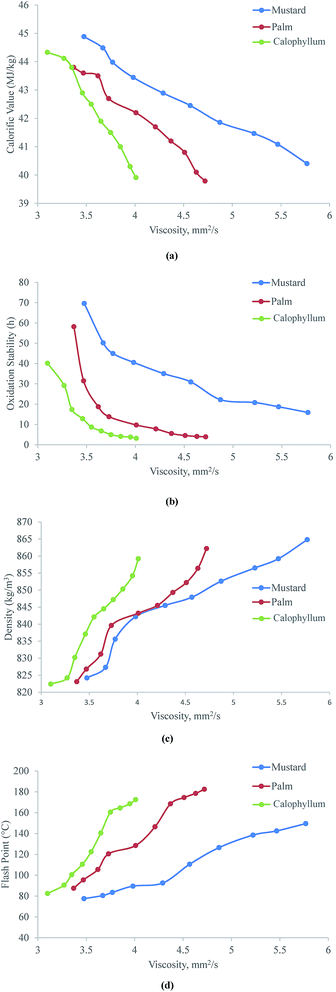 | ||
| Fig. 2 (a) Calorific value, (b) oxidation stability, (c) density and (d) flash point vs. viscosity for mustard, palm and Calophyllum biodiesel–diesel blends. | ||
| Propertsy | Biodiesel blends | Mathematical equation | R2 | Variable, x | B20 | B60 | ||||
|---|---|---|---|---|---|---|---|---|---|---|
| Exp value | Cal. value | Variation% | Exp value | Cal. value | Variation% | |||||
| Calorific value vs. kinematic viscosity at 40 °C | Mustard-diesel | y = −0.3442x3 + 5.0526x2 − 26.167x + 89.319 | 0.9974 | Kinematic viscosity at 40 °C | 44.486 | 44.3249 | 0.3621 | 42.455 | 42.41076 | 0.104 |
| Palm-diesel | y = −0.8766x3 + 9.9172x2 − 39.829x + 99.013 | 0.9911 | 43.6 | 43.59 | 0.02294 | 41.7 | 41.6958 | 0.01007 | ||
| Calophyllum-diesel | y = 4.4309x3 − 49.011x2 + 174.71x − 158.18 | 0.9927 | 44.12 | 43.98 | 0.31732 | 41.9 | 42.024 | 0.2959 | ||
| Oxidation stability vs. kinematic viscosity at 40 °C | Mustard-diesel | y = −8.2615x3 + 124.66x2 − 634.2x + 1110.7 | 0.9704 | 50.23 | 53.8459 | 7.1986 | 30.96 | 27.43698 | 11.379 | |
| Palm-diesel | y = −83.598x3 + 1062.5x2 − 4492.1x + 6325.1 | 0.9616 | 31.5 | 38.08 | 20.889 | 7.82 | 7.26 | 7.16113 | ||
| Calophyllum-diesel | y = −22.791x3 + 306x2 − 1347.9x + 1957.8 | 0.9837 | 29.2 | 25.2892 | 13.393 | 6.82 | 6.389 | 6.31965 | ||
| Density vs. kinematic viscosity at 40 °C | Mustard-diesel | y = 5.9627x3 − 87.141x2 + 433.8x + 117.79 | 0.9855 | 827.3 | 830.8839 | 0.43 | 847.9 | 849.402 | 0.177 | |
| Palm-diesel | y = 30.596x3 − 374.72x2 + 1544.9x − 1299.5 | 0.989 | 826.8 | 827.697 | 0.1084 | 845.5 | 845.981 | 0.0568 | ||
| Calophyllum-diesel | y = −20.447x3 + 215.3x2 − 711.45x + 1566.7 | 0.978 | 824.2 | 826.446 | 0.2724 | 844.5 | 842.504 | 0.23634 | ||
| Flash point vs. kinematic viscosity at 40 °C | Mustard-diesel | y = −11.068x3 + 154.41x2 − 672.99x + 1017.3 | 0.992 | 80.5 | 80.0587 | 0.548 | 110.5 | 110.09 | 0.371 | |
| Palm-diesel | y = −15.43x3 + 183.91x2 − 652.9x + 791.11 | 0.9865 | 95.5 | 95.2938 | 0.21587 | 146.5 | 150.677 | 2.8512 | ||
| Calophyllum-diesel | y = −276.65x3 + 2952.6x2 − 10![[thin space (1/6-em)]](https://www.rsc.org/images/entities/char_2009.gif) 350x + 12 350x + 12![[thin space (1/6-em)]](https://www.rsc.org/images/entities/char_2009.gif) 035 035 |
0.9938 | 90.5 | 89.0727 | 1.57716 | 140.5 | 140.819 | 0.2273 | ||
Polynomial regression is a form of linear regression, in which the relationship between the independent variable x and the dependent variable y is modelled as an nth degree polynomial. Polynomial regression models are usually fit using the method of least squares. The least-squares method minimizes the variance of the unbiased estimators of the coefficients, under the conditions of the Gauss–Markov theorem.
Polymath can fit a polynomial of degree n with the general form:
| P(x) = a0 + a1x + a2x2 + … + anxn | (1) |
The equation developed using the polynomial curve fitting method for various biodiesel blend percentages are validated with the experimental data shown in Table 7. The variation of data is calculated using eqn (2).
 | (2) |
For 20% blends, the calorific value, density and flash point variation were found as 0.36%, 0.27%, and 1.58% maximum, respectively, when the equation was used to derive the value. However, variation for oxidation stability value was as high as 20.89%.
3.4 Performance analysis
3.5 Emission analysis
4. Conclusion
In this study, biodiesels were produced from palm, mustard and Calophyllum oil. Then, chief physicochemical properties were measured and these measurement equations were evaluated in order to predict the key properties when only the viscosity of the biodiesel is known. Then, a compression ignition engine was operated using 10% or 20% palm, mustard or Calophyllum biodiesel–diesel blends at speeds ranging from 1000 rpm to 4000 rpm. Engine performance and emission parameters were evaluated. The following conclusions are drawn based on this experimental investigation:(1) The physicochemical properties of all the produced biodiesel blends were within the specified limit.
(2) By applying the curve-fitting method, equations were developed for predicting important properties, which show very close fits to the experimental data. This will help future research, such as the optimization of blending percentage, engine combustion and performance and emission analysis. Calorific value, density and flash point variation was found as 0.3621%, 0.2724%, and 2.8512% maximum, respectively, when the equation was use to derive the value. However, variation for oxidation stability value was as high as 20.889%.
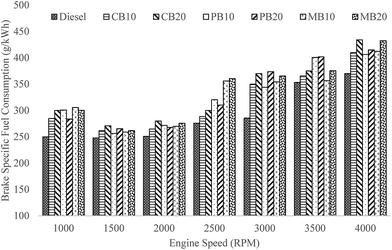
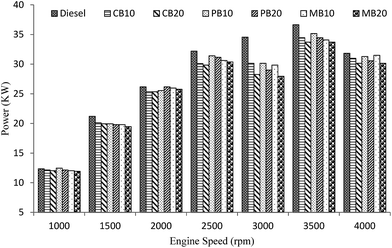
(3) An average of 7–11%, 9–12%, and 6–10% BSFC increments were observed for the addition of 10% and 20% biodiesel of palm, mustard and Calophyllum, respectively. The palm blends provided an average of 14.4% lower BSFC values compared to Jatropha blends. The brake power was decreased on average by 4.1–5.8%, 6.9–8.0% and 5.8–7.7% for 10% and 20% blends of palm, mustard and Calophyllum biodiesel, respectively. Therefore, Calophyllum biodiesel showed better engine performance compared to palm or mustard biodiesel blends.
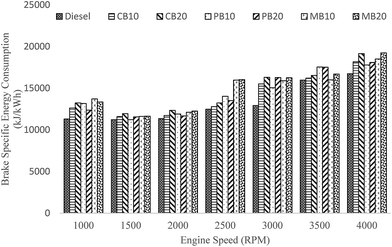
(4) BSEC values of pure diesel fuel at all tested speeds were lower compared to those of the biodiesel blends. Biodiesel blends exhibited higher BSEC.
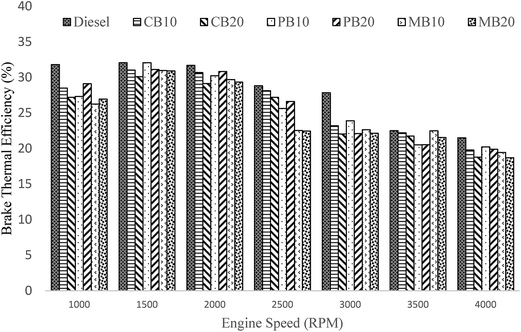
(5) The BTE was highest for diesel fuel at all speeds. The average reduction of BTE for CB10, CB20, PB10, PB20, MB10 and MB20 were 6.5%, 10.1%, 8.3%, 8.2%, 11.3% and 12.3%, respectively.
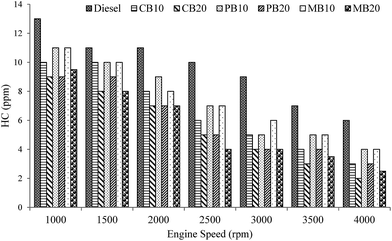
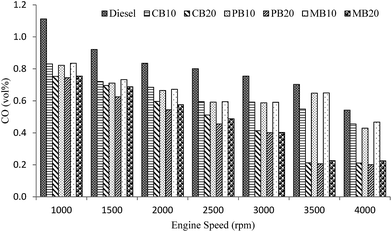
(6) PB10 and PB20 produced an average of 45.4% and 63.6% lower CO emission than the diesel fuel, respectively. An average of 48.0% and 64.8% CO emission reductions were observed for MB10 and MB20, respectively. In contrast, CB10 and CB20 produced 48.5% and 68.3% lower CO emission, respectively. Similarly, PB10 and PB20 produced an average of 23% and 38% lower HC emission than the diesel fuel, respectively. An average of 24% and 42% HC emission reductions were observed for MB10 and MB20, respectively. In contrast, CB10 and CB20 produced 31% and 43% lower HC emission, respectively. At higher engine speeds, these emissions were considerably lower.
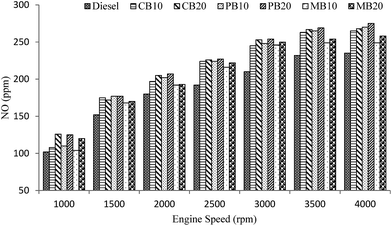
(7) The NO emission was increased by 14% and 17% for PB10 and PB20, respectively. On the contrary, MB10 and MB20 produced 9% and 12% higher NO emission, whereas CB10 and CB20 produced 13% and 16% higher NO emission than diesel fuel respectively.
Acknowledgements
The authors would like to acknowledge the University of Malaya for financial support through High Impact Research Grant entitles: Clean Diesel Technology for Military and Civilian Transport Vehicles which Grant number is UM.C/HIR/MOHE/ENG/07.References
- N. A. Owen, O. R. Inderwildi and D. A. King, Energy Policy, 2010, 38, 4743–4749 CrossRef PubMed.
- M. J. Abedin, H. H. Masjuki, M. A. Kalam, A. Sanjid, S. M. A. Rahman and I. M. R. Fattah, Ind. Crops Prod., 2014, 59, 96–104 CrossRef CAS PubMed.
- E. Modiba, P. Osifo and H. Rutto, Ind. Crops Prod., 2014, 59, 50–54 CrossRef CAS PubMed.
- M. Mofijur, H. H. Masjuki, M. A. Kalam, A. E. Atabani, I. M. R. Fattah and H. M. Mobarak, Ind. Crops Prod., 2014, 53, 78–84 CrossRef CAS PubMed.
- A. Sanjid, H. H. Masjuki, M. A. Kalam, S. M. A. Rahman, M. J. Abedin and S. M. Palash, Renewable Sustainable Energy Rev., 2013, 27, 664–682 CrossRef CAS PubMed.
- International Energy Agency (IEA), 2011.
- R. A. Holser, Ind. Crops Prod., 2008, 27, 130–132 CrossRef CAS PubMed.
- A. Sanjid, H. H. Masjuki, M. A. Kalam, S. M. A. Rahman, M. J. Abedin and S. M. Palash, J. Cleaner Prod., 2014, 65, 295–303 CrossRef CAS PubMed.
- S. Ahmed, M. H. Hassan, M. A. Kalam, S. M. Ashrafur Rahman, M. J. Abedin and A. Shahir, J. Cleaner Prod., 2014, 79, 74–81 CrossRef CAS PubMed.
- K. Tan, K. Lee and A. Mohamed, Energy, 2011, 36, 2085–2088 CrossRef CAS PubMed.
- S. A. Niemi, T. T. Murtonen, M. J. Laurén and V. O. K. Laiho, SAE Tech. Pap., 2002, 2002-01-0866, DOI:10.4271/2002-01-0866.
- V. D. Zheljazkov, B. Vick, M. W. Ebelhar, N. Buehring and T. Astatkie, Ind. Crops Prod., 2012, 36, 28–32 CrossRef CAS PubMed.
- S. A. Niemi, P. Illikainen, M. Makinen and V. Laiho, SAE Tech. Pap., 1997, 970219 Search PubMed.
- D. H. Qi, C. F. Lee, C. C. Jia, P. P. Wang and S. T. Wu, Energy Convers. Manage., 2014, 77, 227–232 CrossRef CAS PubMed.
- M. Shahabuddin, H. H. Masjuki, M. A. Kalam, M. Mofijur, M. A. Hazrat and A. M. Liaquat, Energy Procedia, 2012, 14, 1624–1629 CrossRef PubMed.
- M. Mofijur, H. H. Masjuki, M. A. Kalam and A. E. Atabani, Energy, 2013, 55, 879–887 CrossRef CAS PubMed.
- Y. C. Lin, W. J. Lee and H. C. Hou, Atmos. Environ., 2006, 40, 3930–3940 CrossRef CAS PubMed.
- T. Leevijit and G. Prateepchaikul, Fuel, 2011, 90, 1487–1491 CrossRef CAS PubMed.
- M. Bannikov, Combustion and emission characteristics of mustard biodiesel, 2011 Search PubMed.
- M. A. Kalam, H. H. Masjuki, M. H. Jayed and A. M. Liaquat, Energy, 2011, 36, 397–402 CrossRef CAS PubMed.
- S. M. Palash, M. A. Kalam, H. H. Masjuki, M. I. Arbab, B. M. Masum and A. Sanjid, Energy Convers. Manage., 2014, 77, 577–585 CrossRef CAS PubMed.
- S. M. A. Rahman, H. H. Masjuki, M. A. Kalam, M. J. Abedin, A. Sanjid and H. Sajjad, Energy Convers. Manage., 2013, 76, 362–367 CrossRef CAS PubMed.
- M. El-Kasaby and M. A. Nemit-allah, Alexandria Eng. J., 2013, 52, 141–149 CrossRef PubMed.
- S. M. Palash, M. A. Kalam, H. H. Masjuki, B. M. Masum, I. M. Rizwanul Fattah and M. Mofijur, Renewable Sustainable Energy Rev., 2013, 23, 473–490 CrossRef CAS PubMed.
- S. A. Niemi, T.T. Hätönen and V. O. K. Laiho, SAE Tech. Pap., 1998, 982528, DOI:10.4271/982528.
- Y. Ulusoy, Y. Tekin, M. Cetinkaya and F. Karaosmanoglu, Energy Sources, 2004, 26, 927–932 CrossRef CAS.
- A. N. Ozsezen and M. Canakci, Biomass Bioenergy, 2010, 34, 1870–1878 CrossRef CAS PubMed.
- M. Gumus, C. Sayin and M. Canakci, Fuel, 2012, 95, 486–494 CrossRef CAS PubMed.
| This journal is © The Royal Society of Chemistry 2015 |

