Green synthesis of zinc oxysulfide quantum dots using aegle marmelos fruit extract and their cytotoxicity in HeLa cells
Kalavakunta Venkata Pavan Kumara,
Oriparambil Sivaraman Nirmal Ghosha,
G. Balakrishnanb,
P. Thirugnanasambanthamc,
Santhosh Kumar Raghavand and
Annamraju Kasi Viswanath*a
aNanophotonics and Nanoelectronics Research Laboratory, Centre for Nanoscience and Technology, Madanjeet School of Green Energy Technologies, Pondicherry University, Kalapet, Puducherry, India – 605014. E-mail: nnrlcnstpu@gmail.com
bResearch Centre for Advanced Materials, Department of Mechanical Engineering, Bharath University, Chennai, Tamilnadu, India – 600073
cRohini Global Holistic Health Care, 327, 4th Cross Street, Mohan Ram Nagar, Mugappair East, Chennai, Tamilnadu, India – 600037
dNano-X Research Laboratory, Mullassery P.O., Thrissur, Kerala, India – 680509
First published on 29th January 2015
Abstract
Zinc oxysulfide quantum dots have been attracting increasing research interest due to their tunable electronic, optical and magnetic properties. In this paper we report the green synthesis of zinc oxysulfide quantum dots in the range of a few nanometers using aegle marmelos fruit extract through a facile precipitation route. The zinc oxysulfide quantum dots (ZOS QDs) were characterized by X-ray diffraction, ultra violet-visible absorbance spectroscopy, photoluminescence spectroscopy, energy dispersive X-ray spectroscopy, transmission electron microscopy, and vibrating sample magnetometry. Energy dispersive X-ray spectroscopy of the synthesized samples indicates that 16% oxygen is incorporated into the zinc sulfide crystal lattice that results in an optical band-gap transformation from direct type for the zinc sulfide cubic phase to a decreased bandgap of 3.46 eV. The vibrating sample magnetometer analysis results showed the existence of room temperature ferromagnetism (RTF) in zinc oxysulfide quantum dots. The bandgap engineering approach adopted in this work to tailor the optical and electronic properties of zinc sulfide with the RTF magnetic properties of zinc oxide will have a significant impact on the development of ternary chalcogenides for magnetic and photonic applications. The prepared ZOS QDs exhibit good cell viability with HeLa cells and the toxicity results obtained from this research work provide a new direction for the development of nontoxic bandgap engineered ZOS based QDs for biological applications. To the best of our knowledge, this is the first report on the biocompatibility of novel ZOS QDs in HeLa cells.
1. Introduction
Recent developments in nanoscience and nanotechnology have reinforced the scientific routes of various disciplines like photonics, electronics, biotechnology, and several other fields of applied science.1–7 Advancements in the synthesis of innovative nanomaterials provides exclusive opportunities to fine tune physico-chemical characteristics of materials beyond their conventional limits. Zinc oxide (ZnO) based systems are found to have huge potential in photonics applications due to their wide bandgap of 3.37 eV and large exciton binding energy of 60 meV.8 Zinc oxide is also identified as a potential candidate for dilute magnetic semiconductor (DMS) devices. Solution processed chalcogenide quantum dots are of particular interest due to their wide range of applications in electronics, optoelectronics, nanobiotechnology, solar energy extraction, device engineering and development of nonlinear optical materials.9In comparison with ZnO bulk zinc sulfide (ZnS) also has a wide bandgap of 3.7 eV and exciton binding energy of 40 meV. ZnS is a well-established luminescent material for wide range of applications in development of nanophosphors, photocatalysts, sensors and biolabels.10,11 Current scenarios of advanced developments in DMS demands a bandgap engineering approach to tailor these attractive luminescent and optical properties with the room temperature ferromagnetic (RTF) properties to fabricate various types of magneto-optic devices.12
Efforts are on size controlled synthesis of nontoxic zinc oxysulfide (ZOS) quantum dots (QDs), since the size of QD is a critical factor that influences the electronic, optical and magnetic properties and cytotoxicity of the nanomaterials.13,14 Solution synthesis of ternary chalcogenide QDs usually carried out using the non-ecofriendly, toxic and volatile solvents and organic surfactants.15 Currently a wide range of natural extracts and biological agents are suggested as alternatives for nanomaterial synthesis.16 The aegle marmelos fruit (AMF) extract serves the purpose of controlling the size of QDs by acting as a surfactant. The AMF reduces the solvated zinc ion formed during the addition of zinc sulphate into the aqueous solution of AMF. The AMF directly competes with sulphur to react with Zn2+ ions and there by inhibits sulphate formation during the synthesis process. Due to the zinc ion scavenging activity of the AMF, it facilitates the formation of zinc oxysulfide during the synthesis process.
Aqueous solution of AMF consists of various components with functional ligands including carbohydrates, glycosides, proteins, amino acids, phytosterols, saponins, flavonoids, alkaloids and tannins. The biopolymer pectin and the hydrophobic B-sitosterol present in the AMF acts as a biopolymer to cap the quantum dots during the synthesis process and provides functional modalities and biocompatibility to the prepared ZOS quantum dots. Due to the presence of D-galacturonic acid pectin provides carbonyl and hydroxyl ligands over the synthesized ZOS QDs, which is not achievable in synthesis of QDs using normally employed surfactants. The AMF also contains large group of organic functional moieties including psoralen, marmelide, imperatorin, marmelosin, amyrin and marmesin. These ligands can easily form coordination complex with the ZOS QDs and biological macromolecules. The natural polymers contained in AMF extract cap the zinc ions produced during the solvation process and restrict the vigorous combination with sulfur anions thus provides a controlled formation of ZnS QDs with desirable average size of 3.5 nm.17 In this regard our present study demonstrates the synthesis of biocompatible ZOS QDs using ecofriendly, nontoxic and non-volatile AMF extract as a surfactant.
2. Experimental
2.1 Materials and methods
Zinc sulfate heptahydrate (ZnSO4·7H2O, 99.98%) and sodium sulfide (Na2S·XH2O, 99.9%) were purchased from Sigma Aldrich and were used as precursors of zinc and sulfur ions. AMF extract was purchased from Rumi herbals was used as surfactant as well as reducing agent to synthesize size controlled and stabilized ZOS quantum dots. All the chemicals were used without any further purification.2.2 Synthesis procedure
In a typical synthesis procedure 0.4 M of ZnSO4 solution was added to 100 ml of AMF extract under continuous stirring for 15 minutes. The 0.4 M Na2S solution was added to the above mixture under stirring for 20 minutes to get the ZOS precipitate. The obtained precipitate was centrifuged and washed several times with deionized water and dried at 120 °C for 4 h in the presence of oxygen.2.3 In vitro viability of ZOS quantum dots
The HeLa cell line was obtained from National Centre for Cell Science (NCCS), Pune and grown in Eagles Minimum Essential Medium containing 10% fetal bovine serum (FBS). The cells were maintained at 37 °C, 5% CO2, 95% air and 100% relative humidity. In order to make the single cell suspension the monolayer cells were detached with trypsin–ethylene-diamine tetra-acetic acid (EDTA) and the viable cells were counted using a hemocytometer and diluted with medium containing 5% FBS to give final density of 1 × 10⁵ cells per ml. One hundred microliters per well of cell suspension were seeded into 96-well plates at plating density of 10![[thin space (1/6-em)]](https://www.rsc.org/images/entities/char_2009.gif) 000 cells per well and incubated to allow for cell attachment at 37 °C, 5% CO2, 95% air and 100% relative humidity. After 24 h the cells were treated with serial concentrations of the test samples. They were initially dissolved in phosphate buffered saline (PBS) and an aliquot of the sample solution was diluted to twice the desired final maximum test concentration with serum free medium. Four Additional two fold serial dilutions were made to provide a total of five sample concentrations. Aliquots of 100 μl of these different sample dilutions were added to the appropriate wells already containing 100 μl of medium, so as to obtain the required final sample concentrations. Following sample addition, the plates were incubated for an additional 48 h at 37 °C, 5% CO2, 95% air and 100% relative humidity. The medium without samples were served as control and triplicate was maintained for all concentrations. The prepared samples were incubated for 48 h and after that 15 μl of 3-[4,5-dimethylthiazol-2-yl]2,5-diphenyltetrazolium bromide (MTT-5 mg ml−1) in phosphate buffered saline (PBS) was added to each well and was incubated at 37 °C for 4 h. The medium with MTT was then flicked off and the resultant formazan crystals were dissolved in 100 μl of DMSO and the subsequent absorbance value was measured using (570 nm) micro plate reader. With respect to the control the percentage cell viability was calculated as % cell viability = [A]test/[A]control × 100
000 cells per well and incubated to allow for cell attachment at 37 °C, 5% CO2, 95% air and 100% relative humidity. After 24 h the cells were treated with serial concentrations of the test samples. They were initially dissolved in phosphate buffered saline (PBS) and an aliquot of the sample solution was diluted to twice the desired final maximum test concentration with serum free medium. Four Additional two fold serial dilutions were made to provide a total of five sample concentrations. Aliquots of 100 μl of these different sample dilutions were added to the appropriate wells already containing 100 μl of medium, so as to obtain the required final sample concentrations. Following sample addition, the plates were incubated for an additional 48 h at 37 °C, 5% CO2, 95% air and 100% relative humidity. The medium without samples were served as control and triplicate was maintained for all concentrations. The prepared samples were incubated for 48 h and after that 15 μl of 3-[4,5-dimethylthiazol-2-yl]2,5-diphenyltetrazolium bromide (MTT-5 mg ml−1) in phosphate buffered saline (PBS) was added to each well and was incubated at 37 °C for 4 h. The medium with MTT was then flicked off and the resultant formazan crystals were dissolved in 100 μl of DMSO and the subsequent absorbance value was measured using (570 nm) micro plate reader. With respect to the control the percentage cell viability was calculated as % cell viability = [A]test/[A]control × 100
2.4 Characterization methods
The X-ray diffraction (XRD) pattern was recorded by using X-ray diffractometer (RigakuUltima IV) using Cu Kα radiation source (λ = 1.54016 Å) operating at 60 kV over the range of 2θ varying from 20° to 80° with 0.02 step size. The ultra violet-visible (UV-vis) absorption and photoluminescence (PL) spectra were recorded using Perkin Elmer Lambda 650S spectrophotometer and Horiba Fluoromax IV spectrofluorometer respectively. The size and shape of the ZOS QDs were determined by JEOL transmission electron microscope (TEM) H900 operating at 300 kV. The elemental X-ray mapping profile of the synthesized ZOS QDs were performed on Hitachi S-3400N scanning electron microscope (SEM) with energy dispersive X-ray (EDX) attachment made by Thermo Scientific. The magnetic properties of the ZOS nanocrystals were investigated using Lakeshore 7404 vibrating sample magnetometer (VSM) as a function of applied magnetic field varying from −10 kG to +10 kG.3. Results and discussion
3.1 X-ray diffraction analysis
Fig. 1 shows the X-ray diffractogram of synthesized ZOS nanocrystals. The crystalline phase formation of the QDs demonstrates that the product has zinc blended cubic phase. All the peaks in the XRD pattern have indicated the cubic structure of the ZOS lattice. By assuming shape of the particles as spherical, the diameter of the nanoparticle d can be expressed as d = (4/3)τ, where d is the diameter of the nanoparticles.18 Here, τ corresponds to mean crystalline size. The mean crystallite size of the ZOS QDs was calculated by using Debye–Scherrer (DS) equation from the obtained X-ray diffractogram results, where β is the full width at half-maximum (FWHM) expressed in radians, λ corresponds to wavelength of X-rays i.e., 1.541 Å and θ corresponds to Bragg's angle.
The Bragg angles of the reflection pattern showed a slight shift towards higher values due to the compressive stress generated by the incorporation of oxygen into the cubic phase blend ZnS lattice confirms the formation of ZOS nanocrystals. The remarkable shift among the diffraction pattern was caused by the lattice expansion or shrinkage due to the diffusion of oxygen.19 The average crystallite size and particle diameter were estimated to be 3.3 nm and 4.4 nm respectively. The lattice strain inside the ZOS crystals was found to be 0.025 using the equation ε = β/(4 × tan![[thin space (1/6-em)]](https://www.rsc.org/images/entities/char_2009.gif) θ), where ε is lattice strain, β is FWHM and θ is diffraction angle.
θ), where ε is lattice strain, β is FWHM and θ is diffraction angle.
3.2 Optical absorption and photoluminescence
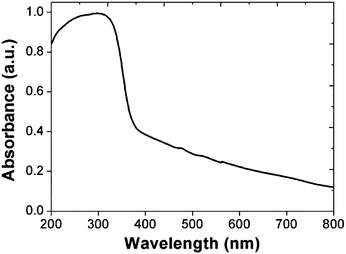
Fig. 2 shows the room temperature absorption spectrum for ZOS QDs recorded in the wavelength range of 200 to 800 nm exhibits band edge absorbance at 358 nm. The optical band-gap was calculated by applying Kubelka–Munk treatment using modified Kubelka–Munk function [F(R∞) × hv]2 vs. incident photon energy as shown in Fig. 3.20Where,  , R is reflectance at given wavelength and hv is incident photon energy.
The optical band-gap energy value of the ZOS QD was determined to be 3.46 eV using Kubelka–Munk plot. It is found that the bandgap of ZOS lies between the limits of the same of ZnS and ZnO. It is in good agreement with the reported value of zinc oxysulfide nanoparticles.21
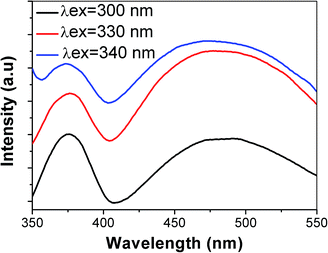
The PL spectrum of ZOS measured (excited at different excitation wavelengths of 300 nm, 330 nm and 340 nm) at room temperature (Fig. 4) describes a narrow UV-emission (377 nm) and broad blue emission (477 nm). UV emission is attributed to the recombination of free excitons and the broad blue emission is interpreted as recombination in the ionized oxygen vacancies to the holes in the valence band. Comparing the reported photoluminescence spectral intensity of ZnS with the obtained PL spectrum of ZOS, the latter shows a reduction in luminescence intensity, which suggests that the synthesized ZOS QDs have highest level of lattice defects. The diffusion of oxygen into the cubic lattice of ZnS crystals leads to higher defect concentrations due to an increase in the number of self activated centres related to the lattice defects of ZnS.22 Moreover the quenching in PL intensity confirms the formation of ZOS through the diffusion of oxygen into the cubic ZnS crystal lattice.
3.3 Size, shape, morphology and elemental composition of zinc oxysulfide quantum dots
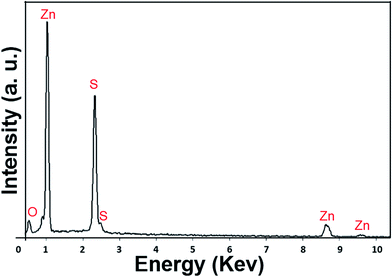
The SEM-EDX analysis distinguishes the elemental distribution within the nanostructure by selecting an area by scanning electron microscope by applying an acceleration voltage of 15 kV. Fig. 5. Shows the EDX spectrum of ZOS QDs and elucidates the presence of oxygen, sulfur and zinc in the synthesized material. The low magnification grey scale SEM image (Fig. 6 Grey) shows that ZOS QDs are agglomerated and it is due to the capping of organic moieties present in the surfactant.The compositional architecture of respective elements were observed using X-ray mapping method. Here, the X-rays emitted from K shell of the elemental components of synthesized ZOS QDs were mapped using EDX-X-ray profile mapping setup. The elemental composition of zinc (yellow), oxygen (green) and sulfur (cyan) in the ZOS quantum dots were quantified from the obtained mapping profile results shown in Fig. 6 (Zn K, O K and S K). The comparative analysis of Zn, O and S distributions in the region under mapping further confirmed the presence and uniform distribution of zinc, oxygen and sulfur in the synthesized zinc oxysulfide nanocrystals.23 The presence of oxygen arises as a result of diffusion of oxygen during crystallization of ZnS lattice, which is due to increase in number of sites where oxygen can attach itself during interaction of gaseous-solid phases resulting in decrease the dimension of the ZOS crystals and leads to the formation of ZOS quantum dots.24
Fig. 7(a and b) shows the respective transmission electron micrograph and particle size distribution of the ZOS quantum dots. The TEM image clearly shows the homogenous distribution of zinc oxysulfide quantum dots. The average particle size of the QDs are nearly 3.6 nm with spherical morphology was observed from the TEM result. The evaluated particles size using TEM was consistent with the average particle size obtained from XRD results.
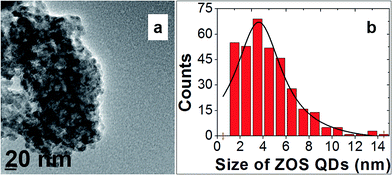 | ||
| Fig. 7 (a) TEM image of zinc oxysulfide quantum dots and (b) particle size distribution of quantum dots computed from TEM image. | ||
3.4 Room temperature ferromagnetism
It can be seen from the Fig. 8 that ZOS QDs exhibit typical ferromagnetic hysteresis curve at room temperature which indicates ZOS acquires magnetism as a function of applied magnetic field when confined to the dimension of QDs. The ZOS QDs shows room temperature ferromagnetism (RTF) which was measured in the field ranging from −10 kG to +10 kG. The observed value of saturation magnetization is 0.008 emu g−1 and the value of coercivity is 102.7 Gauss. The magnetization value detected is quite higher than the earlier reports on both ZnO as well as ZnS nanoparticles.25–28 Regard less of the diamagnetic nature of ZnO and ZnS, the ZOS QDs exhibit dilute magnetic semiconducting property which can be explained by the attributed ferromagnetism due to the evolution of crystal defects and pervaded oxygen atoms. This exclusive transformation from diamagnetic to ferromagnetic domain was supplemented by the photoluminescence results (Fig. 4).3.5 FTIR spectra
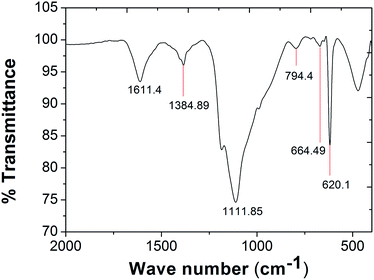
From the FTIR analysis spectrum depicted in Fig. 9 the presence of alcohols and aromatic compounds were confirmed. The peaks at 1111.85 cm−1 and 664.49 cm−1 correspond to C–O stretch and O–H bend, confirming the presence of hydroxyl groups. The following peaks at 794.4 cm−1, 1384.89 cm−1 correspond to![[double bond, length as m-dash]](https://www.rsc.org/images/entities/char_e001.gif) CH2 and –C–H bend respectively confirming the presence of alkenes. Peak at 1611.4 cm−1 is attributed to C
CH2 and –C–H bend respectively confirming the presence of alkenes. Peak at 1611.4 cm−1 is attributed to C![[double bond, length as m-dash]](https://www.rsc.org/images/entities/char_e001.gif) C stretching corresponds to the presence of aromatic compounds.29
C stretching corresponds to the presence of aromatic compounds.29
3.6 Cytotoxicity
The prepared ZOS quantum dots were incubated in physiological conditions (at 37 °C, 5% CO2 and 100% relative humidity) of HeLa cell monolayer for 24 hours. Different concentrations of nanoparticles have been chosen: 10, 20, 30 and 40 μg ml−1. After incubation, the samples were washed three times with IXPBS to remove unbound particles. Fig. 10(a) shows the low magnification image of HeLa cells used as control and Fig. 10(b) shows the HeLa cells incubated with 40 μg ml−1 of zinc oxysulfide quantum dots after 24 h incubation period. | ||
| Fig. 10 Low magnification microscopic images of HeLa cells (a) untreated control cells and (b) cells treated with 40 μg ml−1 of zinc oxysulfide quantum dots after 24 h incubation. | ||
HeLa cell monolayer culture without addition of nanoparticles was used as a control. Remaining cells were counted after incubation using a hemacytometer. The percentage of cell viability incubated with nanoparticles was obtained by reference to the control culture and plotted as in Fig. 11. Cells with quantum dots showed a good survival rate after 24 hours of incubation. After 48 h of incubation, there is a minimal toxic effect was observed at concentration dose (40 μg ml−1).
 | ||
| Fig. 11 Shows the cell viability as a function of different concentrations of the zinc oxysulfide quantum dots. | ||
4. Conclusions
In conclusion, we have developed a method for green synthesis of ZOS QDs with particle size of 3.6 nm. The synthesized ZOS QDs exhibit ferromagnetism at room temperature. Contrary to the synthetic methods reported earlier the ecofriendly green synthesis strategy adopted in this work provides an excellent control over the particle size of ZOS QDs. Even though there is a possibility of oxygen oxidizes sulfur to form zinc sulfate on the nanostructure surface, the formation of zinc oxysulfide quantum dots are mainly due to the lattice impregnation of oxygen during the synthesis process. This can be identified from the peak shift in XRD and elemental distribution profile of oxygen in the ZOS quantum dots obtained from the EDX analysis. Moreover in this synthesis procedure we have used ecofriendly aegle marmelos fruit extract as the surfactant instead of chemically derived surfactant also the prepared ZOS QDs shows good cell viability with HeLa cells. The desired optical bandgap and magnetic properties achieved through this method will have significant impact in developing magnetically and optically active probes for biological applications. The room temperature ferromagnetic behaviour of ZOS QDs reported in this work can have tremendous up thrust in nontoxic ternary chalcogenide based bio-labels for therapeutic applications.Acknowledgements
This work was supported by Nano-X Research Laboratory, Thrissur, Kerala, India. Financial support provided by UGC-Rajiv Gandhi National Fellowship (RGNF) (Grant no. F1-17.1/2012-13/RGNF-2012-13-SC-AND-25784/(SA-III) was gratefully acknowledged by K. V. P. Kumar and O. S. N. Ghosh was supported by doctoral fellowship of Pondicherry University, Govt. of India. Analytical instrumentation facilities provided by Central Instrumentation Facility, Centre for Nanoscience and Technology and CIF Pondicherry University, Pondicherry, India are thankfully acknowledged.References
- A. K. Viswanath, Semiconductors and Semimetals, ed. R. K. Willardson and E. Weber, Academic Press, San Diego, 2001 Search PubMed.
- A. Kudo and Y. Miseki, Chem. Soc. Rev., 2009, 38, 253–278 RSC.
- F. Bonaccorso, Z. Sun, T. Hasan and A. C. Ferrari, Nat. Photonics, 2010, 4, 611–622 CrossRef CAS.
- K. Liu, X. Yao and L. Jiang, Chem. Soc. Rev., 2010, 39, 3240–3255 RSC.
- Q. H. Wang, K. K. Zadeh, A. Kis, J. N. Coleman and M. S. Strano, Nat. Nanotechnol., 2012, 7, 699–712 CrossRef CAS PubMed.
- J. Lee, S. Mahendra and P. J. J. Alvarez, ACS Nano, 2010, 4(7), 3580–3590 CrossRef CAS PubMed.
- H.-B. Yao, H.-Y. Fang, X.-H. Wang and S.-H. Yu, Chem. Soc. Rev., 2011, 40, 3764–3785 RSC.
- H. Deng, J. J. Russell, R. N. Lamb and B. Jiang, Thin Solid Films, 2004, 458, 43–46 CrossRef CAS PubMed.
- C. Falcony, M. Garcia, A. Ortiz and J. C. Alonso, J. Appl. Phys., 1992, 72, 1525–1527 CrossRef CAS PubMed.
- I. T. Sorokina, E. Sorokin, S. Mirov, V. Fedorov, V. Badikov, V. Panyutin, A. D. Lieto and M. Tonelli, Appl. Phys. B, 2002, 74, 607–611 CrossRef CAS.
- B. X. Fang, Y. Bando, M. Liao, U. K. Gautam, C. Zhi, B. Dierre, B. Liu, T. Zhai, T. Sekiguchi, Y. Koide and D. Golberg, Adv. Mater., 2009, 21, 2034–2039 CrossRef.
- H. Ren, G. Xiang, G. Gu, X. Zhang, W. Wang, P. Zhang, B. Wang and X. Cao, J. Nanomater., 2012, 1, 295358 Search PubMed.
- D. Lehr, M. Luka, M. R. Wagner, M. Bugler, A. Hoffmann and S. Polarz, Chem. Mater., 2012, 24, 1771–1778 CrossRef CAS.
- S. Gayathri, O. S. N. Ghosh, A. K. Viswanath, P. Sudhakara, M. J. K. Reddy and A. M. Shanmugharaj, Int. J. Biol. Macromol., 2015, 72, 1308–1312 CrossRef CAS PubMed.
- X. Zhong, Y. Feng, W. Knoll and M. Han, J. Am. Chem. Soc., 2003, 125, 13559–13563 CrossRef CAS PubMed.
- J. Akhtar, M. A. Malik, P. O'Brien, K. G. U. Wijayantha, R. Dharmadasa, J. O. Hardman, D. M. Graham, B. F. Spencer, S. K. Stubbs, W. R. Flavell, D. J. Binks, F. Sirotti, M. E. Kazzi and M. Silly, J. Mater. Chem., 2010, 20, 2336–2344 RSC.
- D. K. Smith, J. M. Luther, O. E. Semonin, A. J. Nozik and M. C. Beard, ACS Nano, 2011, 1, 183–190 CrossRef PubMed.
- S. Sapara, A. Prakash, A. Ghangrekar, N. Periyasamy and D. D. Sarma, J. Phys. Chem. B, 2005, 109, 1663–1668 CrossRef PubMed.
- S. K. Pandey, S. Pandey, V. Parashar, R. S. Yadav, G. K. Mehrotraa and A. C. Pandey, Nanoscale, 2014, 6, 1602–1606 RSC.
- A. A. Kokhanovsky, J. Phys. D: Appl. Phys., 2007, 40, 2210–2216 CrossRef CAS.
- I. Polat, S. Aksu, M. Altunbas, S. Yılmaz and E. Bacaksız, J. Solid State Chem., 2011, 184, 2683–2689 CrossRef CAS PubMed.
- T. T. Q. Hoa, N. D. The, S. McVitie, N. H. Nam, L. V. Vu, T. D. Canh and N. N. Long, Opt. Mater., 2011, 33, 308–314 CrossRef CAS PubMed.
- S. K. Pandey, S. Pandey, A. C. Pandey and G. K. Mehrotra, Appl. Phys. Lett., 2013, 102, 233110 CrossRef PubMed.
- N. P. Golubeva and M. V. Fok, J. Appl. Spectrosc., 1975, 23(4), 638–642 CrossRef CAS.
- M. A. Garcia, J. M. Merino, E. F. Pinel, A. Quesada, J. de la Venta, M. L. R. Gonzalez, G. R. Castro, P. Crespo, J. Llopis, J. M. Gonzalez-Calbet and A. Hernando, Nano Lett., 2007, 7(6), 1489–1494 CrossRef CAS PubMed.
- P. C. Patel, N. Srivastava and P. C. Srivastava, J. Mater. Sci.: Mater. Electron., 2013, 24, 4098–4104 CrossRef CAS.
- X. Xu, C. Xu, G. Chen, J. Wu and J. Hu, EPL, 2013, 101, 27009 CrossRef.
- B. K. Sarkar and S. S. Solanki, Int. J. Pharm. Life Sci., 2011, 2(12), 1303–1305 Search PubMed.
- G. Li, J. Zhai, D. Li, X. Fang, H. Jiang, Q. Dong and E. Wang, J. Mater. Chem., 2010, 20, 9215–9219 RSC.
| This journal is © The Royal Society of Chemistry 2015 |


