DOI:
10.1039/C4RA14113J
(Paper)
RSC Adv., 2015,
5, 7340-7348
Improved antifouling performance of polyethersulfone (PES) membrane via surface modification by CNTs bound polyelectrolyte multilayers
Received
8th November 2014
, Accepted 9th December 2014
First published on 10th December 2014
Abstract
In this study, commercial polyethersulfone (PES) membranes were surface-modified by the deposition of functionalized carbon nanotubes (f-CNTs) bound polyelectrolyte multilayers (PEMs) through spray-assisted layer-by-layer (LbL) technique. To investigate the anti-organic fouling properties of fabricated membranes, two representative organic foulants, bovine serum albumin (BSA) and sodium alginate (SA), were selected. Single and binary organic feed solutions in the presence or absence of calcium ions were tested in cross-flow ultrafiltration apparatus. In addition, to examine the membrane resistance to bacteria fouling, the prepared membranes were immersed into Gram-negative Escherichia coli (E. coli) and Gram-positive Staphylococcus aureus (S. aureus) suspension for 4 hours and the adhesion of bacteria cells were observed by scanning electron microscope (SEM). The fouling and antifouling mechanisms were proposed according to the specific scenarios in this study. It was found that the enhancement of hydrophilicity and surface charge of the PES membrane mitigated organic/bio-fouling under all circumstances; the fouling and antifouling of membranes were governed by a complex interplay of interactions between foulants and membrane. Among various interactions, hydration forces and electrostatic repulsion presumably contributed significantly for reducing the adhesion of foulants. The flux of fouled membranes could be restored by the simple flushing of DI water without any chemical treatment.
1. Introduction
Membranes have played an indispensible role in water treatment for decades because of their high selectivity, small footprint, easy scale-up and environmental friendliness.1 Polymeric membranes, in particular, hydrophobic polyethersulfone (PES) membranes, are widely utilized in market due to their superior characteristics of chemical and thermal stability.2 However, commercial PES membranes are susceptible to fouling owing to their interactions with inorganic, organic or bacteria solutes through secondary forces.3,4 Fouling, caused either by inorganic compounds, organic macromolecules or bacteria, may shorten the membrane lifetime, reduce the possibility of reuse and cause extra replacement cost.5
Depending on the degree of severity, fouling can be classified into reversible and irreversible fouling. Reversible fouling could be eliminated by hydraulic cleaning, such as backwashing and cross-flushing, while irreversible fouling could only be overcome by harsh chemical cleansing or by the replacement of membrane elements.6,7 Unfortunately, the fouling is irreversible and inevitable in most of the treatment applications.8 Therefore, the prevention of undesired adhesion of foulants on the membrane is an effective strategy to inhibit or mitigate adhesive fouling.9 This could be fulfilled by membrane surface modification, such as plasma treatment, polymerization or layer-by-layer (LbL) assembly. Considering the high-cost plasma equipment and stringent requirements on reaction conditions for polymerizations, the facile and tunable LbL method appears to be an attractive technique to modify membrane surface without constraints. Moreover, LbL components are not limited to polymer itself. Stabilized nanoparticles and proteins can be assembled to modify the membrane surface for enhanced hydrophilicity and charge density, so as to reduce the adhesion of foulants and impede fouling.
Although a number of studies explored the removal efficiencies of polyelectrolyte multilayer (PEM) membranes for various aqueous species, such as multi-valent ions, dyes, and organic solvents,10–12 limited researches focused on the anti-organic/bio-fouling performance of these membranes, especially nanofiller-incorporated ones. Ba et al. demonstrated the potentials of polyethylenimine (PEI)/polyacrylic acid (PAA) and PEI/polyvinyl sulfate (PVS) PEM membranes on flux restoration after being fouled by bovine serum albumin (BSA), humic acid (HA) and sodium alginate (SA).13 Tang et al. discovered that the number of E. coli deposited on poly(allylamine hydrochloride) (PAH)/PAA PEM membranes decreased by three orders of magnitude compared to polysulfone microfiltrator.14 Liu et al. reported that Ag nanoparticle-doped PAH/poly(sodium 4-styrenesulfonate) (PSS) PEM membranes posed toxic effects toward both Gram-positive B. subtilis and Gram-negative E. coli.15 Diagne et al. designed nanoAg-impregnated PSS/poly(diallyldimethyl-ammonium chloride) (PDDA) PEM membranes, and they observed E. coli inhibition and less humic acid adhesion.16
Humic substances, proteins and polysaccharides have been identified as the “culprits” for membrane organic fouling.17–19 In our previous work, PEM membranes consisting of strong acid-treated CNTs (4 wt% of polyelectrolyte) showed improved humic acid fouling resistance.20 To further examine the anti-fouling properties of this type of membrane, BSA and SA were selected as model organic foulants. In this study, the anti-bacterial characteristics of the membrane were also investigated by Gram-negative E. coli and Gram-positive S. aureus.
2. Experimental
2.1 Materials
The polyethersulfone substrate (PES-SM, 20![[thin space (1/6-em)]](https://www.rsc.org/images/entities/char_2009.gif) 000 Da) was provided by Synder Filtration Inc., USA. Multiwalled carbon nanotubes (MWCNTs) were produced by Hanwha Nanotech., Korea (purity > 95%, diameter 10–15 nm, length 10–20 μm). Two types of polyelectrolyte, poly(sodium-4-styrenesulfonate) (PSS, Mw = 70000 Da, powder) and poly(diallyl-dimethylammonium chloride) (PDDA, Mw = 100000–200000 Da, 20 wt% in H2O), were purchased from Sigma-Aldrich, USA, and used as received. Bovine serum albumin (BSA, powder, Sigma-Aldrich, USA) and sodium alginate (SA, powder, Sigma-Aldrich, USA) were chosen as model organic foulants without further purification. Phosphorous salts, ethanol and glutaraldehyde (GA) were obtained from Sigma-Aldrich, USA. Phosphorous buffer saline (PBS) was prepared according to the standard protocols (pH = 7.0 for anti-organic fouling test and pH = 7.4 for anti-biofouling tests). E. coli K12 (KCTC 1116) and S. aureus (KCTC 1928) were selected as model Gram-negative and Gram-positive bacteria for the anti-biofouling test. De-ionized (DI) water (Milli-Q, 18.2 MΩ cm) was used for the preparation of solutions and membrane storage.
000 Da) was provided by Synder Filtration Inc., USA. Multiwalled carbon nanotubes (MWCNTs) were produced by Hanwha Nanotech., Korea (purity > 95%, diameter 10–15 nm, length 10–20 μm). Two types of polyelectrolyte, poly(sodium-4-styrenesulfonate) (PSS, Mw = 70000 Da, powder) and poly(diallyl-dimethylammonium chloride) (PDDA, Mw = 100000–200000 Da, 20 wt% in H2O), were purchased from Sigma-Aldrich, USA, and used as received. Bovine serum albumin (BSA, powder, Sigma-Aldrich, USA) and sodium alginate (SA, powder, Sigma-Aldrich, USA) were chosen as model organic foulants without further purification. Phosphorous salts, ethanol and glutaraldehyde (GA) were obtained from Sigma-Aldrich, USA. Phosphorous buffer saline (PBS) was prepared according to the standard protocols (pH = 7.0 for anti-organic fouling test and pH = 7.4 for anti-biofouling tests). E. coli K12 (KCTC 1116) and S. aureus (KCTC 1928) were selected as model Gram-negative and Gram-positive bacteria for the anti-biofouling test. De-ionized (DI) water (Milli-Q, 18.2 MΩ cm) was used for the preparation of solutions and membrane storage.
2.2 Membrane fabrication
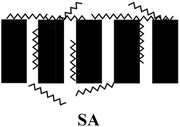
Prior to membrane fabrication, commercial CNTs were purified and chemically treated by sulfuric and nitric acid.2,20 The membrane fabrication process was completed with the assistance of an air pistol (SEIKI GP-1, 0.35 mm nozzle diameter, Japan), and 1 g L−1 spray solutions were prepared by individually dissolving polyelectrolytes into DI water and stirring for 4 hours. Anionic solution comprised of PSS and f-CNTs (4 wt% of PSS), whereas cationic solution only contained PDDA. The surface of vertically positioned PES substrate was alternatively deposited by anionic and cationic solution by rinsing with DI water after each deposition step. The spray and rinsing step lasted for 15 and 30 seconds, during which one minute was required for assembly process between each layer. Hereafter, the commercial PES substrate was labeled as “Mb”, the fabricated membranes were denoted as M3.5 and M6.5, where 3.5 and 6.5 represent numbers of bilayers of PSS (with f-CNTs)/PDDA deposited on PES membrane, and PSS (with f-CNTs) served as the initiating and terminating layer. The compositions of the membrane are shown in Fig. 1.
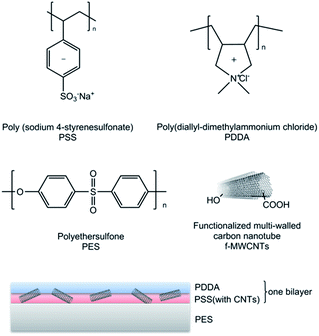 |
| | Fig. 1 The structure of polymers and CNTs in membrane compositions. | |
2.3 Characterization of membranes
The topographical features of membranes were determined by atomic force microscopy (AFM, PSIA XE-100, Korea) with cantilever (NSC 36, Mikromasch, USA) in contact mode. The scanning area was set to 5 × 5 μm2, and at least 7 points were measured to acquire the average roughness Ra of the membrane surface. The zeta-potential measurement was performed on a zeta potentiometer (ELS-Z, Otsuka Electronics, Japan); 1 mM NaCl was used as the background electrolyte, and pH was adjusted to 7.0 by 0.1 M NaOH and 0.1 M HCl. The membranes were stored in background solution for 24 hours before measurement. Contact angles were measured by captive bubble method on a contact angle goniometer (DSA100, Krüss, Germany). The measurements were conducted at ambient temperature in DI water; 10 μL of air bubble was released from the syringe and attached on the membrane surface, and images were captured and analyzed by DSA100 software.
2.4 Anti-organic fouling test
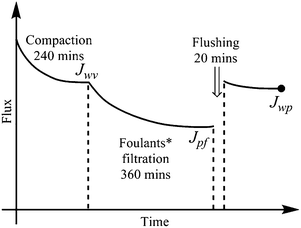
The membrane anti-organic fouling performances were evaluated by a custom-made cross-flow ultrafiltration setup, and the temperature was maintained at 25 ± 1 °C throughout the experiment by automatic temperature controller. Both permeate and retentate were circulated back to the feed tank to maintain the feed concentration. All the membranes were compacted by DI water at trans-membrane pressure (TMP) of 60 psi for 240 min, then feed solution was replaced by single or binary organic foulants in 10 mM PBS (pH = 7.0). The anti-fouling tests were performed for 360 min, followed by flux recovery test of 20 min by flushing with DI water. The scheme is illustrated in Fig. 2.
 |
| | Fig. 2 Schematic illustration of anti-organic fouling tests. Organic foulants compositions are as follows: case (1) 1 g L−1 BSA solution; case (2) 1 g L−1 SA solution; case (3) 0.5 g L−1 BSA + 0.5 g L−1 SA solution; case (4) 0.5 g L−1 BSA + 0.5 g L−1 SA + 1 mM CaCl2 solution in 10 mM phosphorus buffer (pH = 7.0). | |
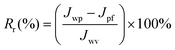
The water flux J can be determined using the following formula:
| |
 | (1) |
where
V is the volume of permeated water (L),
A is the effective membrane area of the membrane module (1.856 × 10
−3 m
2), and Δ
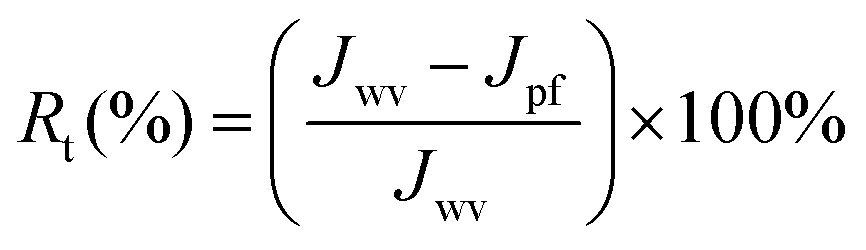
t is the permeation time (h). Parameters evaluating fouling resistance of the membrane, flux recovery ratio (FRR) and total flux loss
Rt, are calculated using the following equations:
| |
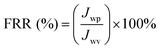 | (2) |
| |
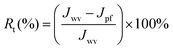 | (3) |
The reversible (Rr) and irreversible (Rir) ratio are defined to further differentiate factors constituting the total flux loss Rt,
| |
 | (4) |
| |
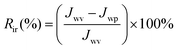 | (5) |
where
Jwv,
Jpf and
Jwp represent the flux of virgin PES membrane, fouled membrane after 360 min filtration and cleaned membrane after 20 min DI water flushing, respectively.
2.5 Bacterial anti-adhesion tests
To assess the anti-adhesion properties of membrane toward bacteria, E. coli K12 and S. aureus were first streaked on Luria–Bertani (LB) agar and brain heart infusion (BHI) agar separately and incubated overnight at 37 °C. Single colonies of bacteria were inoculated in 5 mL LB and BHI broth and incubated at 37 °C for 12 h. 100 μL of mixture was then transferred to another 5 mL liquid medium and cultured at 37 °C for 6 h to obtain viable log-phase bacteria. The bacteria in the log phase were harvested from the broth by centrifugation (Centrifuge 5418, Eppendorf) and washed by PBS (pH = 7.4) after the supernatant was decanted. The rinsing step by PBS was repeated three times to completely remove all the remaining nutrients. Optical density at 600 nm (OD600) was measured for both bacteria by one time dilution. Bacteria suspension of about 106 cells per mL of E. coli K12 and S. aureus were prepared in a final volume of 10 mL with PBS, and 1.5 × 1.5 cm2 membrane coupons of Mb, M3.5 and M6.5 were sterilized under UV irradiation for 30 min, then immersed into 10 mL of E. coli K12 and S. aureus suspension in 15 mL conical tubes and shaken at 37 °C for 4 h in an incubation shaker at 200 rpm. The membranes were withdrawn and gently rinsed with PBS. Before the SEM analysis of the adhered bacteria on the membrane surface, several steps of pretreatment were carried out as follows: the membrane coupons were immersed in 10 mL 3% (v/v) glutaraldehyde (GA) solution at 4 °C for 5 h of bacteria fixation, after washing off excess GA solution by DI water, it was dehydrated stepwise with 25%, 50%, 75% and 100% ethanol, and dried at room temperature. The bacteria on the membrane surfaces were detected by scanning electron microscopy (SEM, Hitachi S-4800, Japan).
3. Results and discussions
3.1 Membrane surface properties
The contact angle measurements were performed under membrane wet state, which closely resembled real filtration conditions; therefore, the captive bubble method was considered more suitable to examine the hydrophilicity of the membrane in water treatment.21 As shown in Table 1, all the membranes were hydrophilic, the contact angle of unmodified Mb was 57°, and the quaternary ammonium together with sulfonated moieties in PEMs led to the decrease in contact angles of M3.5 and M6.5. Jones et al. and Warszynski et al. reported that the membranes capped with PSS were more hydrophilic than the ones terminated by PDDA.22,23 Furthermore, hydroxyl and carboxyl functional groups in f-CNTs further improved the hydrophilicity of PEM membranes.
Table 1 The properties of the membranes
| Types |
Contact angle (°) |
Ra (nm) |
ζ-potentialb (mV) |
| The numbers in square brackets indicate contact angle values of PEM membrane without f-CNTs. The values shown here are the zeta-potential values of the membranes without f-CNTs. |
| Mb |
57.28 ± 2.37 [null]a |
2.36 ± 0.17 |
−24.15 ± 0.59 |
| M3.5 |
42.02 ± 0.91 [53.26]a |
3.10 ± 0.14 |
−36.51 ± 0.54 |
| M6.5 |
39.20 ± 0.76 [48.65]a |
3.27 ± 0.19 |
−52.52 ± 1.69 |
Based on the AFM results, it can be inferred that the commercial PES membrane had a relatively smooth surface. However, even f-CNTs with ∼15 nm diameter were incorporated during membrane preparation, surface modification did not induce significant change on the roughness of the membrane, which verified that the f-CNTs were embedded in the polyelectrolyte matrices by virtue of strong electrostatic interactions with PEMs. It was worth noting that the AFM analysis of membranes was carried out in a dry state, and the Ra values may vary as a result of the hydration or swelling of PEM during filtration.
The presence of electrical semiconductive CNTs in the nanocomposite interfered with the zeta-potential measurements of the membrane. The values listed in Table 1 indirectly reflected the changes of membrane surface charge by testing PEM membranes without containing f-CNTs. It was found that the negativities of the membrane surface enhanced with the deposition of more layers. We hypothesized that f-CNTs contained membranes exhibited the same behavior for zeta-potential change. Moreover, it was also expected that the negative charge densities of M3.5 and M6.5 further increased to some extent because of the hydroxyl and carboxyl groups on f-CNTs.
3.2 Membrane anti-fouling properties
To understand interactions between membrane surface and organic solutes, (1) filtration of single- (Section 3.2.1 and 3.2.2) and binary-solute (Section 3.2.4 and 3.2.5) feed solution and (2) subsequent surface cleaning by water flushing were investigated. Different fouling and anti-fouling profiles among membranes were distinguished by flux reduction and restoration. Moreover, the phenomena and mechanisms of anti-bacteria adhesion were studied (Section 3.2.7).
Before presenting about the fouling behaviors of BSA and SA, properties of these two solutes were briefly discussed. BSA is one type of globular and flexible protein, consisting of amino acid groups in a single chain.24 At the isoelectric point (pH = 4.7), BSA bears negative charge on the surface. In contrast, SA is a linear anionic polysaccharide composed of uronic acid residues, and negative charge results from the deprotonation of carboxylic functional groups.25 Their physicochemical properties are summarized in Table 2.
| Foulants |
Typical shape |
MW |
Carboxylic acidity |
| Under pH = 7.0. |
| BSA |
Globular |
67 kDa |
1 meq. g−1 |
| SA |
Random coil |
12–80 kDa |
3.5 meq. g−1 |
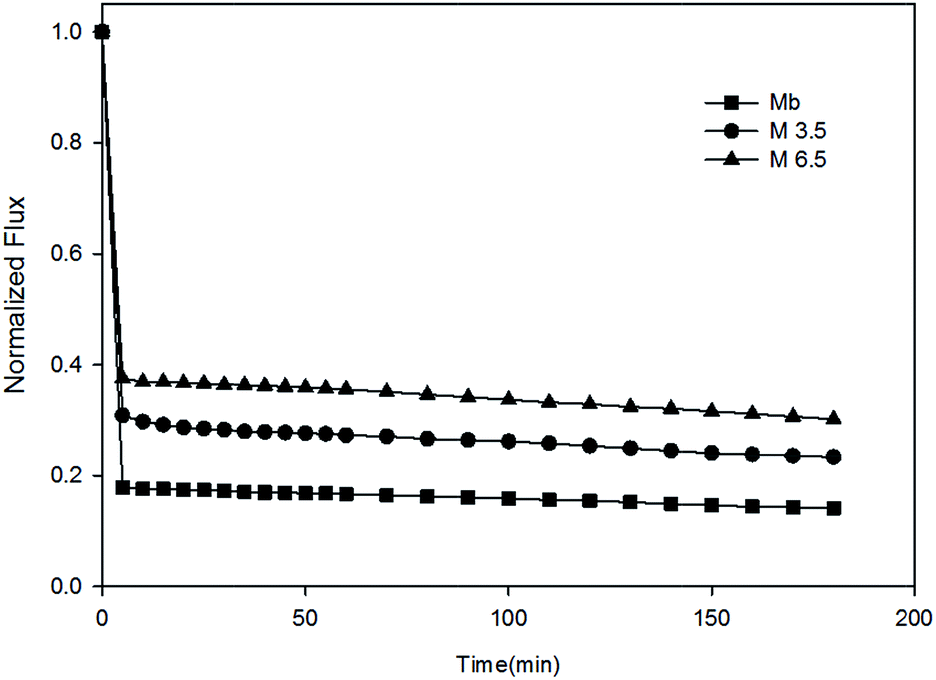
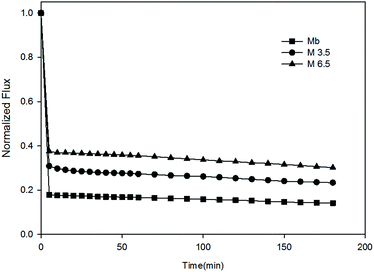
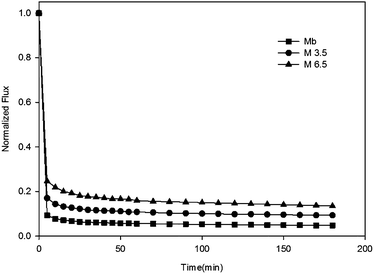
3.2.1 Membrane fouling with single foulant–BSA. Fig. 3 shows the flux decline of membranes as a function of time during BSA filtration. The size of BSA was larger than MWCO of tested membranes (Table 3); therefore, BSA was substantially retained and accumulated on the membrane surface. Three membranes underwent an analogous trend of flux decline, following the order Mb > M3.5 > M6.5. As the cake layer formation proceeded, the flux leveled off after 360 min filtration. Ying et al. described that the BSA adsorption was dominated by hydrogen bonding and electrostatic interaction with the hydrophilic surface.24 It appeared that the flux of PEM membranes gradually declined, which revealed that the contribution of electrostatic repulsions between BSA and membranes prevailed with the incorporation of f-CNTs and slowed down the adsorption processes. In addition, the f-CNTs increased the hydrophilicity of PEM membranes (Table 1), thus, promoting the hydration of the membrane surfaces. The hydration layer restricted the adsorption of BSA on the membrane surfaces, and the formation of loosely packed BSA on the PEM membrane provided insufficient hydraulic resistance to retard the diffusion of water molecules.28
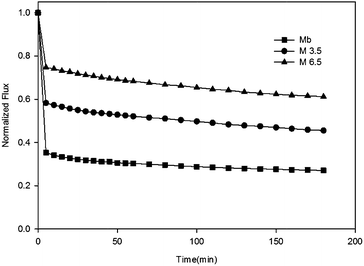 |
| | Fig. 3 Single-solute feed filtration test with membranes for 1 g L−1 BSA at 25 °C under 50 psi TMP. | |
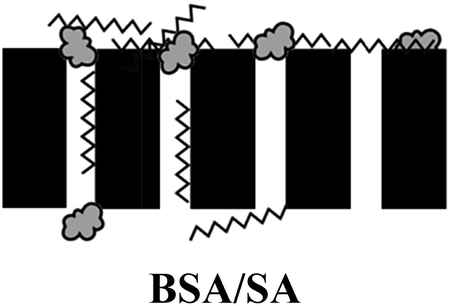
Table 3 Schematic illustration of membrane fouling and antifouling scenarios in this studya
| Membrane fouling scenarios |
Fouling characteristics |
Anti-fouling scenarios |
 : BSA; : BSA;  : SA; : SA;  : calcium ion (Ca2+); : calcium ion (Ca2+);  : bacteria; : bacteria;  : PES membranes; : PES membranes;  : PEMs; : PEMs;  : f-CNTs. : f-CNTs. |
 |
High reversibility: electrostatic repulsion & hydration force |
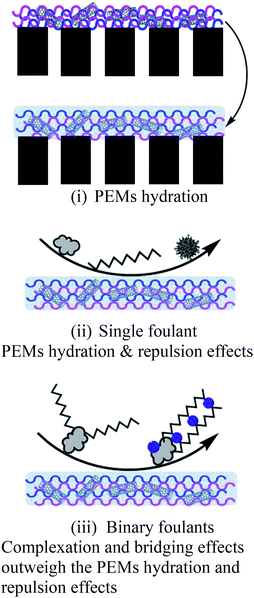 |
| Low irreversibility: pore blocking, hydrogen bonding & van der Waals forces |
 |
Medium reversibility: electrostatic repulsion & hydration force |
| Medium irreversibility: hydrogen bonding & van der Waals forces |
 |
Medium reversibility: hydration force & electrostatic repulsion |
| Medium irreversibility: hydrogen bonding & van der Waals forces |
 |
Low reversibility: hydration force & electrostatic repulsion |
| High irreversibility: Ca2+ bridging, hydrogen bonding & van der Waals forces |
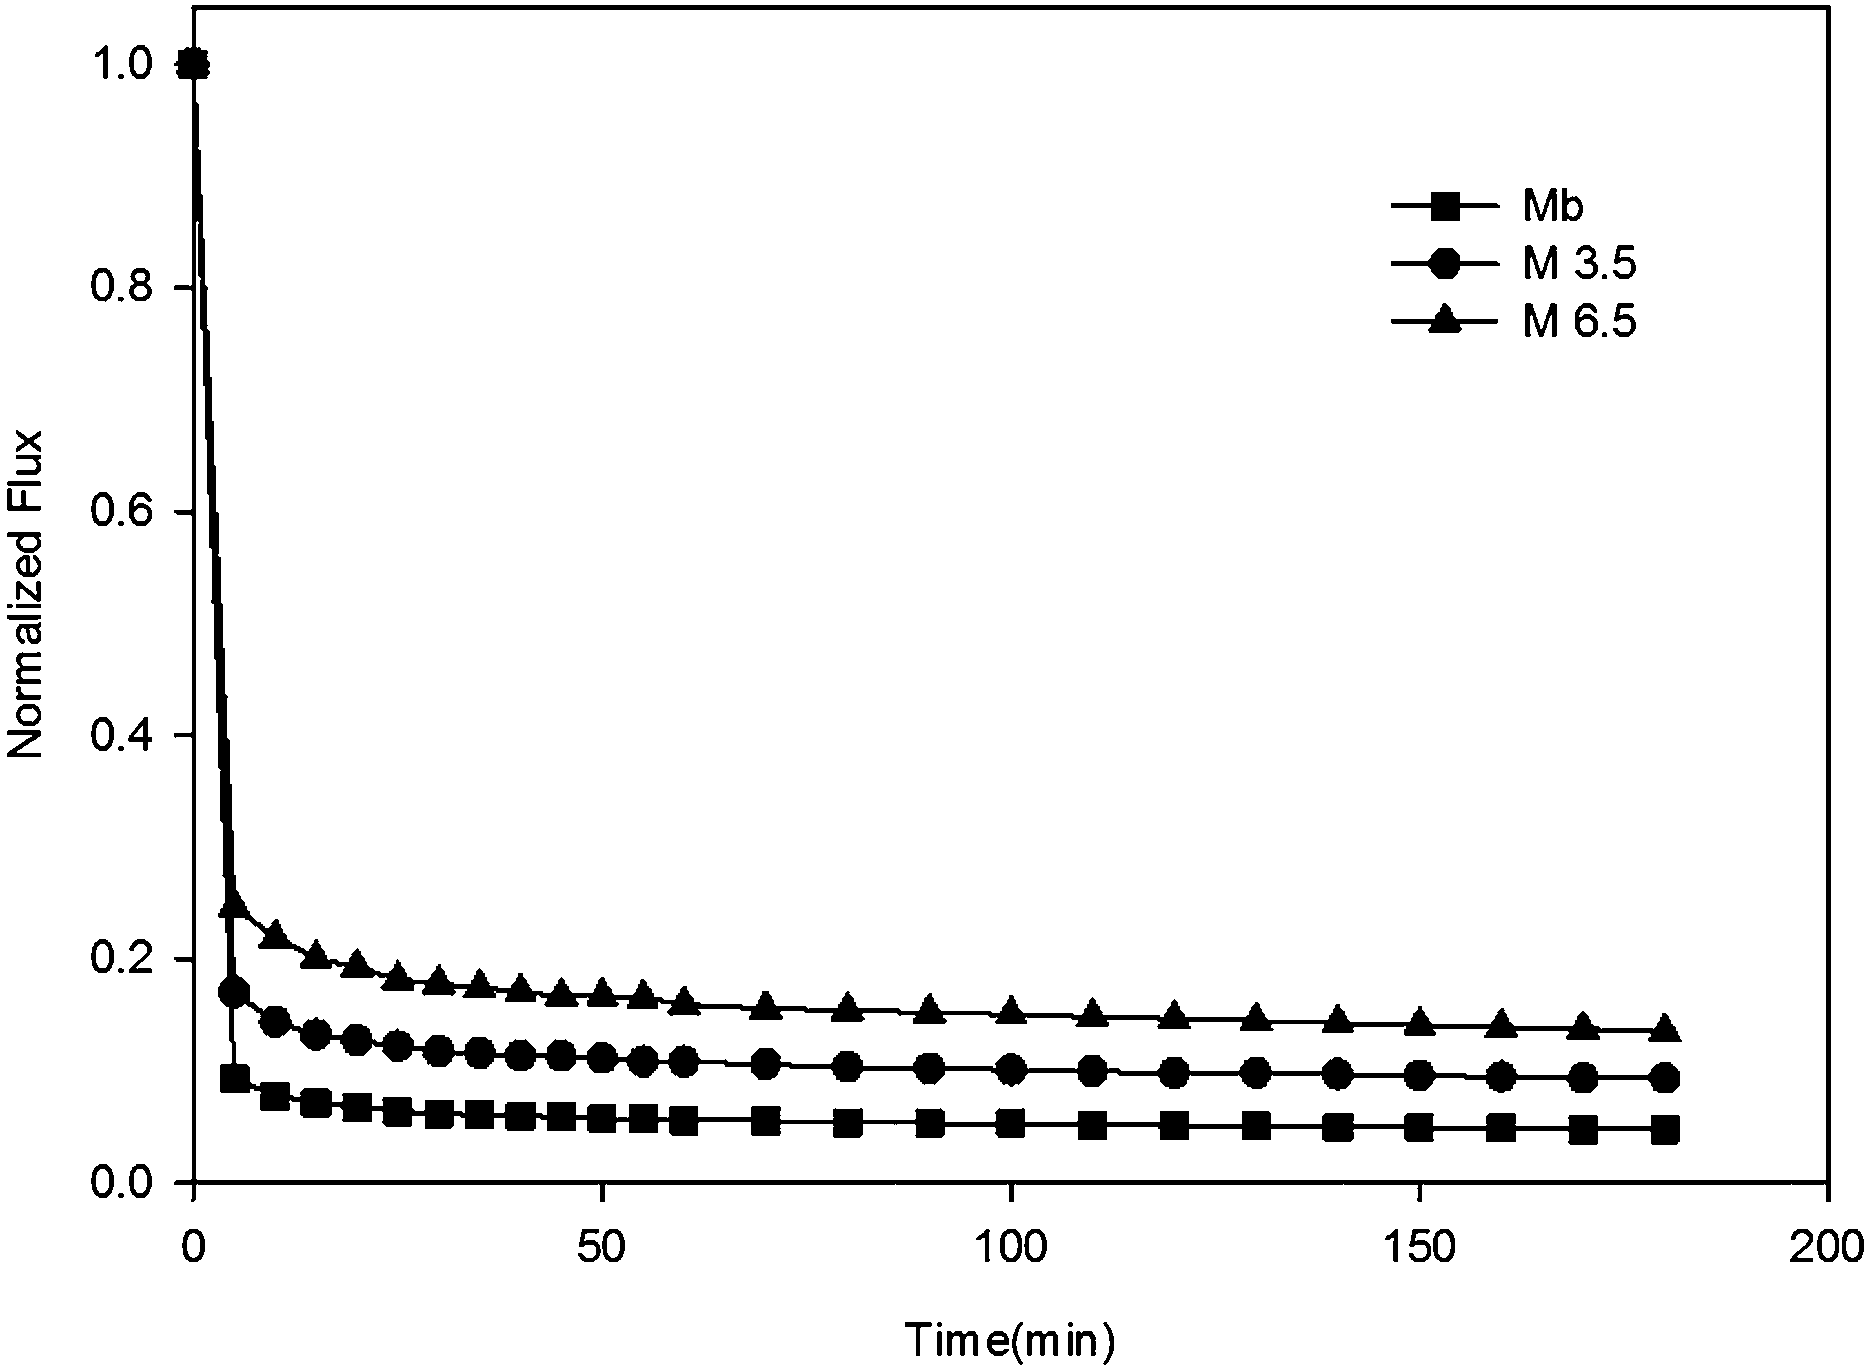
3.2.2 Membrane fouling with single foulant–SA. At neutral pH, SA had a stretched configuration due to increased electrostatic repulsion by adjacent carboxyl groups.29 Unlike the case of BSA, when SA was introduced as feed solution, over 75% loss in flux for all membranes occurred in the first five minutes, and flux reached stable plateau values (Fig. 4). A severe flux decline for SA was also observed by Susanto et al. while performing the antifouling experiment by commercial PES UF membrane.30 Due to broad molecular weight distribution of SA (12–80 kDa), a small fraction of SA may penetrate into the internal pores of the membranes. The severe flux losses could be explained by the partial pore blocking accompanied by cake layer formation on the membrane surfaces. Katsoufidou et al. proposed that this concentrated layer developed near the membrane was a fluid-like material in the absence of calcium.25 In spite of the marginal attractive interactions of SA and PES membrane, Jermann et al. reported that the SA adsorption on commercial PES membrane was mainly governed by electrostatic repulsions.31 The surface charge of Mb was altered by f-CNTs bound PEM deposition, the strong electrostatic repulsion between SA and PEM membrane resulted in less flux reduction for M3.5 and M6.5. In consideration of hydrophilicity increase by surface modification, the increased hydration of f-CNTs bound PEM membranes collaboratively contributed to the reduced interactions between SA and membranes.
 |
| | Fig. 4 Single-solute feed filtration test with membranes for 1 g L−1 SA at 25 °C under 50 psi TMP. | |
3.2.3 Flux decline reversibility for single foulant. As discussed earlier, the mechanisms of membrane fouling by single solute corresponded with both foulant and membrane characteristics. In general, degrees of hydration and charge densities of the membrane surface were commonly acknowledged as the main factors.9 It should be noted here that the surface properties of the membrane could be manipulated by PEM deposition; f-CNTs in PEMs resulted in additional hydrophilicity and surface charge enhancement, which had a positive effect on the anti-fouling properties of the membrane. Due to the moderately hydrophilic and charged surface, the medium irreversibility (58.47%) of Mb in Fig. 5 was attributed to attractive interactions between Mb and BSA through hydrogen bonding or van der Waals forces. Surface modification by PEMs led to less irreversible fouling, and thus higher water flux restoration. Rir of M3.5 and M6.5 were reduced by 13.58% and 30.47% with respect to Mb. In a similar manner, anti-SA fouling was clearly indicated by considerable improvements in flux recovery by the PEM membrane. Rir of M3.5 was reduced to 14.22% from nearly 40% for Mb. One interesting result was the observation that the flux recovery of M6.5 was over 100%. This was probably because the penetration of SA into PEMs frameworks screened polyelectrolyte charge, imparting the swelling of PEMs. Nevertheless, when successive tests with SA filtration were performed after DI water flushing, no odd data were found on SA rejection and membrane flux (results were not shown here), which implied the integrity of PEMs was not impacted by SA fouling.
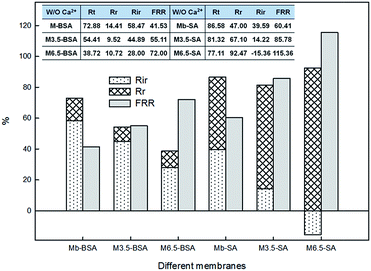 |
| | Fig. 5 Fouling ratios of the membranes for single-solute feed filtration test. FRR, Rt, Rr, and Rir represent the flux recovery ratio, total flux loss, the reversible ratio and irreversible ratio, respectively. | |
3.2.4 Membrane fouling with binary foulants–BSA/SA. In single-foulant solution, the membrane fouling was merely influenced by foulant-membrane interactions. Regarding the binary-foulant system, Ang and coworkers elucidated the dominance of SA on flux decline rather than BSA for RO membrane.17 Neemann et al. quantitatively studied protein and polysaccharide non-covalent interactions and noted that BSA and SA formed a soluble complex near the critical pH (∼6.0), and this complex was responsible for a high fouling rate.32 In Fig. 6, the flux drop patterns of binary foulants were almost identical with that of single SA (Fig. 3). The unmodified Mb showed about 86% flux decline owing to the BSA–SA complex formation on the membrane surface. However, favored by f-CNTs enhanced hydration and electrostatic repulsion, loosely deposited BSA–SA complex on the membrane surface accounted for the alleviated flux reduction for M3.5 and M6.5.
 |
| | Fig. 6 Binary-solute feed filtration test with membranes for 0.5 g L−1 SA and 0.5 g L−1 BSA without Ca2+ at 25 °C under 50 psi TMP. | |
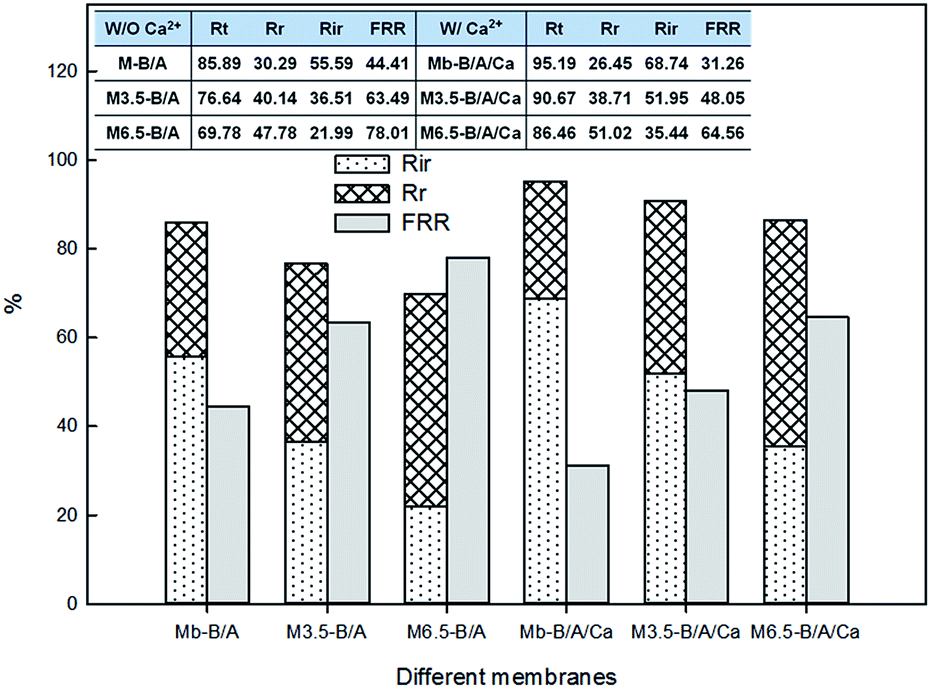
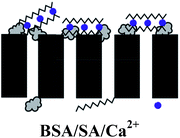
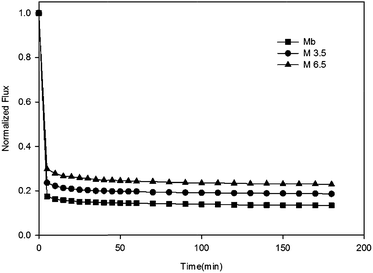
3.2.5 Membrane fouling with mixed foulants–BSA/SA/Ca2+. As shown in Fig. 7, water flux decline was more pronounced in the presence of calcium ions. Over 85% flux declines were ultimately reached for all the membranes. This could be interpreted by the calcium-foulant-membrane associations. First, calcium might have absorbed on the membrane surface and must have neutralized the surface of the membrane, accelerating the interaction with foulants. Second, SA tended to conjugate with calcium and constructed a gel network, known as an “egg-box” model33 (shown in Table 3), together with BSA, a highly compacted fouling layer was formed, which was less permeable for water molecules. In addition, calcium acted as the “bridge” to tightly connect the organic complex with the membrane surface; the gel layer on the membrane increased the hydraulic resistance, bringing about the rapid flux drop.34 Therefore, there were chances that the hydration force overshadowed the electrostatic repulsion because the shielding effect of the membrane charge by calcium weakened the membrane negative charge. However, the complex may prevent the internal pore fouling by the previous single SA scenario. Despite the adverse influence of calcium, it was evident that f-CNTs bound PEM membranes were capable of withstanding water flux loss.
 |
| | Fig. 7 Binary-solute feed filtration test with membranes for 0.5 g L−1 SA and 0.5 g L−1 BSA with [Ca2+] = 1 mM at 25 °C under 50 psi TMP. | |
3.2.6 Flux decline reversibility for binary foulants. Fig. 8 shows the reversibility of membrane fouling in binary foulant feed solution. One could notice that the irreversible fouling of a calcium-free system was closely related to the contribution of single BSA (Fig. 5), which inferred the predominant role of BSA in irreversible fouling.32 Calcium aggravated the detrimental effects on membrane fouling. Calcium ions not only had an impact on polysaccharides and protein complexation, but other natural organic pollutants, like NOMs, also sustained calcium conjugation, which triggered the irreversible fouling of polymeric membrane.35 Once the gel layer was formed, it was difficult to remove by routine cleaning methods. It was interesting to note that M6.5 shows 35.44% irreversible flux recovery, almost half that of Mb, which verified that increased hydration and charge density induced by f-CNTs could relieve membrane fouling under harsh conditions.
 |
| | Fig. 8 Fouling ratios of the membranes for binary-solute feed filtration test. FRR, Rt, Rr, and Rir represent the flux recovery ratio, total flux loss, the reversible ratio and irreversible ratio, respectively. | |
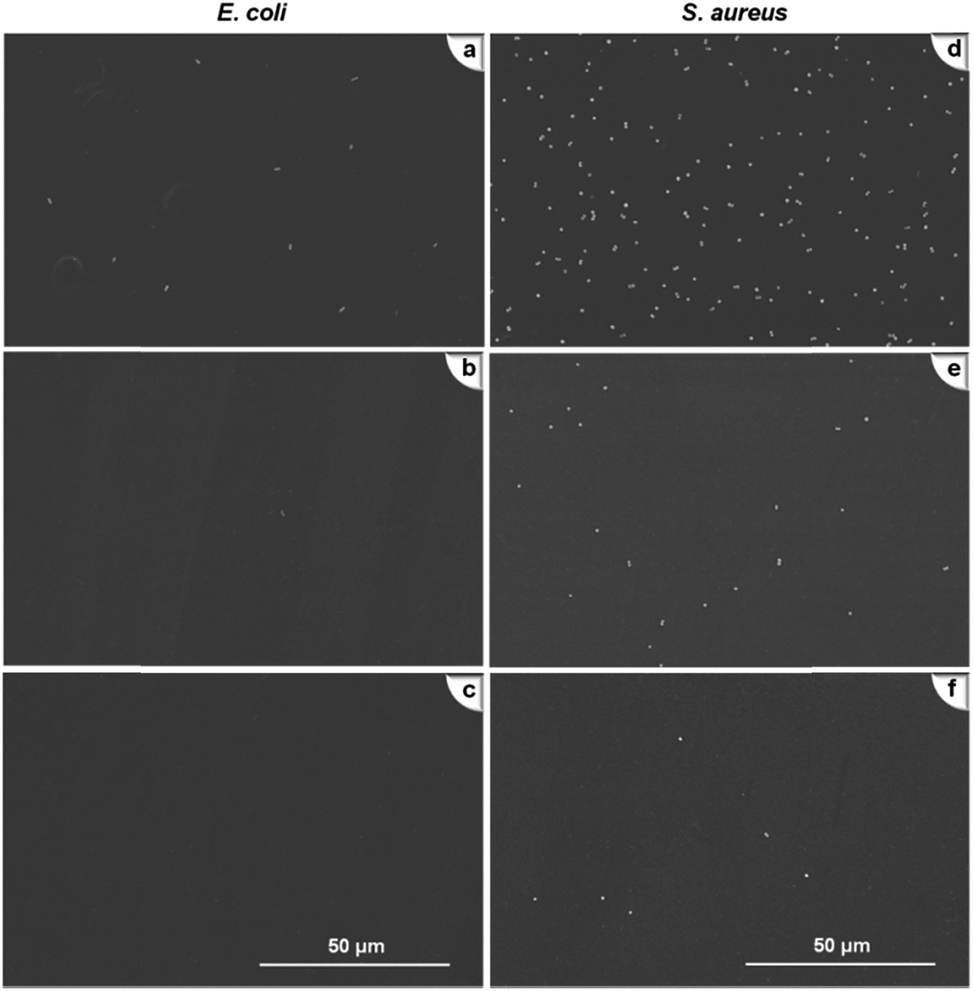
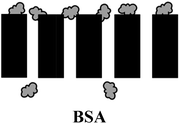
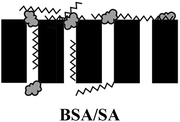
3.2.7 Anti-bacteria adhesion test. Membrane biofouling encompasses consecutive processes of bacteria cell adhesion, colonization, accumulation and eventually biofilm formation.36 Membrane resistant to bacterial adhesion may minimize the chance of biofilm formation and prolong the life of the membrane. Fig. 9 displays the membrane surfaces shaken 4 hours in bacteria suspension. It appears that E. coli (Fig. 9a–c) attached less than S. aureus (Fig. 9d–f) for the same type of membrane. The variable numbers lie in the outer membrane structures of the bacteria. There was consensus that under most physiological conditions, the bacterial cells in a natural aquatic environment carried a net negative charge.37 For Gram-negative, the cell membrane contains lipopolysaccharides (LPS), which renders E. coli more negative charge. On the basis of classic DLVO theory,38 strong repulsive interaction generated from the electrical double layer of the cell repels the E. coli from the negatively charged membrane surface, ending up with less cellular attachment.
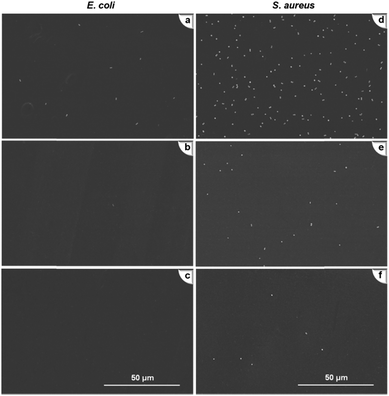 |
| | Fig. 9 SEM images of anti-bacteria adhesion tests (a–c) are Mb, M3.5 and M6.5 for E. coli; (d–f) are Mb, M3.5 and M6.5 for S. aureus after exposure to 106 cells per mL bacteria for 4 h. | |
The explicit contrasts were also made in bacteria adhesion on different membranes. Two types of bacteria, especially S. aureus, were entirely scattered on Mb (Fig. 9a and d), but very few dotted bacteria cells could be spotted over the PEM membranes (Fig. 9b, c, e and f). The results were consistent with the findings of Tang et al. on E. coli attachment on hydrophilic PEMs. Apart from the influence of the bacteria cell walls, Tang et al. ascribed the variations to the effects of hydrophilicity or wettability of polymeric membrane.14 For bare membrane with moderate hydrophilicity, the bacteria were withdrawn on the membrane via short-range van der Waals attraction.39 In comparison, a tightly bound water layer formed by the high hydration of the PEM membranes exerted an energetic barrier for bacteria to attach. In addition, when bacteria contacted with the membrane surface, compression of the swollen PEMs incurred steric repulsion and resisted the adhesion of bacteria simultaneously.9 The combined hydration and steric forces arose from f-CNTs bound PEM membranes, which jointly prevented bacteria attachment.
Another repulsive force worth mentioning was the electrostatic force of the PEM membrane. It inhibited bacteria-membrane interactions and added to the antifouling performance of the membranes. The f-CNTs undoubtedly improved the membrane negative charge as discussed above because most negatively charged M6.5 exhibited better anti-bacterial adhesion ability though they were slightly more hydrophilic than M3.5. Under these circumstances, the resistance to fouling was largely dependent on disparity in surface charge instead of membrane hydrophilicity. In another work, Liu et al. tested E. coli adhesion with heparin or a quaternary ammonium modified membrane and concluded that electrical interaction was more critical than membrane hydrophilicity in affecting the biofouling behaviors of membrane.40
As described in Section 3.2, membrane fouling and antifouling scenarios in this study were summarized and illustrated in Table 3. The gravity of fouling/anti-fouling could be speculated by the membrane surface properties in a single foulant system (Table 3ii); however, for mixed-foulant cases, the solute–solute and solute–ion interactions on membrane fouling need to be considered as well (Table 3iii).
4. Conclusions
In this work, the antifouling properties of surface-modified PES membrane were investigated. Through BSA and SA filtration together with flux recovery test, it was observed that the anti-organic fouling performances of PES membrane after the deposition of CNTs bound polyelectrolyte multilayers were improved. Although the presence of calcium ions unfavorably deteriorated the irreversible fouling and the gel layer may cause permanent damage to the membrane, the fabricated membranes exhibited reduced irreversible fouling compared to bare PES substrate. The resistance to bacterial adhesion was verified by E. coli and S. aureus attachment on the membrane surface, which guaranteed the prevention of biofilm formation on the resultant membranes. The prepared membranes possessed more hydrophilic and negatively charged surface, especially after the incorporation of f-CNTs, and the enhanced hydration force and electrostatic repulsion minimized the possible interactions with membrane and organic or bio-foulants, which thus reduced fouling. The current study has proved the potential application of f-CNTs bound PEM membranes in water treatment with antifouling properties.
Nomenclature
| A | Effective membrane area |
| BSA | Bovine serum albumin |
| B. subtilis | Bacillus subtilis |
| E. coli | Escherichia coli |
| f-CNTs | Functionalized CNTs |
| FRR | Flux recovery ratio |
| HA | Humic acid |
| Jpf | Water flux of fouled membrane after 360 min foulant filtration |
| Jwp | Water flux of cleaned membrane after water flushing |
| Jwv | Water flux of virgin membrane |
| LbL | Layer by layer |
| CNTs | Multi-walled carbon nanotube |
| PDDA | Poly(diallyldimethyl-ammonium chloride) |
| PAA | Polyacrylic acid |
| PAH | Poly(allylamine hydrochloride) |
| PBS | Phosphorous buffer saline |
| PEI | Polyethylenimine |
| PEM | Polyelectrolyte multilayer |
| PES | Polyethersulfone |
| PSS | Poly(sodium-4-styrenesulfonate) |
| PVS | Polyvinyl sulfate |
| Rir | Flux irreversible ratio |
| Rr | Flux reversible ratio |
| Rt | Total flux loss |
| SA | Sodium alginate |
| S. aureus | Staphylococcus aureus |
| TMP | Trans-membrane pressure |
| UF | Ultrafiltration |
| V | Volume of permeated water |
| Δt | Permeation time |
Acknowledgements
This work was supported by the National Research Foundation of Korea (NRF) grant funded by the Korean government (MSIP) (no. NRF-2014M3C8A4030498 and upgrade R&D).
Notes and references
- E. Drioli and E. Fontananova, Annu. Rev. Chem. Biomol. Eng., 2012, 3, 395–420 CrossRef CAS PubMed.
- M. Son, H. Choi, L. Liu, H. Park and H. Choi, Environ. Eng. Res., 2014 DOI:10.4491/eer.2014.045.
- E. Celik, H. Park, H. Choi and H. Choi, Water Res., 2011, 45, 274–282 CrossRef CAS PubMed.
- R. Jamshidi Gohari, E. Halakoo, W. J. Lau, M. A. Kassim, T. Matsuura and A. F. Ismail, RSC Adv., 2014, 4, 17587–17596 RSC.
- M. F. A. Goosen, S. S. Sablani, H. Al-Hinai, S. Al-Obeidani, R. Al-Belushi and D. Jackson, Sep. Sci. Technol., 2005, 39, 2261–2297 CrossRef PubMed.
- C. Huyskens, E. Brauns, E. Van Hoof and H. De Wever, J. Membr. Sci., 2008, 323, 185–192 CrossRef CAS PubMed.
- Y. Wang, T. Wang, Y. Su, F. Peng, H. Wu and Z. Jiang, Langmuir, 2005, 21, 11856–11862 CrossRef CAS PubMed.
- H. Ma, C. N. Bowman and R. H. Davis, J. Membr. Sci., 2000, 173, 191–200 CrossRef CAS.
- V. Kochkodan, D. J. Johnson and N. Hilal, Adv. Colloid Interface Sci., 2014, 206, 116–140 CrossRef CAS PubMed.
- G. Kalaiselvi, P. Maheswari, S. Balasubramanian and D. Mohan, Desalination, 2013, 325, 65–75 CrossRef CAS PubMed.
- M. Tamaddondar, H. Pahlavanzadeh, S. Saeid Hosseini, G. Ruan and N. R. Tan, J. Membr. Sci., 2014, 472, 91–101 CrossRef CAS PubMed.
- S. U. Hong, M. D. Miller and M. L. Bruening, Ind. Eng. Chem. Res., 2006, 45, 6284–6288 CrossRef CAS.
- C. Ba, D. A. Ladner and J. Economy, J. Membr. Sci., 2010, 347, 250–259 CrossRef CAS PubMed.
- L. Tang, W. Gu, P. Yi, J. L. Bitter, J. Y. Hong, D. H. Fairbrother and K. L. Chen, J. Membr. Sci., 2013, 446, 201–211 CrossRef CAS PubMed.
- X. Liu, S. Qi, Y. Li, L. Yang, B. Cao and C. Y. Tang, Water Res., 2013, 47, 3081–3092 CrossRef CAS PubMed.
- F. Diagne, R. Malaisamy, V. Boddie, R. D. Holbrook, B. Eribo and K. L. Jones, Environ. Sci. Technol., 2012, 46, 4025–4033 CrossRef CAS PubMed.
- W. S. Ang, A. Tiraferri, K. L. Chen and M. Elimelech, J. Membr. Sci., 2011, 376, 196–206 CrossRef CAS PubMed.
- M. Beyer, B. Lohrengel and L. D. Nghiem, Desalination, 2010, 250, 977–981 CrossRef CAS PubMed.
- M. Hashino, K. Hirami, T. Katagiri, N. Kubota, Y. Ohmukai, T. Ishigami, T. Maruyama and H. Matsuyama, J. Membr. Sci., 2011, 379, 233–238 CrossRef CAS PubMed.
- L. Liu, M. Son, H. Park, E. Celik, C. Bhattacharjee and H. Choi, RSC Adv., 2014, 4, 32858–32865 RSC.
- Y. Baek, J. Kang, P. Theato and J. Yoon, Desalination, 2012, 303, 23–28 CrossRef CAS PubMed.
- R. Malaisamy, A. Talla-Nwafo and K.
L. Jones, Sep. Purif. Technol., 2011, 77, 367–374 CrossRef CAS PubMed.
- M. Elzbieciak, M. Kolasinska and P. Warszynski, Colloids Surf., A, 2008, 321, 258–261 CrossRef CAS PubMed.
- P. Ying, G. Jin and Z. Tao, Colloids Surf., B, 2004, 33, 259–263 CrossRef CAS PubMed.
- K. Katsoufidou, S. G. Yiantsios and A. J. Karabelas, J. Membr. Sci., 2007, 300, 137–146 CrossRef CAS PubMed.
- B. Mi and M. Elimelech, J. Membr. Sci., 2008, 320, 292–302 CrossRef CAS PubMed.
- L. D. Nghiem, P. J. Coleman and C. Espendiller, Desalination, 2010, 250, 682–687 CrossRef CAS PubMed.
- R. Chan, V. Chen and M. P. Bucknall, Biotechnol. Bioeng., 2004, 85, 190–201 CrossRef CAS PubMed.
- S. Lee, W. S. Ang and M. Elimelech, Desalination, 2006, 187, 313–321 CrossRef CAS PubMed.
- H. Susanto, H. Arafat, E. M. L. Janssen and M. Ulbricht, Sep. Purif. Technol., 2008, 63, 558–565 CrossRef CAS PubMed.
- D. Jermann, W. Pronk, S. Meylan and M. Boller, Water Res., 2007, 41, 1713–1722 CrossRef CAS PubMed.
- F. Neemann, S. Rosenberger, B. Jefferson and E. J. McAdam, J. Membr. Sci., 2013, 446, 310–317 CrossRef CAS PubMed.
- Q. Li, Z. Xu and I. Pinnau, J. Membr. Sci., 2007, 290, 173–181 CrossRef CAS PubMed.
- M. Mänttäri, L. Puro, J. Nuortila-Jokinen and M. Nyström, J. Membr. Sci., 2000, 165, 1–17 CrossRef.
- A. Seidel and M. Elimelech, J. Membr. Sci., 2002, 203, 245–255 CrossRef CAS.
- X. Zhang, L. Wang and E. Levanen, RSC Adv., 2013, 3, 12003–12020 RSC.
- S. L. Walker, J. A. Redman and M. Elimelech, Langmuir, 2004, 20, 7736–7746 CrossRef CAS PubMed.
- M. Hermansson, Colloids Surf., B, 1999, 14, 105–119 CrossRef CAS.
- G. Speranza, G. Gottardi, C. Pederzolli, L. Lunelli, R. Canteri, L. Pasquardini, E. Carli, A. Lui, D. Maniglio, M. Brugnara and M. Anderle, Biomaterials, 2004, 25, 2029–2037 CrossRef CAS PubMed.
- C. X. Liu, D. R. Zhang, Y. He, X. S. Zhao and R. Bai, J. Membr. Sci., 2010, 346, 121–130 CrossRef CAS PubMed.
|
| This journal is © The Royal Society of Chemistry 2015 |
Click here to see how this site uses Cookies. View our privacy policy here. 


 : BSA;
  : SA;
: SA;  : calcium ion (Ca2+);
  : bacteria;
  : PES membranes;
  : PEMs;
  : f-CNTs.