
Anisotropic vacancy-defect-induced fracture strength loss of graphene
Xiao-Yu Sun*a,
Heng Hua,
Changyong Caob and
Yuan-Jie Xua
aDepartment of Engineering Mechanics, School of Civil Engineering, Wuhan University, Wuhan 430072, China. E-mail: xiaoyusun@whu.edu.cn; Fax: +86 27 68775328; Tel: +86 27 68772294
bDepartment of Mechanical Engineering and Materials Science, Duke University, Durham, NC 27708, USA
First published on 21st January 2015
Abstract
The mechanical strength of graphene is much larger than any other materials, but is orientation-dependent and can be significantly weakened by vacancy defects existing in the lattices. In this work, we investigated the orientational anisotropic effect on the fracture strength of vacancy-defective graphene using molecular dynamics simulations. The results show that the fracture strength of graphene at the orientation angle of 15° has the smallest sensitivity to vacancy defects due to the minimization of stress concentration in this direction. Although the fracture strength of defect-free graphene in the zigzag direction is larger than that in the armchair direction, the fracture strength in the zigzag direction is much more sensitive to the vacancy defects. This study is helpful not only for understanding the physical properties of defective graphene but also providing guidance for developing graphene-based materials or devices in engineering.
1. Introduction
Graphene, a two-dimensional monolayer graphite, has attracted intensive research interest during the past decade owing to its unprecedented mechanical, thermal, electric and optical properties.1–9 For example, the tensile strength of pristine graphene is over 100 GPa and its Young's modulus can reach up to 1 TPa,2,3 much stronger than any other materials that have been discovered. The outstanding mechanical properties of graphene have been explored for a broad range of applications such as graphene nanocomposites,7 chemical sensors,5 supercapacitors,8,9 surface coatings,4 and nanoelectronics.1,6 However, in preparing the graphene for all these applications, the defects in the graphene lattice, such as vacancy defects,10 impurity defects,11 and absorption defects,12 are inevitable due to the production process13,14 and the environmental/operation conditions.15 On the other hand, defect engineering of graphene is also employed to modify graphene with novel functions in nanoelectronics and biodevices.15,16 Therefore, it is of fundamental importance to understand the mechanical properties of defective graphene for developing novel graphene-based materials or devices under various operation conditions.The failure strength of graphene has been investigated using both experimental and numerical methods, including atomic force microscopy (AFM) nanoindentation,2 molecular dynamics (MD) simulation17,18 and finite element method19 etc. It has been reported that graphene exhibits distinct anisotropic mechanical behaviors because of its hexagonal network structure.20–22 Zhao et al.23 investigated the mechanical strength of graphene under uniaxial tensile test by combining MD simulations and tight-binding (TB) method, and found that the fracture strength of monolayer graphene in zigzag direction is 18.8% larger than that under armchair-directional elongation. Mortazavi et al.24 performed MD simulations to study the orientation-dependency of the fracture property of graphene. Their results have shown that the ultimate tensile strength increases as the loading direction transits from armchair to zigzag direction. Jhon et al.25 systematically studied the fracture behavior of graphene under uniaxial tensile loading in varying directions. They found that as the applied tensile loading rotates by an angle of ∼12° from the armchair (0°) direction, the fracture strength of graphene is almost constant up, and then increase dramatically until the loading direction reaches at the zigzag direction (30°).25
Simulations and quantized fracture mechanics have shown that the fracture strength of graphene is sensitive to vacancy defect and a remarkable loss of fracture strength can be occurred by the presence of vacancy defect.26–28 However, little is known on the sensitivity of the fracture strength of defective graphene in various directions, and most previous studies on the orientation-dependent fracture behavior of graphene have been mainly devoted to defect-free graphene.23,25 Therefore, in this letter, we perform MD simulations to study the orientational anisotropic effect on the fracture strength of a monolayer graphene sheet with a central vacancy defect and to explore the underlying deformation mechanism.
2. Methods
The carbon atoms in a graphene sheet are arranged in a honeycomb lattice. As shown in Fig. 1a, the orientation of graphene can be described by a chiral vector C = na1 + ma2, where a1 and a2 are the unit vectors of the graphene lattice, n and m are two integers.18 The integer pair (n, m), called the chiral index, defines a chiral vector. Orientation (n, n) and (n, 0) are mapping to the armchair and zigzag direction, respectively. The angle between the armchair direction (n, m) and the arbitrary direction (n, m) is called the orientation angle θ, which is in the range of 0° ≤ θ ≤ 30° due to the six-fold rotation symmetry of the graphene atomic lattice. Thus, the orientation angle θ for the armchair and zigzag directions are 0° and 30°, respectively. | ||
| Fig. 1 Simulation model. (a) Orientation of graphene. The orientation angle θ is defined as the angle between the armchair direction and the tensile loading direction. (b) MD model of graphene in uniaxial tension test. The displacement loading condition is applied by stretching the periodic simulation box in the x direction. (c) Enlarged view of boundary. Coordinates of carbon atoms closed to the boundary are discreetly examined to avoid unwanted atom losses or overlaps. (d) Enlarged drawing of vacancy defect, introduced by deleting the carbon atom in the center of graphene sheet. | ||
Here we consider a single graphene sheet with a central vacancy defect for the simulation, as shown in Fig. 1b. The system dimensions of the graphene sheet are L = 200 Å and W = 200 Å. In this work, eleven typical tensile orientations and their corresponding chiral index (n, m), as listed in Table 1, are selected for investigating the orientation dependence of the fracture strength of the defective graphene sheet. We define x-axis along the loading direction, and z-axis normal to the graphene plane. Period boundary conditions are applied in all the three directions to remove boundary effect. Fig. 1c shows the enlarged view of boundary. Coordinates of carbon atoms near the boundary are carefully checked to ensure exactly one atom at the boundaries (on either side of the simulation box), and to avoid unwanted atom overlaps or losses at the boundaries. The enlarged drawing of vacancy defect is depicted in Fig. 1d. Atoms around the vacancy defect are painted as red color. The vacancy defect in the simulation model is generated as follows. Firstly, the coordinates of carbon atoms are checked to seek the center atom; and secondly, this center atom is moved out from the graphene sheet.
| Orientation angle θ (°) | Chiral index (n, m) |
|---|---|
| 0 | (1, 1) |
| 3.67 | (6, 5) |
| 5.82 | (10, 7) |
| 8.95 | (7, 4) |
| 12.01 | (13, 6) |
| 14.70 | (8, 3) |
| 17.78 | (7, 2) |
| 21.05 | (5, 1) |
| 23.82 | (15, 2) |
| 27.00 | (16, 1) |
| 30 | (1, 0) |
We perform MD simulations using LAMMPS package with the adaptive interatomic reactive empirical bond-order (AIREBO)29 potential. This potential has been demonstrated to be quite useful in describing the interactions of carbon atoms in the graphene or other carbon materials.30,31 In LAMMPS, the default value of C–C bond cutoff distance in the switching function for the AIREBO potential is 1.70 Å. Using such a cutoff distance, however, may result in unphysical simulation results, e.g. higher bond forces before cracking.23 Thus, to avoid spurious post-hardening mechanical behaviors, Jhon et al.25 adjusted the cutoff distance in AIREBO potential to 2.0 Å, and Carpenter et al.26 selected the cut-off distance to be 1.92 Å. Recently, He et al.32 systematically studied the relationship between the tensile strength and C–C bond cutoff distance in MD simulation of graphene, and finally selected the cut-off distance of 1.95 Å. In this work, we select the same value as they recommended in their work.
Before loading, the defective graphene is relaxed to the minimum energy configuration using conjugate gradient method. Then, the system is thermally equilibrated by employing a Nosé–Hoover thermostat for 50 ps. After relaxation, uniaxial tension of displacement loading is applied by stretching the cubic box along the x direction. The strain rate of loading is set as 109 s−1, which is commonly used in MD simulations.33,34 We run all the simulations at the temperatures of 1 K and 300 K, respectively. To avoid thermal noise in the case of 300 K, we present the simulation results of 1 K in this work. The time step is chosen as 1 fs, and the atomic stresses are calculated using Virial theorem.35 The calculations performed with the system are carried out in a parallelized simulation environment, where multiple processors are used to solve the equations of motion. Visualization is carried out by using the Visual Molecular Dynamics (VMD)36 tool.
3. Results and discussions
The tensile stress–strain curves for the defective graphene under various loading directions are shown in Fig. 2a. As the applied strain increases, the stress increases until it reaches the maximum value, which is assumed to be fracture strength σf. It can be seen that the resulting tensile strength increases when loading direction transits from armchair direction to zigzag direction. The fracture strength of the defective graphene in zigzag direction (30°) is 110.5 GPa, 20.9% larger than that of graphene in armchair direction (0°).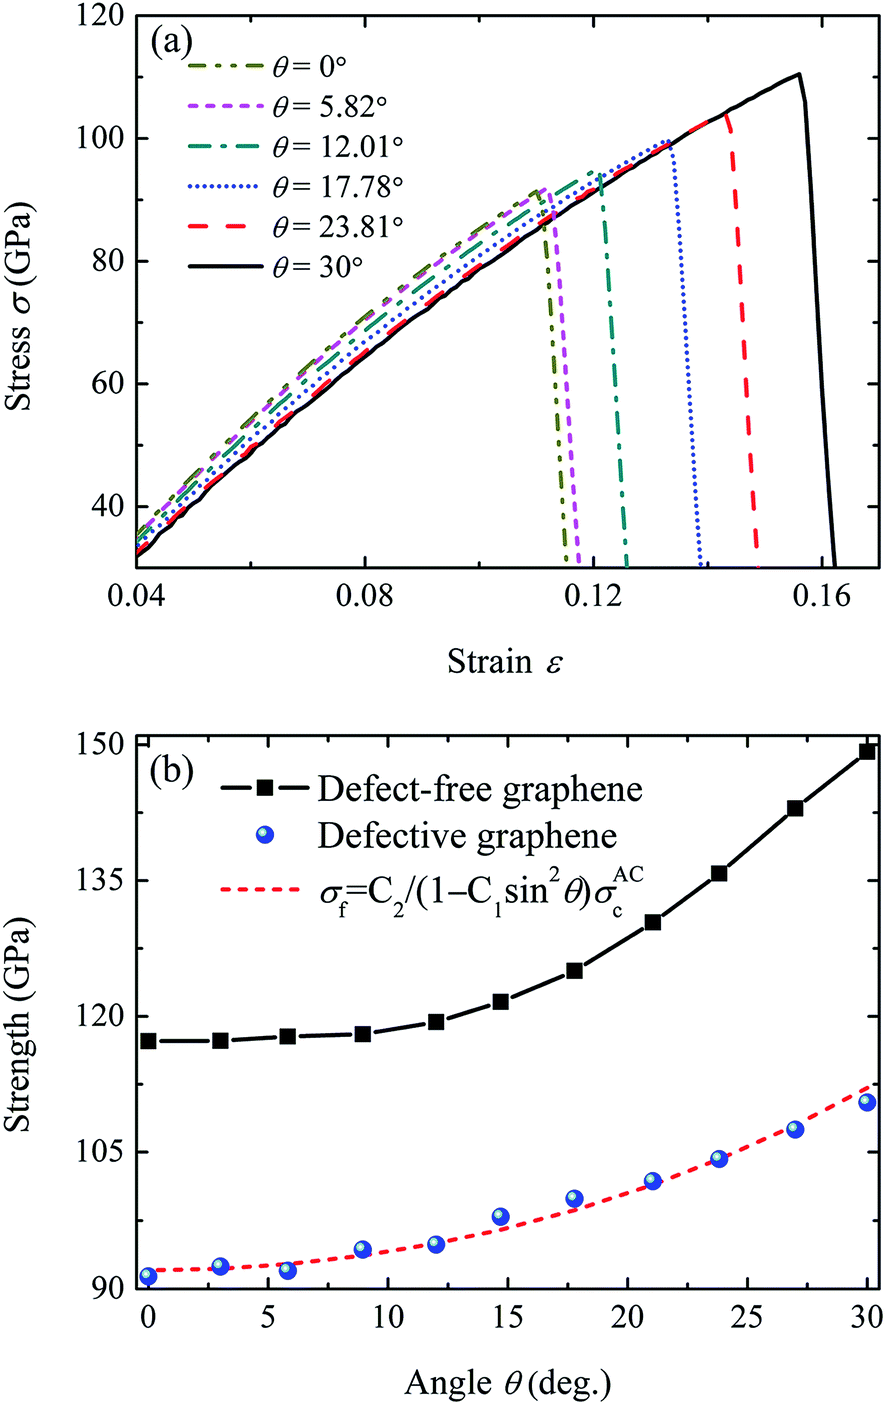 | ||
| Fig. 2 Orientational anisotropic effect on the fracture strength of vacancy-defective graphene. (a) Tensile stress–strain curves of the graphene sheet with a vacancy defect in the center subjected to tensile loadings in various directions. The orientation angle θ can be changed from 0° (armchair) to 30° (zigzag) due to the six-fold rotation symmetry of graphene. (b) Relationship between fracture strength of defect-free graphene and the orientation angle θ. | ||
The fracture strength of the defective graphene as a function of the orientation angle θ is plotted in Fig. 2b. For comparison, we also simulated the fracture behavior of defect-free graphene. The dependence of fracture strength of defect-free graphene on the orientation angle θ is given in Fig. 2b. It is observed that both the defect-free and defective graphene exhibit a clear dependence on orientation. For defect-free graphene, Jhon et al.25 proposed a fracture model to predict the relationship between the fracture strength σc and the orientation angle θ,
 | (1) |
 | (2) |
 | (3) |
 | (4) |
For longer crack length n > 1, the crack tip radius ρ(n) is different from ρ(n = 1). So the parameter C2(n = 1) fitted from simulation result can't be extended to the larger crack (n > 1).
To discuss the effect of vacancy defect on the fracture strength of various orientations, a relative strength is defined as the ratio of the fracture strength of defective graphene and that of defect-free graphene, i.e., η = σf/σc. In eqn (2), the quantized fracture model does not take the orientational anisotropic effect into account, i.e., the ratio η = σf/σc in each direction is considered to be a constant C2. However, we find that this ratio is sensitive and dependent on the orientation angle θ. Fig. 3 shows the variation of η as a function of θ. It can be observed that η in the armchair and zigzag direction are 0.78 and 0.74, respectively. As the uniaxial tensile loading rotates from armchair direction (0°) to zigzag direction (30°), the fracture strength oscillatingly increases to 0.81 at an orientation angle of ∼15°, then they dramatically decrease to 0.74 at the orientation angle of 30°. The defective graphene has the largest ratio η = 0.81 at an orientation angle of ∼15°, indicating that graphene has the least vacancy-defect-induced loss of fracture strength in this direction. On the other side, although the fracture strength in the zigzag direction is larger than that in the armchair direction, the fracture strength in the zigzag direction is more sensitive to the vacancy defect.
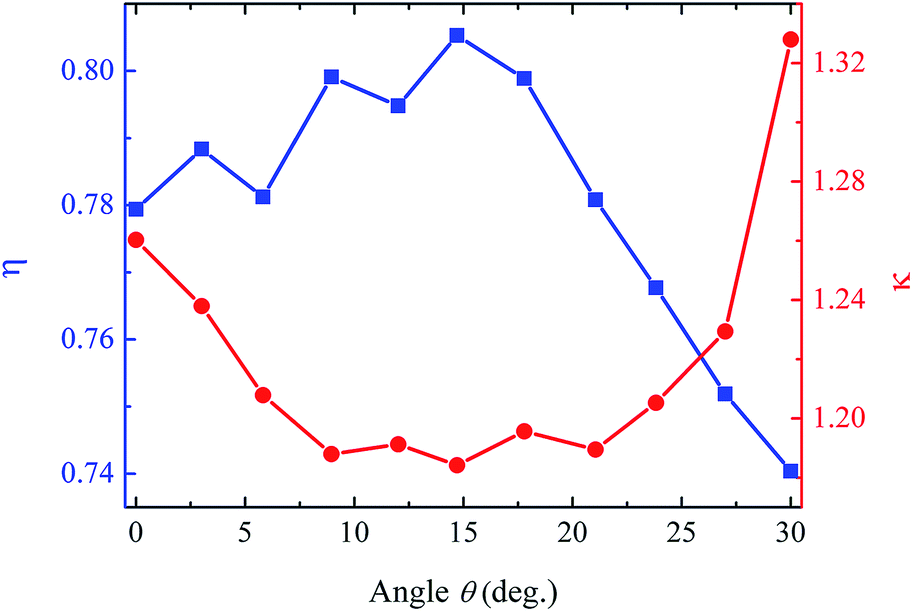 | ||
| Fig. 3 Relative strength ratio η and stress concentration parameter κ as functions of orientation angle θ for graphene with the 1-vacancy defect. There exists an optimal orientation angle θ = 15°, at which the graphene has the minimum stress concentration and largest relative strength. | ||
The initial failure states and their corresponding stress distributions for different orientation angles are shown in Fig. 4 to identify the underlying mechanism responsible for the observed behavior. It is obvious that there exists a significant stress concentration around the vacancy defect, which will induce the nucleation of crack. Carbon atoms with the maximum stresses are located in the y direction (perpendicular to the loading direction) around the vacancy defect, while the atoms with minimum stresses are located in the x direction (along the tensile direction). The maximum stresses of the vacancy defective graphene with orientation angles θ = 0°, 15° and 30° are 130.6, 128.5, 148.3 GPa, respectively.
 | ||
| Fig. 4 Initial failure states and their corresponding stress distributions at different orientation angles (a) θ = 0°, (b) θ = 15° and (c) θ = 30°. Carbon atoms in graphene are colored according to the magnitude of their stresses. | ||
In order to describe the stress concentration for different orientations, herein we defined a new parameter κ = σt/σa, in which σt is the average stress for the atoms with the top percentage of stresses (e.g., top 0.1%), σa is the average stress of all the atoms. Therefore, a larger κ indicates an uneven distribution of the stress among the atoms while a smaller κ means a more uniform distribution. The relationship between stress concentration parameter κ and orientation angle θ is given in Fig. 3. As the orientation angle increases from 0° to 15°, the stress concentration parameter κ reduces from 1.26 to 1.18, which indicates a relative variation about 6.8%. As the orientation angle θ further increases, the stress concentration parameter κ increases to 1.33, indicating that there is an optimal orientation angle θ = 15° for the defective graphene to have the minimum stress concentration and largest relative strength.
To identify whether the intrinsic material property or the local curvature of the defect causes the orientational anisotropic effect, the fracture strength of a graphene with a larger defect is calculated. As depicted in the inset of Fig. 5, the number of the vacancy is 3 and this 3-vacancy defect is placed in the center of the graphene. Carbon atoms around the 3-vacancy defect are colored in red. The 3-vacancy defect is more closer to the round shape than 1-vacancy defect. The parameter η = σf/σc of graphene with the 3-vacancy defect as a function of the tensile direction θ is shown in Fig. 5. η can be used to describe the sensibility to defect. It is observed that η for graphene with the 3-vacancy defect is in the range of [0.67, 0.71]. The interval is 0.04, which is much less than that for graphene with the 1-vacancy defect. η for graphene with the 3-vacancy defect shows an weak dependence upon the tensile direction θ, means that the main reason for orientational anisotropic effect is the local curvature of defect. Moreover, the shape and the orientation of the vacancy are relevant. It is should be noted that non-hexagonal carbon rings also exist in graphene. For non-hexagonal carbon rings, the tilting angles and orientation effects of Stone–Thrower–Wales (5-7-7-5) defects on the mechanical properties of graphene have been investigated.32 The fracture strength of STW defective graphene decreases when the tilting angle increases. The shape-orientation coupling for vacancy structures with non-hexagonal carbon rings is complicated, which will be further explored in future work.
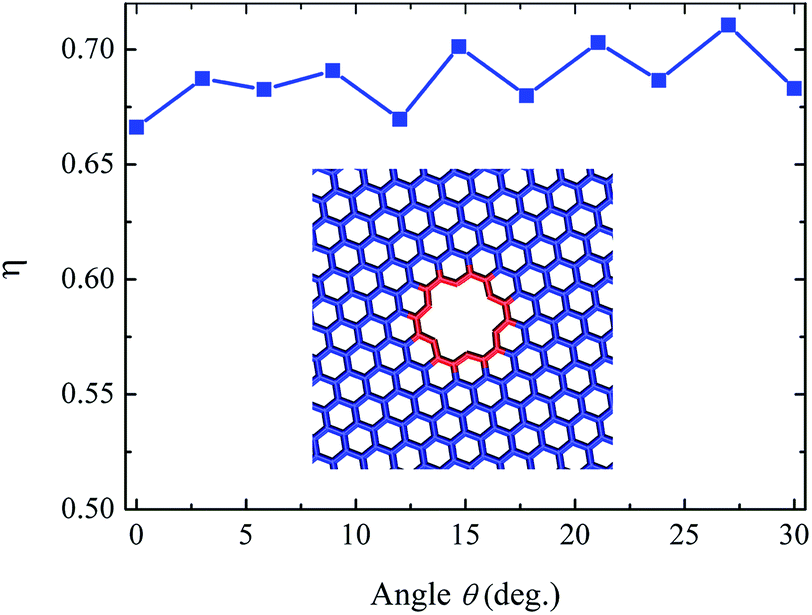 | ||
| Fig. 5 Relative strength ratio η as a function of orientation angle θ for graphene with the 3-vacancy defect. Inset shows the simulation model of 3-vacancy defect. | ||
4. Conclusions
In summary, we have used MD simulations to explore the unique anisotropic vacancy-defect-induced fracture strength loss of graphene. Simulations results showed that the fracture strength in the zigzag direction is more sensitive to the vacancy defect than that in the armchair direction. We also found that the fracture strength of the vacancy-defective graphene has the least sensitivity to the defect at the orientation angle θ = 15°. Our findings are helpful in understanding the orientation-dependent properties of defective graphene and in developing new graphene-based devices for practical applications.Acknowledgements
This work was supported by China Postdoctoral Science Foundation (Grant no. 2014M562055), the Open Research Fund Program (Grant no. 2042014kf0002) of Wuhan University. C.C. acknowledges the financial support from the Office of Naval Research (Grant N00014-10-1-0907) and NSF's Research Triangle MRSEC (DMR-1121107).References
- M. Freitag, Nat. Nanotechnol., 2008, 3, 455 CrossRef CAS PubMed.
- C. Lee, X. Wei, J. W. Kysar and J. Hone, Science, 2008, 321, 385 CrossRef CAS PubMed.
- G. H. Lee, R. C. Cooper, S. J. An, S. Lee, A. van der Zande, N. Petrone, A. G. Hammerberg, C. Lee, B. Crawford and W. Oliver, Science, 2013, 340, 1073 CrossRef CAS PubMed.
- D. Prasai, J. C. Tuberquia, R. R. Harl, G. K. Jennings and K. I. Bolotin, ACS Nano, 2012, 6, 1102 CrossRef CAS PubMed.
- F. Schedin, A. K. Geim, S. V. Morozov, E. W. Hill, P. Blake, M. I. Katsnelson and K. S. Novoselov, Nat. Mater., 2007, 6, 652 CrossRef CAS PubMed.
- F. Schwierz, Nat. Nanotechnol., 2010, 5, 487 CrossRef CAS PubMed.
- S. Stankovich, D. A. Dikin, G. H. B. Dommett, K. M. Kohlhaas, E. J. Zimney, E. A. Stach, R. D. Piner, S. T. Nguyen and R. S. Ruoff, Nature, 2006, 442, 282 CrossRef CAS PubMed.
- M. D. Stoller, S. J. Park, Y. W. Zhu, J. An and R. S. Ruoff, Nano Lett., 2008, 8, 3498 CrossRef CAS PubMed.
- J. F. Zang, C. Y. Cao, Y. Y. Feng, J. Liu and X. H. Zhao, Sci. Rep., 2014, 4, 6492 CrossRef PubMed.
- A. Hashimoto, K. Suenaga, A. Gloter, K. Urita and S. Iijima, Nature, 2004, 430, 870 CrossRef CAS PubMed.
- K. Brenner and R. Murali, Appl. Phys. Lett., 2011, 98, 113115 CrossRef PubMed.
- C. Ataca, E. Aktürk, H. Şahin and S. Ciraci, J. Appl. Phys., 2011, 109, 013704 CrossRef PubMed.
- Y. M. Chang, H. Kim, J. H. Lee and Y. W. Song, Appl. Phys. Lett., 2010, 97, 211102 CrossRef PubMed.
- S. Badhwar, J. Sibik, P. R. Kidambi, H. E. Beere, J. A. Zeitler, S. Hofmann and D. A. Ritchie, Appl. Phys. Lett., 2013, 103, 121110 CrossRef PubMed.
- A. Zandiatashbar, G. Lee, S. J. An, S. Lee, N. Mathew, M. Terrones, T. Hayashi, C. R. Picu, J. Hone and N. Koratkar, Nat. Commun., 2014, 5, 3186 Search PubMed.
- S. Garaj, W. Hubbard, A. Reina, J. Kong, D. Branton and J. A. Golovchenko, Nature, 2010, 467, 190 CrossRef CAS PubMed.
- H. Bu, Y. Chen, M. Zou, H. Yia, K. Bi and Z. Ni, Phys. Lett. A, 2009, 373, 3359 CrossRef CAS PubMed.
- F. Hao, D. N. Fang and Z. P. Xu, Appl. Phys. Lett., 2011, 99, 041901 CrossRef PubMed.
- S. K. Georgantzinos, G. I. Giannopoulos, D. E. Katsareas, P. A. Kakavas and N. K. Anifantis, Comput. Mater. Sci., 2011, 50, 2057 CrossRef CAS PubMed.
- T. Ma, B. Li and T. Chang, Appl. Phys. Lett., 2011, 99, 201901 CrossRef PubMed.
- K. Min and N. R. Aluru, Appl. Phys. Lett., 2011, 98, 013113 CrossRef PubMed.
- L. Wang and Q. Zhang, Curr. Appl. Phys., 2012, 12, 1173 CrossRef PubMed.
- H. Zhao, K. Min and N. R. Aluru, Nano Lett., 2009, 9, 3012 CrossRef CAS PubMed.
- B. Mortazavi, S. Ahzi, V. Toniazzo and Y. Rémond, Phys. Lett. A, 2012, 376, 1146 CrossRef CAS PubMed.
- Y. I. Jhon, Y. M. Jhon, G. Y. Yeom and M. S. Jhon, Carbon, 2014, 66, 619 CrossRef CAS PubMed.
- C. Carpenter, D. Maroudas and A. Ramasubramaniam, Appl. Phys. Lett., 2013, 103, 013102 CrossRef PubMed.
- M. C. Wang, C. Yan, L. Ma, N. Hu and M. W. Chen, Comput. Mater. Sci., 2012, 54, 236 CrossRef CAS PubMed.
- R. Khare, S. Mielke, J. Paci, S. Zhang, R. Ballarini, G. Schatz and T. Belytschko, Phys. Rev. B: Condens. Matter Mater. Phys., 2007, 75, 075412 CrossRef.
- S. J. Stuart, A. B. Tutein and J. A. Harrison, J. Chem. Phys., 2000, 112, 6472 CrossRef CAS PubMed.
- J. Kotakoski, F. R. Eder and J. C. Meyer, Phys. Rev. B: Condens. Matter Mater. Phys., 2014, 89, 201406 CrossRef.
- X. Li, J. Chen, C. Yu and G. Zhang, Appl. Phys. Lett., 2013, 103, 013111 CrossRef PubMed.
- L. He, S. Guo, J. Lei, Z. Sha and Z. Liu, Carbon, 2014, 75, 124 CrossRef CAS PubMed.
- Y. Dong, Y. He, Y. Wang and H. Li, Carbon, 2014, 68, 742 CrossRef CAS PubMed.
- T. Tang, S. Kim, J. B. Jordon, M. F. Horstemeyer and P. T. Wang, Comp. Mater. Sci., 2011, 50, 2977 CrossRef CAS PubMed.
- A. J. Cao and Y. G. Wei, Phys. Rev. B: Condens. Matter Mater. Phys., 2006, 74, 214108 CrossRef.
- W. Humphrey, A. Dalke and K. Schulten, J. Mol. Graphics, 1996, 14, 33 CrossRef CAS.
| This journal is © The Royal Society of Chemistry 2015 |