 Open Access Article
Creative Commons Attribution 3.0 Unported Licence
Pushing the limits for enzyme-based membrane-less hydrogen fuel cells – achieving useful power and stability†
Lang
Xu
and
Fraser A.
Armstrong
*
Inorganic Chemistry Laboratory, Department of Chemistry, University of Oxford, South Parks Road, Oxford OX1 3QR, UK. E-mail: fraser.armstrong@chem.ox.ac.uk
First published on 11th December 2014
Abstract
The performance characteristics of simple enzyme-based membrane-less hydrogen fuel cells running on non-explosive H2-rich air mixtures have been established using an adjustable test bed that allows multiple unit cells to operate in series or parallel. Recent advances with ‘3D’ electrodes constructed from compacted porous carbon loaded with hydrogenase (anode) and bilirubin oxidase (cathode) have been extended in order to scale up fuel cell power to useful levels. One result is an appealing ‘classroom’ demonstration of a model house containing small electronic devices powered by H2 mixed with a small amount of air. The 3D electrodes work by greatly increasing catalyst loading (at both the anode and cathode) and selectively restricting the access of O2 (relative to H2) to enzymes embedded in pores at the anode. The latter property raises the possibility of using standard hydrogenases that are not O2-tolerant: however, experiments with such an enzyme reveal good short-term performance due to restricted O2 access, but low long-term stability because the root cause of O2 sensitivity has not been addressed. Hydrogenases that are truly O2 tolerant must therefore remain the major focus of any future enzyme-based hydrogen fuel cell technology.
Introduction
Isolation and characterization of O2-tolerant [NiFe]-hydrogenases that are able to catalyze H2 oxidation in the presence of O2 has stimulated new concepts in hydrogen fuel cells.1–7 Not only do enzymes prove the feasibility of replacing platinum metal catalysts with ones derived from abundant elements (indeed the active sites of enzymes are more active than Pt8–11) but their high selectivity lends itself to simple, membrane-less fuel cells that could be miniaturized, thus compensating for the large footprint of the catalyst.12–15 Our focus is therefore on membrane-less cells. Although commercial development is, even optimistically, a long way ahead (depending on achieving high levels of miniaturization, long-term stability and identification of a niche use) orders-of-magnitude improvements have been made since the demonstrations, in 2005 and 2006, of an enzyme-based membrane-less H2 fuel cell running in the presence of CO16 or on a non-explosive H2-weak–air-rich mixture (3% H2 in air).17 The H2-weak–air-rich mixture proved problematic because even an O2-tolerant hydrogenase is overwhelmed by O2 under low-load conditions,18 but no such problem was encountered when using a non-explosive H2-rich–air-weak mixture (80% H2 in air). Since 2010, power densities and lifetimes of enzyme-based, membrane-less H2 fuel cells have advanced in two stages. It was demonstrated that a reasonably stable power density of 0.1 mW cm−2 (based on the anode area) could be achieved by covalently attaching a hydrogenase and a ‘blue’ Cu oxidase to graphite electrodes modified with multi-walled carbon nanotubes.19 Then, in a subsequent development, Xu and Armstrong used 3D compacted mesoporous carbon electrodes with re-proportioned anode/cathode areas to increase the power density up to 1.7 mW cm−2 (based on geometric area of anode) with an extended half-life of approximately one week.20 Porous 3D electrodes (we use ‘CPC’ as a general abbreviation for different types of compacted porous carbon) increase the number of reaction sites per unit geometric electrode area, thus substantially raising power density.21–27 The enzyme molecules permeate deeply, leading to a greatly enhanced catalyst loading, while the porous channels are interconnected and open to the surface.20 Varying the relative sizes of anode and cathode further increases power output which is otherwise limited by the low O2 level.Oxygen tolerance of the hydrogenase that is used as the anodic electrocatalyst is an essential requirement for all enzyme-based H2 fuel cells, even if a membrane is used (due to unavoidable O2 crossover). All hydrogenases characterized to date are inactivated or permanently damaged by O2 and/or high potentials,28 and even robustly O2-tolerant [NiFe]-hydrogenases such as Hydrogenase-1 (Hyd-1) from Escherichia coli, have a lower, yet stable, activity when O2 is present, provided the potential is not taken too high.3 The O2-tolerance of [NiFe]-hydrogenases originates from the following features:29 (i) availability of additional electron sources close to the active site that can be immediately recruited to ensure the complete reduction of an attacking O2 molecule to harmless water, resulting in formation of a oxidized Ni(III)–OH species (a ‘resting state’) known as Ni–B, (ii) fast recovery of activity by rapid one-electron reduction of Ni–B, upon which the enzyme re-joins the catalytic cycle, (iii) limiting the access of O2 to the active site (via restrictions in internal gas channels). The fractional current level f (measured relative to the current for 100% H2) that can be maintained under O2 is given by the expression f = rate(act)/[rate(act) + rate(inact)] where rate(inact) is the rate of inactivation by O2 and rate(act) is the rate of reactivation.30 The term rate(inact) increases with increasing O2 concentration whereas rate(act) increases as the potential is lowered, and both rate(inact) and rate(act) are affected in a more complex way, by the concentration of H2. Hence f is increased by impeding O2 access to the active site and increasing the electron availability for reactivation.
It is thus timely to consider further interesting implications of developing membrane-less H2 fuel cells with CPC electrodes. We have therefore investigated the minimum configuration, using multiples of simple unit cells arranged in parallel or series, that is required to produce useful power (i.e. sufficient to run small electronic devices). A test bed has been constructed, in which parallel and series connections of sandwich-like electrode stacks can be varied. As explained below, powers are reported in mW per total cell volume as well as in mW per area (geometric electrode area), although no attempt has been made to optimize volume power density (see below) as we focused on having sufficient space to manipulate the cells easily. Secondly, we have addressed the issue of whether CPC electrodes can usefully improve the O2 tolerance of O2-sensitive (standard) hydrogenases (which usually have higher activity) an idea that complements, in a timely way, a recent paper by Plumeré et al., who found that embedding an O2-sensitive hydrogenase into a viologen-based redox hydrogel significantly improved its O2 tolerance.31
Results and discussion
Test bed structure
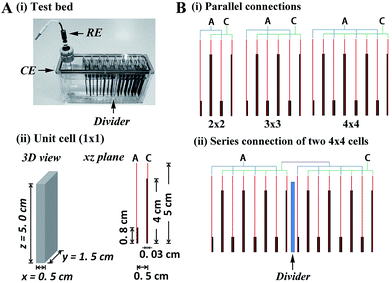
The test bed shown in Fig. 1A(i) consists of 16 rectangular stainless steel plates (1.5 cm × 5 cm) separated by 0.5 cm, with CPC electrode plates (thickness 0.3 mm) attached to the side of each plate by conductive adhesive. Conceptually, there are three components – unit cell, parallel multi-cell, and series multi-cell. The unit cell (denoted 1 × 1; total volume 3.75 cm3) contains one anodic plate and one cathodic plate (Fig. 1A(ii)). Enzymes were applied to anode and cathode as described in Methods. To balance the anodic and cathodic activities in the non-explosive H2–air mixture, the area ratio of anode to cathode was re-proportioned in each unit cell: thus the cathodes (modified with bilirubin oxidase (BOD) from Myrothecium verrucaria) were 4 × 1.5 cm while the anodes (modified with Hyd-1) were smaller, at 0.8 × 1.5 cm. The additional 1 cm of exposed stainless steel plate (electrochemically inert) above the cathode was required so that the H2–air mixture could be bubbled into each cell without losing electrolyte. In the parallel multi-cells, 2, 3 or 4 anodic plates and 2, 3 or 4 cathodic plates were connected (denoted 2 × 2, 3 × 3, 4 × 4) to contain 3, 5 or 7 unit cells, respectively (Fig. 1B(i)). For a series multi-cell, a divider was used to separate the electrolyte solutions (Fig. 1B(ii)). Reductive activation of Hyd-1 was carried out electrochemically, as described previously,19 by connecting the anodes to a potentiostat and inserting reference and counter electrodes at one side of the divider (Fig. 1A(i)). Before activating Hyd-1, the solution was raised above the central divider to connect all the cells; then after activation was complete, the level was lowered to isolate the cells series-wise. Volume power density was calculated by dividing total power by the total volume of the cells (3.75 cm3 for each unit cell).3D CPC electrodes
The 3D CPC electrodes were made by compacting graphite (G), multi-walled carbon nanotubes (MCNT), or mixtures of both (G/MCNT). Fig. 2(i) shows typical N2 adsorption–desorption isotherms of compacted 100% G, 60/40 G/MCNT, and 100% MCNT electrodes. The three N2 adsorption–desorption isotherms each show a characteristic Type IV curve, that is, a hysteresis loop related to capillary condensation in mesopores (pore diameter: 2–50 nm).32 Using the Brunauer–Emmett–Teller (BET) method,33 the specific surface areas of compacted 100% G, 60/40 G/MCNT and 100% MCNT electrodes were calculated to be 15.6 m2 g−1, 154 m2 g−1 and 256 m2 g−1, respectively. Fig. 2(ii and iii) shows the relative and cumulative pore size distributions of the three 3D CPC electrodes based on the Barrett–Joyner–Halenda (BJH) model.34 The pore volumes of compacted 100% G, 60/40 G/MCNT and 100% MCNT electrodes are 0.052 cm3 g−1, 0.56 cm3 g−1 and 1.2 cm3 g−1, respectively. The volumes of those pores having diameters larger than 10 nm are 0.034 cm3 g−1, 0.42 cm3 g−1 and 1.0 cm3 g−1, representing 65%, 75% and 85% of the total pore volumes of compacted 100% G, 60/40 G/MCNT and 100% MCNT electrodes, respectively. Based upon maximum molecular diameters of Hyd-1 (12 nm) and BOD (8 nm),35,36 it follows that most pores of the CPC electrodes are large enough to be permeable to both enzymes. Electrodes with greater pore volumes will therefore have a higher density of electrocatalytic sites.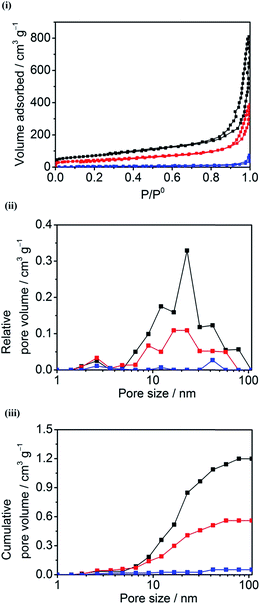 | ||
| Fig. 2 (i) N2 adsorption–desorption isotherms and (ii & iii) the corresponding pore size distribution curves of the compacted 100% MCNT (black), 60/40 G/MCNT (red), and 100% G (blue) electrodes. | ||
Assuming complete uptake of enzymes into the porous channels of CPC electrodes, the total amounts of hydrogenase (RMM approximately 100 kDa) and BOD (RMM approximately 50 kDa) deposited on respective electrodes are 1.2 nmol and 18 nmol, respectively (see Methods). A calculation indicates that an atomically flat surface occupied by a monolayer of Hyd-1 (assuming a footprint 12 × 12 nm) and BOD (assuming a footprint 8 × 8 nm) would extend to approximately 1000 cm2 and 7000 cm2 respectively, to be compared with geometric anode and cathode areas of 1.2 cm2 and 6 cm2. The enzyme loading is therefore equivalent to that of about 103 monolayers in both cases, the vast excess being drawn into the pores of the electrode.
Parallel and series connections
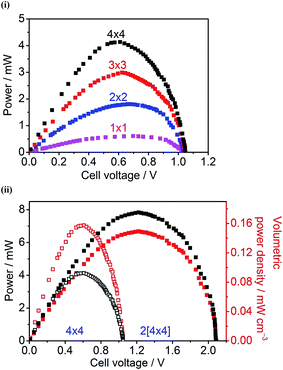
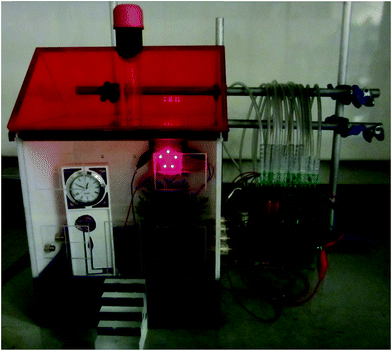
Fig. 3(i) shows power curves of unit cell and parallel multi-cells constructed with Hyd-1-modified compacted 60/40 G/MCNT anodes and BOD-modified compacted 60/40 G/MCNT cathodes. For most of the following experiments, 60/40 G/MCNT was used instead of 100% MCNT – the reason being that this composition worked sufficiently well for Hyd-1 and is a cheaper option. For both Hyd-1 and BOD, catalytic current densities measured by cyclic voltammetry scaled in the order 100% MCNT > 60/40 G/MCNT ≫ 100% G. The maximum power outputs of the 1 × 1, 2 × 2, 3 × 3 and 4 × 4 cells are 0.61 ± 0.03 mW, 1.80 ± 0.04 mW, 2.98 ± 0.08 mW, and 4.14 ± 0.09 mW, respectively. Fig. 3(ii) shows the dependences of power and volume power density on the cell voltage of the series multi-cell (two 4 × 4 cells connected in series, denoted 2[4 × 4]) and its individual unit (a single 4 × 4 cell). Volume power density has been used to give an idea of the power/size ratio that is achieved, noting that the test bed has not been designed to optimise this factor but, rather, to have easy access to the components: it is likely that specific attention to engineering could still result in large increases in volume power density. The open-circuit voltage of this series stack is 2.09 V, almost twice as large as that of a single 4 × 4 cell (1.05 V). The maximum power and volume power density of the 2[4 × 4] series multi-cell are 7.84 ± 0.11 mW and 0.149 ± 0.002 mW cm−3, respectively, at a cell voltage of 1.22 V.An exhibit was constructed to demonstrate that the test bed with series 2[4 × 4] configuration, is capable of powering electronics from a non-explosive 78% H2–22% air mixture at 20 °C. The festive ‘Hydrogen House’ shown in Fig. 4 contains five red LED tree lights and a miniature electronic clock. A light dependent resistor probe (LDR)37 was used to monitor changes in LED light intensity with time, in order to establish the working stability of the fuel cell under continuous power output. The light intensity showed no decrease over the course of 8 hours (Fig. S1†).
Improving the O2 tolerance of hydrogenases
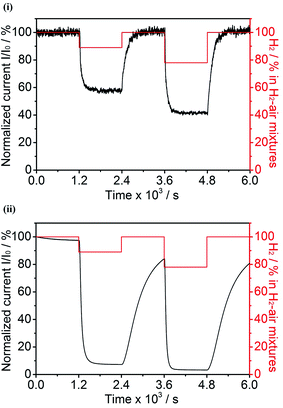
The following experiments were carried out to determine if the H2 oxidation activity of hydrogenases under aerobic conditions is improved if the enzyme is embedded in a 3D CPC electrode as compared to adsorption at a conventional pyrolytic graphite edge (PGE) electrode. Fig. 5 compares the current–time profiles for H2 oxidation by Hyd-1, previously fully activated, at a CPC electrode (60/40 G/MCNT) and at a PGE electrode. In each case, the electrode potential was held at +0.206 V vs. SHE (a more oxidizing value, and thus more demanding conditions, than used in earlier experiments3,30) and the H2 level in non-explosive H2–air mixtures was varied periodically.The Hyd-1/CPC electrode showed no loss in H2 oxidation current over the initial period of 1200 s under 100% H2. Then, upon switching the gas supply to 89% H2–11% air, the current dropped rapidly to 58% of its original value (f = 0.58) and remained constant at that value for a further 1200 s. Switching back to 100% H2 resulted in a rapid and complete recovery of the original current. After a further 1200 s, during which the same stability was observed, the gas supply was switched to 78% H2–22% air and the current dropped rapidly to 42% of the original value (f = 0.42), remaining stable at this value for 1200 s. Finally, the gas mixture was switched back to 100% H2 and complete recovery of the original current was observed. Exactly the same procedures were used to measure the performance of the conventional Hyd-1/PGE electrode. The slow decrease in current measured in the 100% H2 atmosphere is usually described as ‘film loss’. After 1200 s, switching the gas mixture from 100% H2 to 89% H2–11% air resulted in a rapid drop in current to approximately 7.5% of the original value (f = 0.075). Switching the gas supply back to 100% H2 then produced an increase in current that was much slower than observed for the Hyd-1/CPC electrode; in fact, recovery was incomplete even after 1200 s, when the gas supply was switched to 78% H2-22%, resulting in the current dropping rapidly to approximately 3.5% of the original value (f = 0.035). Finally, restoring the gas supply to 100% H2 resulted again in a slow increase in activity.
These results show that the great advantage afforded by embedding a hydrogenase in a 3D carbon electrode extends to an improved ability to function when the gas supply contains O2. Hyd-1 is inherently O2-tolerant, which means that if O2 is added to the H2 gas supply, only the oxidized ‘resting’ Ni–B state is formed:30 Ni–B is reactivated in a potential-dependent process, although the rate is slow at +206 mV – accounting generally for why the f values are quite low. Qualitatively, the behaviour and levels of activity obtained at different O2 levels for the Hyd-1/PGE electrode are fully consistent with previous observations. For example, in recent experiments in which the electrode potential was held at 0 mV vs. SHE at 30 °C, upon changing from 100% H2 to 10% H2–10% O2–80% N2, the current decrease corresponded to f = 0.35; the effect of the less favourable H2/O2 ratio (which increases rate(inact)) being offset by the far more reducing potential (which increases rate(act)).30
Regardless of whether a porous CPC electrode improves the performance of hydrogenase or BOD electrochemistry in the absence or presence of O2, an obvious rationale so far is that the electrode contains so much enzyme that losses, whatever their origin, have little effect on current or stability. We therefore examined whether a 3D CPC electrode could allow an O2-sensitive [NiFe]-hydrogenase, Hydrogenase-2 (Hyd-2) from Escherichia coli, to function under aerobic conditions. Fig. 6(i and ii) show cyclic voltammograms of Hyd-2 adsorbed at a conventional PGE electrode and at a 3D CPC electrode under conditions of 100% H2, 89% H2–11% air and 78% H2–22% air mixtures. For reasons that will become evident, 100% MCNT was used for the 3D CPC electrode. Under aerobic conditions, Hyd-2 adsorbed at a PGE electrode (Fig. 6(i)) shows no H2-oxidation activity under 78% H2–22% air and just a tiny window of activity is evident under 89% H2–11% air. The negative current at potentials <−0.2 V which completely dominates the voltammetry and almost doubles between 11% air and 22% air, is due to direct reduction of O2 at the electrode: a similar observation is made with or without hydrogenase present. In contrast, Hyd-2 embedded in the 3D CPC electrode maintains substantial H2 oxidation activity Fig. 6(ii) provided the potential is not taken above −0.1 V, where reversible inactivation takes place. The negative current at potentials <−0.3 V increases only by a very small degree as the O2 level is raised, first as 11% air, then as 22% air. The profound contrast in behaviour, from voltammetry completely dominated by direct O2-reduction (PGE) to voltammetry completely dominated by catalytic H2 oxidation (3D CPC), must reflect not only the increased density of enzyme on the 3D CPC electrode but also the inability of O2 to permeate to sites at which it would be detected electrochemically. Viewed in a different way, the hydrogenase serves as a probe by which to gauge how effectively the porous structure filters out O2 relative to H2.
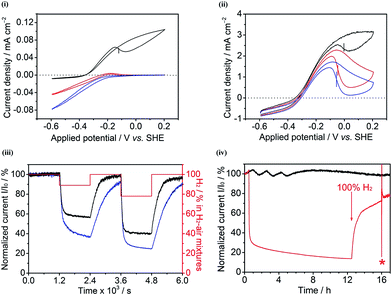 | ||
| Fig. 6 Cyclic voltammograms of Hyd-2 at (i) a PGE electrode and (ii) a compacted 100% MCNT electrode in 100% H2 (black), 89% H2–11% air (red) and 78% H2–22% air (blue) mixtures. The Eswitch values are indicated by vertical bars.38 Other conditions: 0.1 M sodium phosphate buffer at pH 6.0 and 20 °C, scan rate: 1 mV s−1. (iii) Chronoamperograms of Hyd-2 at compacted 100% MCNT (black) and 60/40 G/MCNT (blue) electrodes recorded at +0.006 V vs. SHE. The H2–air mixtures with different ratios are periodically applied (every 1200 s), as indicated in red (100% H2 → 89% H2–11% air → 100% H2 → 78% H2–22% air → 100% H2). (iv) Chronoamperograms of Hyd-2 at compacted 60/40 G/MCNT electrodes exposed to (black) 100% H2 for 17 h, recorded at +0.006 V vs. SHE, and (red) first exposed to 100% H2 (0.5 h) → 78% H2–22% air (12 h) → 100% H2 (3.5 h) at +0.006 V vs. SHE, then after the potential was stepped to −0.194 V vs. SHE for 1 min (*) under 100% H2, followed by returning the potential to +0.006 V vs. SHE for 1 h under 100% H2. Other conditions: 0.1 M sodium phosphate buffer at pH 6.0 and 20 °C. | ||
The ability of Hyd-2 to operate in the presence of O2 also varies between the different 3D CPC electrodes. Fig. 6(iii) shows chronoamperograms of Hyd-2 at compacted 100% MCNT and 60/40 G/MCNT electrodes, recorded at an electrode potential of +6 mV vs. SHE. It should be noted that a more negative potential was used for the Hyd-2 experiments (compared to Hyd-1) because the characteristic potential (Eswitch) at which Hyd-2 is reactivated from the Ni–B state is >0.2 V more negative than for Hyd-1.3 Switching the gas supply from 100% H2 to an 89% H2–11% air mixture results in an immediate drop in current that is significantly more pronounced for the 60/40 G/MCNT CPC electrode than for the 100% MCNT CPC electrode: furthermore, the resulting suppressed current measured with the 60/40 G/MCNT CPC electrode continues to drop at a faster rate than for the 100% MCNT CPC electrode. When, after 1200 s under 89% H2–11% air, the gas supply was switched back to 100% H2, recovery was faster and more complete for the 100% MCNT CPC electrode. A second exposure to O2, this time using 78% H2–22% air for 1200 s, revealed the same pattern but with lower currents, as expected. Finally, Fig. 6(iv) shows the result of an experiment to compare the current produced by a Hyd-2-60/40 G/MCNT CPC electrode over a continuous period of 17 h under 100% H2 with the current recorded over a 12 h period under a 78% H2–22% air mixture, after which the gas supply was restored to 100% H2. The current under 100% H2 remains steady, whereas the switch to 78% H2–22% air causes an immediate drop in current that is followed by a continual slow decrease. Upon restoring a 100% H2 supply, only partial recovery is observed, which is barely affected by switching the electrode potential to −0.194 V for 1 minute: since this procedure should drive the activation of any remaining Ni–B, the observation shows that O2 causes a significant degree of unrecoverable damage to Hyd-2.
The results shown in Fig. 6(i and ii) show clearly that the electrochemical contribution of enzyme-catalyzed H2 oxidation relative to O2-derived inactivation and direct O2 reduction is massively enhanced at the 100% MCNT CPC electrode compared to that at a PGE electrode. The observation provides firm evidence that the 100% MCNT CPC electrode restricts O2 transport, and therefore that the improved O2 tolerance in CPC electrodes is not attributable only to the buffering effect of high enzyme loading or to electrochemical removal of O2. In the H2–air mixtures, the main constituents are H2, N2 and O2. The mean free paths (λ) for H2, N2 and O2 at 293 K and 101.325 kPa are calculated to be 122 nm, 66 nm and 71 nm, respectively, according to the expression:39
Volumes of those pores having diameters between 10 nm and 70 nm are 0.959 cm3 g−1 and 0.422 cm3 g−1, respectively, for the compacted 100% MCNT and 60/40 G/MCNT electrodes. Within the range of pore sizes of 10–70 nm, the 3D CPC electrode with a larger pore volume also has more effusion pores through which the H2–air mixture can pass, thus resulting in a higher level of separation of H2 and O2. The compacted 100% MCNT electrode therefore allows Hyd-2 to maintain a higher level of apparent O2 tolerance than the compacted 60/40 G/MCNT electrode (Fig. 6(iii)). Similarly, increasing the thickness of the 3D porous electrode can increase effusion pores and thus increase the apparent O2 tolerance of hydrogenases. Hyd-2 embedded in the compacted 100% MCNT electrode with a thickness of 0.3 mm maintains a higher H2 oxidation current under aerobic conditions than in a 100% MCNT electrode of thickness 0.2 mm (Fig. S2†). The 100% MCNT electrodes having a thickness greater than 0.3 mm were prone to crumbling, so the thickness was restricted to 0.3 mm.
O2-sensitive hydrogenase as fuel cell catalyst
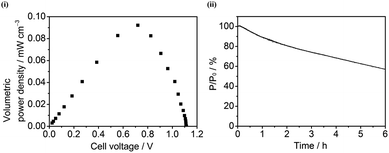
Finally, a full cell experiment was carried out in which O2-sensitive Hyd-2 was used as the anodic catalyst on 100% MCNT, a combination that our investigations now suggested might work. The experiment was conducted in an 89% H2–11% air mixture at 20 °C. Fig. 7(i) shows the dependence of volume power density on the cell voltage of the unit cell composed of a Hyd-2-modified compacted 100% MCNT anode and a BOD-modified 100% MCNT cathode. The open-circuit voltage of the fuel cell is 1.114 V, a value somewhat higher than that measured for the similar unit cell constructed with Hyd-1 in 60/40 G/MCNT. The improved voltage observed for the Hyd-2 fuel cell is consistent with it behaving as a reversible catalyst, in contrast to Hyd-1 and other O2-tolerant [NiFe]-hydrogenases that display a marked onset overpotential for H2 oxidation at neutral pH.16–20 The maximum volume power density is 0.09 mW cm−3 at a cell voltage of 0.72 V. Fig. 7(ii) shows the time dependence of power stability for the Hyd-2/100% MCNT fuel cell at an applied constant potential of 0.75 V under a 89% H2–11% air mixture at 20 °C: only about 55% of the power was retained after 6 h. The long-term performance under aerobic conditions is therefore far lower than achieved with Hyd-1, both as measured previously (54% of activity remaining after 7 days (ref. 20)) and as evident from the working experiment with Hyd-1 shown in Fig. S1† which shows 100% retention of LED intensity after 8 h.Conclusions
These studies have shown how the power provided by a membrane-less enzyme fuel cell acting on a mixed H2–air feed is easily scaled up to useful levels. Stable power, readily gained by exploiting the high enzyme loading possible with ‘3D’ porous carbon electrodes, is multiplied in terms of current or voltage using a simple stack design. There is considerable room for improvement in volume power density through miniaturization via careful attention to engineering. In support of a recent paper by Plumeré et al., we find that the ability of hydrogenases to operate effectively in the presence of O2 is greatly increased by incorporation into a matrix, although our experiments show that the major effect in the case of a 3D porous electrode is the lower effusion rate of O2 relative to H2, rather than electrochemical removal of O2 or enhanced rates of reactivation. Although a lower effusion rate of O2 would also impact on the current limiting electrocatalysis at the BOD-modified porous cathode, this aspect is addressed, empirically, by appropriate scaling of anode and cathode sizes. Despite the advantage afforded by the porous electrode, an O2-sensitive hydrogenase is still eventually overwhelmed, because the root cause of long-term inactivation is not access of O2 to the active site but the inability of the enzyme to deal with each attack with 100% fidelity.30Methods
Materials
Graphite and multi-walled carbon nanotubes were purchased from Sigma-Aldrich and used without further purification. The membrane-bound hydrogenases from E. coli, Hyd-1 and Hyd-2, were isolated and purified as described previously.3 Bilirubin oxidase (BOD) was purchased from Amano Enzyme Inc. and further purified by hydrophobic interaction chromatography with a HiTrap Phenyl HP hydrophobic column (GE Healthcare). Sodium dihydrogen orthophosphate and disodium hydrogen orthophosphate were purchased from Fisher Scientific and used to prepare the sodium phosphate buffer solution. The PGE electrodes were constructed from pyrolytic graphite blocks (Momentive Performance Materials Ltd). Conductive silver paint (Agar Scientific) was used to glue the CPC electrodes to the stainless steel plates of the test bed. All aqueous solutions were prepared using deionized water from a Milli-Q water system (18 MΩ cm).Construction of the test bed
The fuel cell test bed consisted of one compartment constructed from polycarbonate with a partial divider also made of polycarbonate. A reference electrode (Ag/AgCl) and a Pt mesh counter electrode were positioned at one end to use for electrochemical measurements under potential control. The main part of the test bed consisted of 16 stainless-steel plates as supports for the 3D CPC electrodes. The CPC electrodes were attached to both sides of each plate using conductive silver adhesive. The exposed metal plate areas not covered by the CPC electrodes were painted to insulate against the electrolyte solution. The top edges of the plates were bent and fixed to the ceiling of the test bed by screws and nuts, which also served as electrical connectors. Such an assembly also allowed for convenient dismantling of the plates. The anodic and cathodic plates were fixed in alternating mode. Gas supply into each unit cell was achieved through gas inlets positioned close to the bottom of the cell and positioned midway between anode and cathode.Fabrication of 3D CPC electrodes
A certain quantity of G, MCNT, or mixtures of the two carbon allotropes was placed in a pellet die (Specac) and subjected to a pressure of 0.5 tonnes using a hydraulic press (Specac). The quantities of G, MCNT, or G/MCNT mixtures that were used depended on what thickness of the 3D CPC electrode was required. For a typical thickness of 0.3 mm, (i) the compacted 100% G electrode required 47 mg of G; (ii) the compacted 60/40 G/MCNT electrode required 12 mg of G and 8 mg of MCNT; (iii) the compacted 100% MCNT electrode required 11 mg of MCNT. For a 0.2 mm thickness, the compacted 100% MCNT electrode required 7 mg of MCNT. The CPC discs were then cut to size for the required geometric area and attached to the stainless steel plates as described above. After each plate had been constructed, 30 μL of Hyd-1 (or Hyd-2) (4 mg mL−1) was applied to the anode side and 150 μL of BOD (6 mg mL−1) was applied to the cathode side. The enzyme concentrations and quantities were chosen after evaluating how oxidation and reduction current densities varied with amounts of Hyd-1 and BOD respectively (Fig. S3†). The enzyme-modified CPC electrodes were subsequently placed in a cold room (4 °C) for 1 h to allow the enzymes to permeate into the electrodes before starting the electrochemical characterization and fuel cell tests. The molecular quantities of Hyd-1 (RMM = 100 kDa) and BOD (RMM = 50 kDa) used to modify the CPC electrodes are therefore 1.2 nmol and 18 nmol, respectively. For experiments conducted with conventional PGE electrodes, 5 μL of the enzyme solution (Hyd-1/Hyd-2: 4 mg mL−1, BOD: 6 mg mL−1) was pipetted onto the surface of the freshly polished electrode, which was subsequently placed in a cold room (4 °C) for 1 h and rinsed with deionized water before the electrochemical experiments.Instrumentation
Electrochemical measurements were performed using an Ivium potentiostat (CompactStat, Ivium Technologies). All potentials were adjusted to the standard hydrogen electrode (SHE) using the relationship ESHE = EAg/AgCl + 0.206 V (25 °C).41 Power measurements were obtained by varying the applied load and recording the potential in each case (Keithley 195A digital voltmeter). The ratios of H2 to air were controlled by two mass flow controllers (Sierra Instruments). A Sorptomatic 1990 instrument (CE Instruments) was used to acquire N2 adsorption–desorption isotherms at 77 K, and BET surface areas were calculated from the linear part of BET plots. Pore size distribution plots were obtained by using the BJH model.34 The light intensity of the red LED was monitored by a cadmium sulphide (CdS) light dependent resistor connected to a digital multimeter.Acknowledgements
We thank the Engineering and Physical Sciences Research Council (Supergen V, EP/H019480/1) for generous financial support, and various grants (BB/H003878-1, BB/I022309-1, and BB/L009722/1) from the Biological and Biotechnological Research Councils, that have supported research on hydrogenases.References
- K. A. Vincent, A. Parkin and F. A. Armstrong, Chem. Rev., 2007, 107, 4366–4413 CrossRef CAS PubMed.
- M. E. Pandelia, V. Fourmond, P. Tron-Infossi, E. Lojou, P. Bertrand, C. Léger, M. T. Giudici-Orticoni and W. Lubitz, J. Am. Chem. Soc., 2010, 132, 6991–7004 CrossRef CAS PubMed.
- M. J. Lukey, A. Parkin, M. M. Roessler, B. J. Murphy, J. Harmer, T. Palmer, F. Sargent and F. A. Armstrong, J. Biol. Chem., 2010, 285, 3928–3938 CrossRef CAS PubMed.
- A. Ciaccafava, C. Hamon, P. Infossi, V. Marchi, M. T. Giudici-Orticoni and E. Lojou, Phys. Chem. Chem. Phys., 2013, 15, 16463–16467 RSC.
- W. Lubitz, H. Ogata, O. Rüdiger and E. Reijerse, Chem. Rev., 2014, 114, 4081–4148 CrossRef CAS PubMed.
- A. de Poulpiquet, A. Ciaccafava, R. Gadiou, S. Gounel, M. T. Giudici-Orticoni, N. Mano and E. Lojou, Electrochem. Commun., 2014, 42, 72–74 CrossRef CAS.
- V. Radu, S. Frielingsdorf, S. D. Evans, O. Lenz and L. J. C. Jeuken, J. Am. Chem. Soc., 2014, 136, 8512–8515 CrossRef CAS PubMed.
- A. K. Jones, E. Sillery, S. P. J. Albracht and F. A. Armstrong, Chem. Commun., 2002, 866–867 RSC.
- A. A. Karyakin, S. V. Morozov, E. E. Karyakina, N. A. Zorin, V. V. Perelygin and S. Cosnier, Biochem. Soc. Trans., 2005, 33, 73–75 CrossRef CAS PubMed.
- M. Hambourger, M. Gervaldo, D. Svedruzic, P. W. King, D. Gust, M. Ghirardi, A. L. Moore and T. A. Moore, J. Am. Chem. Soc., 2008, 130, 2015–2022 CrossRef CAS PubMed.
- T. Matsumoto, S. Eguchi, H. Nakai, T. Hibino, K. Yoon and S. Ogo, Angew. Chem., Int. Ed., 2014, 53, 8895–8898 CrossRef CAS PubMed.
- A. Heller, Phys. Chem. Chem. Phys., 2004, 6, 209–216 RSC.
- S. C. Barton, J. Gallaway and P. Atanassov, Chem. Rev., 2004, 104, 4867–4886 CrossRef CAS PubMed.
- M. J. Cooney, V. Svoboda, C. Lau, G. Martin and S. D. Minteer, Energy Environ. Sci., 2008, 1, 320–337 CAS.
- J. A. Cracknell, K. A. Vincent and F. A. Armstrong, Chem. Rev., 2008, 108, 2439–2461 CrossRef CAS PubMed.
- K. A. Vincent, J. A. Cracknell, O. Lenz, I. Zebger, B. Friedrich and F. A. Armstrong, Proc. Natl. Acad. Sci. U. S. A., 2005, 102, 16951–16954 CrossRef CAS PubMed.
- K. A. Vincent, J. A. Cracknell, J. R. Clark, M. Ludwig, O. Lenz, B. Friedrich and F. A. Armstrong, Chem. Commun., 2006, 5033–5035 RSC.
- A. F. Wait, A. Parkin, G. M. Morley, L. dos Santos and F. A. Armstrong, J. Phys. Chem. C, 2010, 114, 12003–12009 CAS . Interestingly, fuel cells running on such low H2 levels mixtures lose power catastrophically under low-load (short circuit) conditions because the hydrogenase converts to the oxidized resting state known as Ni–B: restoring electrical activity requires a electron ‘jump-start’, administered by briefly connecting a ‘rescue’ anode coated with active enzyme.
- S. Krishnan and F. A. Armstrong, Chem. Sci., 2012, 3, 1015–1023 RSC.
- L. Xu and F. A. Armstrong, Energy Environ. Sci., 2013, 6, 2166–2171 CAS.
- K. Murata, K. Kajiya, N. Nakamura and H. Ohno, Energy Environ. Sci., 2009, 2, 1280–1285 CAS.
- V. Flexer, N. Brun, R. Backov and N. Mano, Energy Environ. Sci., 2010, 3, 1302–1306 CAS.
- V. Flexer, N. Brun, O. Courjean, R. Backov and N. Mano, Energy Environ. Sci., 2011, 4, 2097–2106 CAS.
- A. Zebda, C. Gondran, A. Le Goff, M. Holzinger, P. Cinquin and S. Cosnier, Nat. Commun., 2011, 2, 370, DOI:10.1038/ncomms1365.
- B. Reuillard, A. Le Goff, C. Agnes, M. Holzinger, A. Zebda, C. Gondran, K. Elouarzaki and S. Cosnier, Phys. Chem. Chem. Phys., 2013, 15, 4892–4896 RSC.
- V. Flexer, N. Brun, M. Destribats, R. Backov and N. Mano, Phys. Chem. Chem. Phys., 2013, 15, 6437–6445 RSC.
- A. de Poulpiquet, H. Marques-Knopf, V. Wernert, M. T. Giudici-Orticoni, R. Gadiou and E. Lojou, Phys. Chem. Chem. Phys., 2014, 16, 1366–1378 RSC.
- F. A. Armstrong, N. A. Belsey, J. A. Cracknell, G. Goldet, A. Parkin, E. Reisner, K. A. Vincent and A. W. Wait, Chem. Soc. Rev., 2009, 38, 36–51 RSC.
- J. A. Cracknell, A. F. Wait, O. Lenz, B. Friedrich and F. A. Armstrong, Proc. Natl. Acad. Sci. U. S. A., 2009, 106, 20681–20686 CrossRef PubMed.
- R. M. Evans, A. Parkin, M. M. Roessler, B. J. Murphy, H. Adamson, M. J. Lukey, F. Sargent, A. Volbeda, J. C. Fontecilla-Camps and F. A. Armstrong, J. Am. Chem. Soc., 2013, 135, 2694–2707 CrossRef CAS PubMed.
- N. Plumeré, O. Rüdiger, A. A. Oughli, R. Williams, J. Vivekananthan, S. Pöller, W. Schuhmann and W. Lubitz, Nat. Chem., 2014, 6, 822–827 CrossRef PubMed.
- K. S. W. Sing, Pure Appl. Chem., 1982, 54, 2201–2218 CrossRef.
- S. Brunauer, P. H. Emmett and E. Teller, J. Am. Chem. Soc., 1938, 60, 309–319 CrossRef CAS.
- E. P. Barrett, L. G. Joyner and P. P. Halenda, J. Am. Chem. Soc., 1951, 73, 373–380 CrossRef CAS.
- A. Volbeda, P. Amara, C. Darnault, J. M. Mouesca, A. Parkin, M. M. Roessler, F. A. Armstrong and J. C. Fontecilla-Camps, Proc. Natl. Acad. Sci. U. S. A., 2012, 109, 5305–5310 CrossRef CAS PubMed.
- J. A. Cracknell, T. P. McNamara, E. D. Lowe and C. F. Blanford, Dalton Trans., 2011, 6668–6675 RSC.
- P. Scherz and S. Monk, Practical electronics for inventors, McGraw Hill, New York, 3rd edn, 2013 Search PubMed.
- E switch is the characteristic potential for reductive re-activation of a hydrogenase; in the case of [NiFe]-hydrogenases it represents the potential at which Ni–B is reduced. It is conveniently measured by taking the double derivative of the corresponding cyclic voltammogram scan (ref. 1). Eswitch is dependent on experimental conditions, such as pH, temperature and scan rate.
- K. J. Laidler and J. M. Meiser, Physical Chemistry, Benjamin/Cummings Publishing, Menlo Park, 1982 Search PubMed.
- D. R. Lide, CRC Handbook of Chemistry and Physics, CRC Press, Boca Raton, 86th edn, 2005 Search PubMed.
- A. J. Bard and L. R. Faulkner, Electrochemical methods: fundamentals and applications, Wiley, New York, 2nd edn, 2001 Search PubMed.
Footnote |
| † Electronic supplementary information (ESI) available. See DOI: 10.1039/c4ra13565b |
| This journal is © The Royal Society of Chemistry 2015 |

