Structural and magnetic properties of tetragonal perovskite BaFe1−xBixO3−δ

Muhammad Asim Farida, Hao Zhanga, Xiaohuan Lina, Aimei Yangb, Sihai Yangc, Guobao Li*a, Fuhui Liaoa and Jianhua Lin*a
aBeijing National Laboratory for Molecular Sciences, State Key Laboratory of Rare Earth Materials Chemistry and Applications, College of Chemistry and Molecular Engineering, Peking University, Beijing 100871, P.R. China. E-mail: liguobao@pku.edu.cn; Fax: +86-10-6275-3541
bA College of Materials and Engineering, Institution Guangxi Guilin University of Technology, Guilin 541004, China
cSchool of Chemistry, University of Nottingham, University Park, Nottingham NG7 2RD, UK

Received 31st October 2014 , Accepted 9th January 2015

First published on 9th January 2015


Abstract

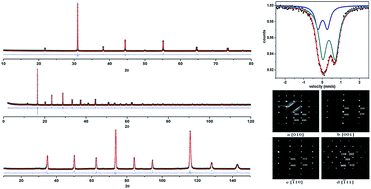
A series of BaFe1−xBixO3−δ (0.09 ≤ x ≤ 0.35) has been synthesized by a traditional solid state method. They all crystallize in space group P4/mmm (with a = 4.0759(1) Å, c = 4.0782(1) Å for x = 0.15) confirmed by the combinational use of powder X-ray, synchrotron, neutron, and electron diffractions. The magnetic susceptibility measurements show that the antiferromagnetic transition for these materials occurs from 64 to 50 K.


1. Introduction

BaFeO3−δ has been extensively studied for about seventy years,1–20 and may crystallize in triclinic,4,17 monoclinic,10,15 orthorhombic,18 hexagonal,2,9,12,16 tetragonal,2 or cubic13 crystal systems depending on the oxygen deficiency and temperature. For example, BaFeO2.80 (also denoted as Ba5Fe5O14) crystallizes in an orthorhombic crystal system with space group Cmcm19 (a = 5.7615(8), b = 9.9792(14), and c = 24.347(3) Å at room temperature) with the primary structure being trimers of FeO6 octahedra pillared by dimers of corner-sharing FeO4 tetrahedra, and denoted as 10L-BaFeO3−δ. BaFeO2.91 crystallizes in space group P63/mmc (a = 5.6743(1), c = 13.9298(3) Å at 300 K),20 and is denoted as 6H–BaFeO3−δ. However, due to large ionic radius of Ba it is not easy to synthesize cubic BaFeO3 perovskite phase (noted as C–BaFeO3). Recently, Hayashi et al.21 reported the low temperature oxidation route to synthesize C–BaFeO3 from BaFeO2.5 phase in bulk polycrystalline form. C–BaFeO3 is an antiferromagnet with a spiral spin structure of the A type (q//a) that shows a field-induced transition to ferromagnetism at approximately 0.3 T at 5 K (0.2 T at 77 K). In addition cubic BaFeO2F is antiferromagnetic with Fe3+ configuration.22 It should be very interesting to know what will happen for the perovskite compound ABO3 with both Fe4+ and Fe3+ at the B site. It is found by us that the perovskite structure can be easily obtained by doping Bi in the Fe site of BaFeO3−δ with conventional solid state method. A series of solid solution with composition BaFe1−xBixO3−δ (0.09 ≤ x ≤ 0.35) has been synthesized. With the combinational use of X-ray, neutron, synchrotron, selected area electron diffraction data, and the Mössbauer, Raman/IR spectra, it is found that BaFe1−xBixO3−δ is the perovskite compound crystallized in the space group P4/mmm with both Fe4+ and Fe3+ at the B site. Magnetic measurements indicate that they are antiferromagnetic ordered below 64 to 50 K. The corresponding details are presented below.

2. Experimental

The series of BaFe1−xBixO3−δ (x = 0.09, 0.12, 0.15, 0.18, 0.21, 0.24, 0.27, 0.30, and 0.35, noted as BFB9, BFB12,…, BFB30, and BFB35) has been synthesized from stoichiometric amounts of reagents BaCO3 (A.R.), Fe2O3 (A.R.), and Bi2O3 (A.R.). The weighed reagents were mixed and homogenized by about thirty minute grinding for total 10 g of mixtures with an agate mortar and a pestle. The mixtures were sintered at 840 °C for 12 hours. The sintered mass was again crushed and pulverized to obtain the fine powder. Subsequently, the fine powders were pressed into cylindrical pellets to undertake four 12 hours heat treatments at 880 °C followed by a furnace cooling every time with intermediate grinding and then pressing into pellets. All the treatments were done in air.

Powder X-ray diffraction (PXRD) data were collected on a PANalytical Empyrean diffractometer with Cu Kα1 radiation (λ = 1.540598 Å) at 50 kV and 40 mA. High resolution synchrotron powder diffraction data were collected on Beamline I11 at Diamond Light Source by using multi-analyzing-crystal detectors (MACs)23 using an average wavelength of 0.82665 Å, with data points collected every 0.001° 2θ and scan speed of 0.01° s−1. Neutron powder diffraction (NPD) data were collected on the instrument Echidna at the OPAL reactor (Lucas Heights, Australia) in Australian Nuclear Science and Technology Organisation (ANSTO) at λ = 2.43950 Å. Sample was placed in 9 mm diameter vanadium can and data collected over 4 hours per sample. The diffraction data were analyzed using GSAS software.24,25 Selected area electron diffractions (SAED) were carried out on JEM2100F with an accelerating voltage of 200 kV. Raman spectra recorded on a Jobin-Yvon HR800 Raman spectrometer (France); FTIR spectra were recorded on an ECTOR 22 FTIR spectrophotometer in the region of 650–50 cm−1 and a Magna-IR 750 FTIR spectrophotometer in the region of 4000–400 cm−1. The magnetic properties were investigated with a Quantum design physical property measurement system (PPMS) from 5 K to 300 K.

The 57Fe Mössbauer spectra were obtained using 57Co diffused into rhodium as a source of gamma rays at room temperature.26 Absolute velocity calibration was carried out with a Fe foil (25 pm thick); isomer shifts (IS) are reported with reference to Fe. The spectra were computer-fitted using a general Lorentzian routine, and a nonlinear least-square curve-fitting procedure was employed to obtain the best fit to the experimental data. We used IS and quadrupole splitting (QS) to characterize the species. The X-ray photoelectron spectroscopy (XPS) patterns were acquired with a UK Kratos Axis Ultra spectrometer with Al Kα X-ray source operated at 15 kV, 15 mA. The chamber pressure was less than 5.0 × 10⁻⁹ Torr. Electron binding energies were calibrated against the C 1s emission at Eb = 284.8 eV.

3. Results and discussion

3.1. Crystallographic structure of BaFe1−xBixO3−δ (0.09 ≤ x ≤ 0.35)

As shown in Fig. 1, the powder X-ray diffraction patterns of the series BaFe1−xBixO3−δ (0.09 ≤ x ≤ 0.35) are almost the same and similar to that reported for C–BaFeO3.21 No reflections for the secondary phase are found. Therefore space group Pm3m can be chosen as standard for the refinement of diffraction data.
image file: c4ra13540g-f1.tif
Fig. 1 Powder X-ray diffraction patterns of the samples in the series BaFe1−xBixO3−δ (0.09 ≤ x ≤ 0.35).

The sample BFB15 (BaFe0.85Bi0.15O3−δ) has been chosen as the typical sample. The powder X-ray, synchrotron and neutron diffraction refinement data of BFB15 can be fitted well with space group Pm3m as reported for C–BaFeO3.21 The refinement plots are shown in Fig. S1 and the details are listed in Table S1 (ESI). However room temperature 57Fe Mössbauer spectra of BFB15 (Fig. 2a) shows that it cannot be cubic. Two doublets with an isomer shift of about 0.359(3) and 0.020(4) mm s−1 can be derived from the spectra, which indicates the presence of the Fe3+ and Fe4+ ions with octahedral coordination in non-cubic symmetry. The ratio of Fe3+[thin space (1/6-em)]:[thin space (1/6-em)]Fe4+ estimated by Mössbauer spectra is 75.4[thin space (1/6-em)]:[thin space (1/6-em)]24.6. At this case, the space group Pm3m used for C–BaFeO3 (ref. 21) could not be used for BFB15.28 The SAED patterns shown in Fig. 2b for BFB15 indicate that there are no special diffraction conditions. Then the space group P4/mmm or P4mm can be chosen to describe the structure of BFB15. The mismatch of the Raman peaks and IR peaks for BFB15 shown in Fig. 2c indicates that there is a center of symmetry in the structure of BFB15.27 On careful refinement it is found that the high resolution synchrotron powder diffraction data are also fitted well with space group P4/mmm: three peaks are found around 62.26° (inset Fig. 3a), but only one peak is expected by the space group Pm3m (ESI Fig. S1d). Therefore, the space group P4/mmm is chosed to describe the structure of BFB15 instead of the space group Pm3m for C–BaFeO3. As shown in Fig. 3b, the powder X-ray diffraction data of BFB15 can be fitted well by Rietveld refinement using the space group P4/mmm with the low R factor values listed in Table 1. For further confirmation, the powder neutron diffraction data were also obtained and shown in Fig. 3c. In addition, the neutron diffraction data were also used to refine the occupation of oxygen, which are listed in Table 1 for BFB15.


image file: c4ra13540g-f2.tif
Fig. 2 57Fe Mössbauer spectra at room temperature (a), SAED pattern (b), Raman and IR spectra (c) of BFB15 (BaFe0.85Bi0.15O3−δ).

image file: c4ra13540g-f3.tif
Fig. 3 Rietveld plots of powder X-ray (a), Synchrotron (b) and neutron (c) powder diffraction pattern of BFB15 (BaFe0.85Bi0.15O3−δ). The symbol + represents the observed value, solid line represents the calculated value; the marks below the diffraction patterns are the calculated reflection positions, and the difference curve is shown at the bottom of the figure.
Table 1 Rietveld refinement details of BFB15 (BaFe0.85Bi0.15O3−δ) in space group P4/mmm
Lattice parameters a = 4.0759(1) Å, c = 4.0782(1) Å
Atom (x, y, z) Occupancy Uiso
a Rxwp, Rxp are the R factor of the whole patterns and the peaks only for X-ray diffraction data, respectively; Rswp, Rsp are the R factor of the whole patterns and the peaks only for synchrotron diffraction data, respectively; Rnwp, Rnp are the R factor of the whole patterns and the peaks only for neutron diffraction data, respectively.
Ba1 0.0000, 0.0000, 0.0000 1.00 0.0036(3)
Fe1 0.5000, 0.5000, 0.5000 0.85(1) 0.0072(3)
Bi1 0.5000, 0.5000, 0.5000 0.15(1) 0.0072(3)
O1 0.5000, 0.5000, 0.0000 0.98(1) 0.0037(3)
O2 0.5000, 0.0000, 0.5000 0.93(1) 0.0060(3)u
R factora Rxwp = 0.038, Rxp = 0.026; Rswp = 0.063, Rsp = 0.050; Rnwp = 0.064, Rnp = 0.044


Therefore, it is acceptable to use P4/mmm to describe the structure of BFB15, which is reasonable to be suggested to describe the structure of BFBn. Acceptable fittings between the experimental data and the proposed model are obtained with Rp < 4.10%, Rwp < 6.6% for all of the solid solutions (see ESI for details). As shown in Fig. 4, the obtained volume of the unit cell increases linearly with the increase of the value of x in BaFe1−xBixO3−δ due to that the radius of Bi3+ or Bi5+ is larger than that of Fe3+ or Fe4+, which agrees well with Vigard's law.29


image file: c4ra13540g-f4.tif
Fig. 4 Volume of the unit cell of BaFe1−xBixO3−δ (0.09 ≤ x ≤ 0.35) series.

3.2. XPS analysis

In order to have a full estimate of the chemical state of Bi and Fe in the series of BaFe1−xBixO3−δ, XPS analysis has been performed. Fig. 5 shows the Gaussian fitting of the peaks for Fe 2p3/2 and Bi 4f7/2 of BFB15 and BFB24. The Fe 2p3/2 peaks split into two components as shown in Fig. 5a and b. The higher energy 710.54 (for BFB15) and 710.92 (for BFB24) eV accounts for Fe4+ and lower energy 709.84 (for BFB15) and 709.76 (for BFB24) eV belongs to Fe3+.30 The satellite peaks near 718 eV for both of the samples are characteristic of Fe3+ ions.31 In Fig. 5c and d, the doublet binding energies of Bi 4f7/2 are due to two valences. The higher binding energy peak around 158.6 eV is characteristic peak for Bi5+ while the second peak at lower binding energy is characteristic of Bi3+ as described in literature.32
image file: c4ra13540g-f5.tif
Fig. 5 XPS spectra of Fe 2p3/2 (a and b) and Bi 4f7/2 (c and d) for BFB15 (BaFe0.85Bi0.15O3−δ) and BFB24 (BaFe0.76Bi0.24O3−δ).

A comparison of Fe 2p3/2 and Bi 4f7/2 core levels for the whole series BaFe1−xBixO3−δ (0.09 ≤ x ≤ 0.35) are shown in Fig. 6. It is found that the Fe 2p3/2 peaks significantly shift towards the lower binding energy direction with the increase in concentration of Bismuth in solid solutions (Fig. 6a). This means the gradual decrease in charge at the Fe site, which leads to a chemical shift to a lower binding energy. Simultaneously the binding energies for Bi 4f7/2 shift towards higher energy state as shown in Fig. 6b. It is due to the gradual relative increase in Bi5+ concentration. Therefore, it can be speculated that with the increase of the amount of Bi in the sample, the relative amounts of Bi5+ and Fe3+ increase, although it is obvious that the present data could not give the clear results for the ratio of Fe3+[thin space (1/6-em)]:[thin space (1/6-em)]Fe4+ and Bi5+[thin space (1/6-em)]:[thin space (1/6-em)]Bi3+.


image file: c4ra13540g-f6.tif
Fig. 6 XPS spectra of Fe 2p3/2 (a) and Bi 4f7/2 (b) for the series BaFe1−xBixO3−δ (0.09 ≤ x ≤ 0.35).

3.3. Magnetic properties

The variation of magnetic susceptibility with increasing temperature from 5 K to 300 K following pre-cooling in zero applied field (ZFC) and an applied field (FC) of 100 Oe was measured for all of the samples in the series of BaFe1−xBixO3−δ. The ZFC and FC data overlie over a large temperature range (70–300 K). Typical data for BFB15 and BFB24 are shown in Fig. 7 (the data for other samples listed in ESI). The susceptibilities from 100 K to 300 K are fitted well by a Curie–Weiss law with the Curie constants and Weiss temperatures (θ) listed in Table 2.
image file: c4ra13540g-f7.tif
Fig. 7 Molar magnetic susceptibility χ and inverse molar magnetic susceptibility χ−1 verses temperature for BFB15 (BaFe0.85Bi0.15O3−δ) (a and b) and for BFB24 (BaFe0.76Bi0.24O3−δ) (c and d). Empty and filled symbols show field cooling (FC) and zero-field cooling (ZFC) data, respectively.
Table 2 TN, θ, μeff and Curie Constant of the BaFe1−xBixO3−δ samples
x TN (K) θ (K) Curie constant Fe3+[thin space (1/6-em)]:[thin space (1/6-em)]Fe4+ (%)
0.09 64 −20 3.93 67.3(3)[thin space (1/6-em)]:[thin space (1/6-em)]32.7(3)
0.12 62 −22 3.96 69.3(3)[thin space (1/6-em)]:[thin space (1/6-em)]30.7(3)
0.15 60 −25 4.02 74.5(3)[thin space (1/6-em)]:[thin space (1/6-em)]25.5(3)
0.18 58 −11 4.03 75.5(3)[thin space (1/6-em)]:[thin space (1/6-em)]24.5(3)
0.21 57 −8 4.05 76.6(3)[thin space (1/6-em)]:[thin space (1/6-em)]23.4(3)
0.24 56 −3 4.07 77.6(3)[thin space (1/6-em)]:[thin space (1/6-em)]22.4(3)
0.27 54 −17 4.11 80.7(3)[thin space (1/6-em)]:[thin space (1/6-em)]19.3(3)
0.30 53 −19 4.13 81.8(3)[thin space (1/6-em)]:[thin space (1/6-em)]18.2(3)
0.35 50 −16 4.18 85.0(3)[thin space (1/6-em)]:[thin space (1/6-em)]14.0(3)


The ratio of Fe3+[thin space (1/6-em)]:[thin space (1/6-em)]Fe4+ can be estimated from the Cobt by supposing that Fe3+ and Fe4+ in the sample are at high spin state, which is listed in Table 2 and agrees well with the ratio of Fe3+[thin space (1/6-em)]:[thin space (1/6-em)]Fe4+ obtained by Mössbauer spectra for BFB15. The ratio of Fe3+[thin space (1/6-em)]:[thin space (1/6-em)]Fe4+ increase with the increase of Bi in the samples also agrees well the observation by XPS. The dominant exchange interactions are antiferromagnetic as θ values are negative. The ZFC and FC susceptibilities rise and start to diverge near 64 K to 50 K for different samples in the solid solutions. This is typical for the canted antiferromagnetic compounds. These temperatures are Neel temperature, and noted as TN. The decrease in TN was observed as a function of increase concentration of bismuth in B site as listed in Table 2, which may be the result of the decrease of the ratio of Fe4+ in the samples.

Field dependent magnetic susceptibility has also been measured for BaFe1−xBixO3−δ. Magnetization curves for BFB15 and BFB24 at 5, 55, and 75 K are shown in Fig. 8. At 75 K, the magnetization curves are a linear function of applied field because the samples at this temperature are paramagnetic. It is not surprised that no obvious hysteresis loop is observed at 55 K because which is just a little lower than the TN. A little hysteresis is observed at 5 K with the loop displaced from the origin. This is agreed well with the suggestion that the studied samples are canted antiferromagnetic.


image file: c4ra13540g-f8.tif
Fig. 8 MH curve for BFB15 (BaFe0.85Bi0.15O3−δ) (a) and BFB24 (BaFe0.76Bi0.24O3−δ) (b) at 5 K, 55 K and 75 K.

3.4. Neutron diffraction study

Neutron powder diffraction data for BFB15 have been collected at 3 K, 55 K and 300 K to understand of the magnetic properties of BaFe1−xBixO3−δ. These data are shown in Fig. 9a. It is found that the main reflections are very similar and can be fitted well with the same structural model used for BFBn at room temperature as shown in Fig. 10a. However, with a fine comparison among these neutron diffraction patterns, some little additional satellite peaks are observed in range of 35–40 degree 2θ value for neutron diffraction data at 3 K and 55 K as shown in Fig. 9b, which are similar to that of C–BaFeO3 (ref. 21) at low temperature. These additional reflections are due to incommensurate magnetic ordering of Fe ions with q = (0.195, 0.153, 0.000) and μeff = (2.69, 3.95, 0.00)μB at 55 K and q = (0.195, 0.150, 0.000) and μeff = (3.30, 4.40, 0.00)μB at 3 K. The corresponding Rietveld refinement data at 55 K are listed in Fig. 10c.
image file: c4ra13540g-f9.tif
Fig. 9 Neutron powder diffraction pattern for BFB15 (BaFe0.85Bi0.15O3) at 3 K, 55 K and 300 K.

image file: c4ra13540g-f10.tif
Fig. 10 Rietveld refinement of the neutron data of BFB15 (BaFe0.85Bi0.15O3) at 3 K with nuclear structure (a), at 55 K with nuclear structure (b), and at 55 K with both nuclear and magnetic structure (c).

4. Conclusions

A new series of BaFe1−xBixO3−δ (0.09 ≤ x ≤ 0.35) solid solutions has been synthesized by solid–state reactions under 880 °C calcinations. They all crystallize in tetragonal structure with P4/mmm space group. XPS shows that the ratios of Fe3+[thin space (1/6-em)]:[thin space (1/6-em)]Fe4+ and Bi5+[thin space (1/6-em)]:[thin space (1/6-em)]Bi3+ increase with the increase of Bi in the BaFe1−xBixO3−δ series. Magnetic measurement and neutron diffraction data indicate that BaFe1−xBixO3−δ is an incommensurate antiferromagnet (q ≈ (0.195, 0.150, 0.000) for BFB15) when the temperature below TN.

Acknowledgements

This work is supported by a National Key Basic Research Project of China (2010CB833103), the National Natural Science Foundation of China (Grant 21271014). We thank Dr M. Avdeev for assistance in collecting the neutron power diffraction data at the OPAL facility. We are grateful to Diamond Light Source for access to Beamlines I11.

Notes and references

  1. M. Erchak, I. Fankuchen and R. Ward, J. Am. Chem. Soc., 1946, 68, 2085–2093 CrossRef CAS.
  2. W. W. Malinofsky and H. Kedesdy, J. Am. Chem. Soc., 1954, 76, 3090–3091 CrossRef CAS.
  3. H. J. V. Hook, J. Phys. Chem., 1964, 68, 3786–3789 CrossRef.
  4. S. Mori, J. Am. Ceram. Soc., 1966, 49, 600–605 CrossRef CAS PubMed.
  5. T. Negas and R. S. Roth, J. Res. Natl. Bur. Stand., Sect. A, 1969, 73, 425–430 CrossRef CAS.
  6. S. Mori, J. Phys. Soc. Jpn., 1970, 28, 44–50 CrossRef CAS.
  7. M. Zanne, C. Gleitzer and J. Aubry, Bull. Soc. Chim. Fr., 1970, 36–40 Search PubMed.
  8. M. Zanne and C. Gleitzer, Bull. Soc. Chim. Fr., 1971, 1567–1570 CAS.
  9. A. Jacobson, Acta Crystallogr., Sect. B: Struct. Crystallogr. Cryst. Chem., 1976, 32, 1087–1090 CrossRef.
  10. J. C. Grenier, A. Wattiaux, M. Pouchard, P. Hagenmuller, M. Parras, M. Vallet, J. Calbet and M. A. Alario-Franco, J. Solid State Chem., 1989, 80, 6–11 CrossRef CAS.
  11. M. Parras, M. Vallet-Regi, J. M. González-Calbet and J. C. Grenier, J. Solid State Chem., 1989, 83, 121–131 CrossRef CAS.
  12. M. Parras, M. Valletregi, J. M. Gonzalezcalbet, J. C. Grenier, P. Hagenmuller and J. Rodriguezcarvajal, Eur. J. Solid State Inorg. Chem., 1989, 26, 299–312 CAS.
  13. M. Parras, J. M. González-Calbet, M. Vallet-Regí and J. C. Grenier, Solid State Ionics, 1993, 63–65, 714–718 CrossRef CAS.
  14. J. M. Gonzalez-Calbet, M. Parras, M. Vallet-Regi and J. C. Grenier, J. Solid State Chem., 1990, 86, 149–159 CrossRef CAS.
  15. X. D. Zou, S. Hovmöller, M. Parras, J. M. González-Calbet, M. Vallet-Regí and J. C. Grenier, Acta Crystallogr., Sect. A: Found. Crystallogr., 1993, 49, 27–35 Search PubMed.
  16. M. Gómez, G. Lucotti, J. A. de Morán, P. J. Aymonino, S. Pagola, P. Stephens and R. E. Carbonio, J. Solid State Chem., 2001, 160, 17–24 CrossRef.
  17. S. Mori, J. Am. Ceram. Soc., 1965, 48, 165 CrossRef CAS PubMed.
  18. J. M. González-Calbet, M. Parras, M. Vallet-Regí and J. C. Grenier, J. Solid State Chem., 1990, 85, 15–22 CrossRef.
  19. J. L. Delattre, A. M. Stacy and T. Siegrist, J. Solid State Chem., 2004, 177, 928–935 CrossRef CAS PubMed.
  20. K. Mori, T. Kamiyama, H. Kobayashi, K. Oikawa, T. Otomo and S. Ikeda, J. Phys. Soc. Jpn., 2003, 72, 2024–2028 CrossRef CAS.
  21. N. Hayashi, T. Yamamoto, H. Kageyama, M. Nishi, Y. Watanabe, T. Kawakami, Y. Matsushita, A. Fujimori and M. Takano, Angew. Chem., Int. Ed., 2011, 50, 12547–12550 CrossRef CAS PubMed.
  22. F. J. Berry, F. C. Coomer, C. Hancock, Ö. Helgason, E. A. Moore, P. R. Slater, A. J. Wright and M. F. Thomas, J. Solid State Chem., 2011, 184, 1361–1366 CrossRef CAS PubMed.
  23. S. P. Thompson, J. E. Parker, J. Potter, T. P. Hill, A. Birt, T. M. Cobb, F. Yuan and C. C. Tang, Rev. Sci. Instrum., 2009, 80, 075107–075109 CrossRef CAS PubMed.
  24. H. Rietveld, J. Appl. Crystallogr., 1969, 2, 65–71 CrossRef CAS.
  25. B. Toby, J. Appl. Crystallogr., 2001, 34, 210–213 CrossRef CAS.
  26. R. Mössbauer, Z. Phys., 1958, 151, 124–143 CrossRef.
  27. Y. K. Atanassova, V. N. Popov, G. G. Bogachev, M. N. Iliev, C. Mitros, V. Psycharis and M. Pissas, Phys. Rev. B: Condens. Matter Mater. Phys., 1993, 47, 15201–15207 CrossRef CAS.
  28. G. Li, S. Liu, F. Liao, S. Tian, X. Jing, J. Lin, Y. Uesu, K. Kohn, K. Saitoh, M. Terauchi, N. Di and Z. Cheng, J. Solid State Chem., 2004, 177, 1695–1703 CrossRef CAS PubMed.
  29. L. Vegard, Z. Phys., 1921, 5, 17–26 CrossRef CAS.
  30. T. Matsui, E. Taketani, R. Sato and K. Morii, J. Phys. D: Appl. Phys., 2007, 40, 6066 CrossRef CAS.
  31. A. P. Grosvenor, B. A. Kobe, M. C. Biesinger and N. S. McIntyre, Surf. Interface Anal., 2004, 36, 1564–1574 CrossRef CAS.
  32. L. Z. Zhao and J. B. Zhang, Solid State Commun., 1994, 90, 709–712 CrossRef CAS.

Footnote

Electronic supplementary information (ESI) available. See DOI: 10.1039/c4ra13540g

This journal is © The Royal Society of Chemistry 2015
Click here to see how this site uses Cookies. View our privacy policy here.