
Facile synthesis of Au–Pt bimetallic nanocomplexes for direct oxidation of methanol and formic acid†
Ruigang Xiea,
Muzi Chenb,
Jiaqing Wanga,
Sujuan Meia,
Yue Pan*a and
Hongwei Gu*a
aKey Laboratory of Organic Synthesis of Jiangsu Province, College of Chemistry, Chemical Engineering and Materials Science & Collaborative Innovation Center of Suzhou Nano Science and Technology, Soochow University, Suzhou, 215123, China. E-mail: hongwei@suda.edu.cn; panyue@suda.edu.cn; Fax: +86-65880905; Tel: +86-65880905
bAnalysis and Testing Center, Soochow University, Suzhou, 215123, China
First published on 14th November 2014
Abstract
Au–Pt bimetallic nanocomplexes were synthesized and the composition and morphology of the nanocomplexes could be easily controlled by a facile synthesis method. The eletrochemical activity and stability of the nanocomplexes can be optimized by tuning their Au-to-Pt molar ratio. The efficient electrocatalytic performance is confirmed by direct oxidation of methanol and formic acid.
In recent years, noble metal nanomaterials have been extensively studied for applications in many areas such as catalysis, fuel-cell technology, imaging, sensing etc.1–4 Compared to the monometallic nanomaterials, bimetallic nobel nanomaterials are important because of their favorable synergetic behavior.5–8 The synthesis of shape and composition controlled bimetallic metal nanostructures has therefore attracted great interest because their properties and applications are influenced greatly by their morphologies. As a special class of bimetals, Au–Pt bimetallic nanomaterials, have been produced by various methods.9–19 Herein, we report a novel, facile approach for the synthesis of Au–Pt bimetallic nanocomplexes(NCs). The composition and morphology of the NCs could be easily controlled by tuning the reaction temperature and time. These synthesised Au–Pt bimetallic NCs showed substantially enhanced catalytic activity for the oxidation of methanol and formic acid.
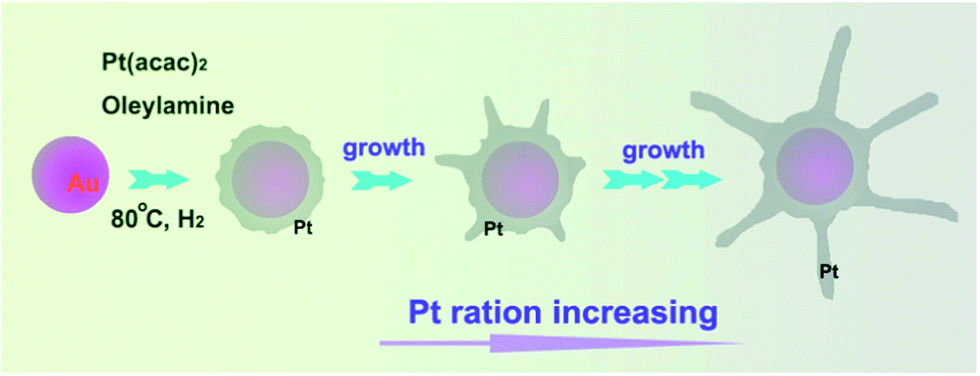
As illustrated in Scheme 1, the synthesis route was relatively straightforward: the Au–Pt bimetallic NCs were synthesized via reduction of Pt(acac)2 on the surface of Au nanoparticles in oleylamine (OAm) under a 1 bar hydrogen atmosphere. Typically, Pt(acac)2 was dissolved in a mixture of Au nanoparticles and OAm in a three-necked round-bottom flask. The mixture was heated to 90 °C under a 1 bar hydrogen atmosphere, maintained at this temperature for several hours, and then cooled to room temperature. The final product was precipitated by ethanol, separated via centrifugation and further purified three times by ethanol to partially remove the surfactant.
 | ||
| Scheme 1 The illustration of the formation of Au–Pt NCs. | ||
We used transmission electron microscopy (TEM) to follow the progress of the synthesis and to characterize the nanostructures. The TEM image in Fig. 1A shows as-synthesized Au NPs of diameter around 8 nm. Fig. 1B–I show images of the Au–Pt NCs taken at different times and temperatures during the reaction. When Pt(acac)2 was added and the reaction temperature was raised to 80 °C, the NCs became a little bit thicker while keeping their spherical shape (Fig. 1B). After the temperature was raised to 90 °C, Pt metal nanobranches grew on the seed surface (Fig. 1C). The size of the metal branches increased with the reaction time (Fig. 1D–H). In this process, OAm acted as the solvent, surfactant, and reducing agent,20–22 and hydrogen functioned as a capping agent to control the shape and stability of the NCs.23,24 The corresponding composition was determined using inductively coupled plasma spectroscopy (ICP) (Table S1†). Besides, UV-vis spectra of the Au–Pt NCs and Au NPs are also investigated. This result show that the peak denoted as Au NPs can eliminate with the introduced nanobranches elongating (Fig. S1†). The formation mechanism was proposed as illustrated in Scheme 1. Firstly, Pt(acac)2 was reduced by OAm to form small nanocrystals on the surface of the Au NPs. Secondly, the partially hydrogen-active surfaces of the Pt nanocrystals were capped by hydrogen, inhibiting crystal growth. As a result, the Pt nanocrystals grew to be metal branches. The Pt grew bigger and bigger on the tips of the branches and finally the NCs were formed, which is very distinct to that for the commercial catalysts (Fig. S2†).
 | ||
| Fig. 1 Representative TEM images of the as-synthesized (A) Au NPs, and Au–Pt nanostructures at different reaction temperatures and times: (B) 80 °C, (C) 90 °C for 0 min, (D) 90 °C for 10 min, (E) 90 °C for 20 min, (F) 90 °C for 30 min, (G) 90 °C for 1 h, (H) 90 °C for 2 h, (I) 90 °C for 5 h, respectively. The specimens for TEM analyses were prepared by room temperature deposition on carbon-coated copper grids. | ||
The crystal structures of the NCs were further determined by X-ray powder diffraction (XRD) analysis. As shown in Fig. 2, the Au crystal was confirmed by XRD at first. For Pt (111), the pattern positions were unclear and the relative intensities of the diffraction peaks were weak when the reaction temperature was 80 °C. The pattern positions and relative intensities for Pt (111), (200), (220), (311) and (222) became clear and matched well with standard patterns within the reaction time when the temperature raised to 90 °C. The XPS spectrum (Fig. S12†) further proved that Au–Pt NCs contains both Au and Pt respectively.
 | ||
| Fig. 2 The XRD patterns of Au NPs, Pt NPs and Au–Pt NCs at different reaction times respectively. | ||
The electrocatalytic activity can be introduced by Pt nanobranches around Au NPs. Take the Au–Pt NCs prepared at 90 °C for 2 h (Au/Pt 4/39 mol/mol, Table S1†) for example (Fig. 3A). Fig. 3B shows a typical cyclic voltammogram (CV) of Au–Pt NCs in an N2-saturated solution of 0.5 M H2SO4. It is evident that the cathodic and anodic peaks between −0.20 V and 0 V (vs. SCE) were attributed to the adsorption and desorption of a monolayer of hydrogen in the acidic medium. Besides, the metals were oxidized at high potentials, approximately 0.6 V, and the oxidized metals were reduced at approximately 0.51 V in the negative scan. The electrochemically active surface area of Au–Pt NCs was 48 m2 g−1 of Pt.
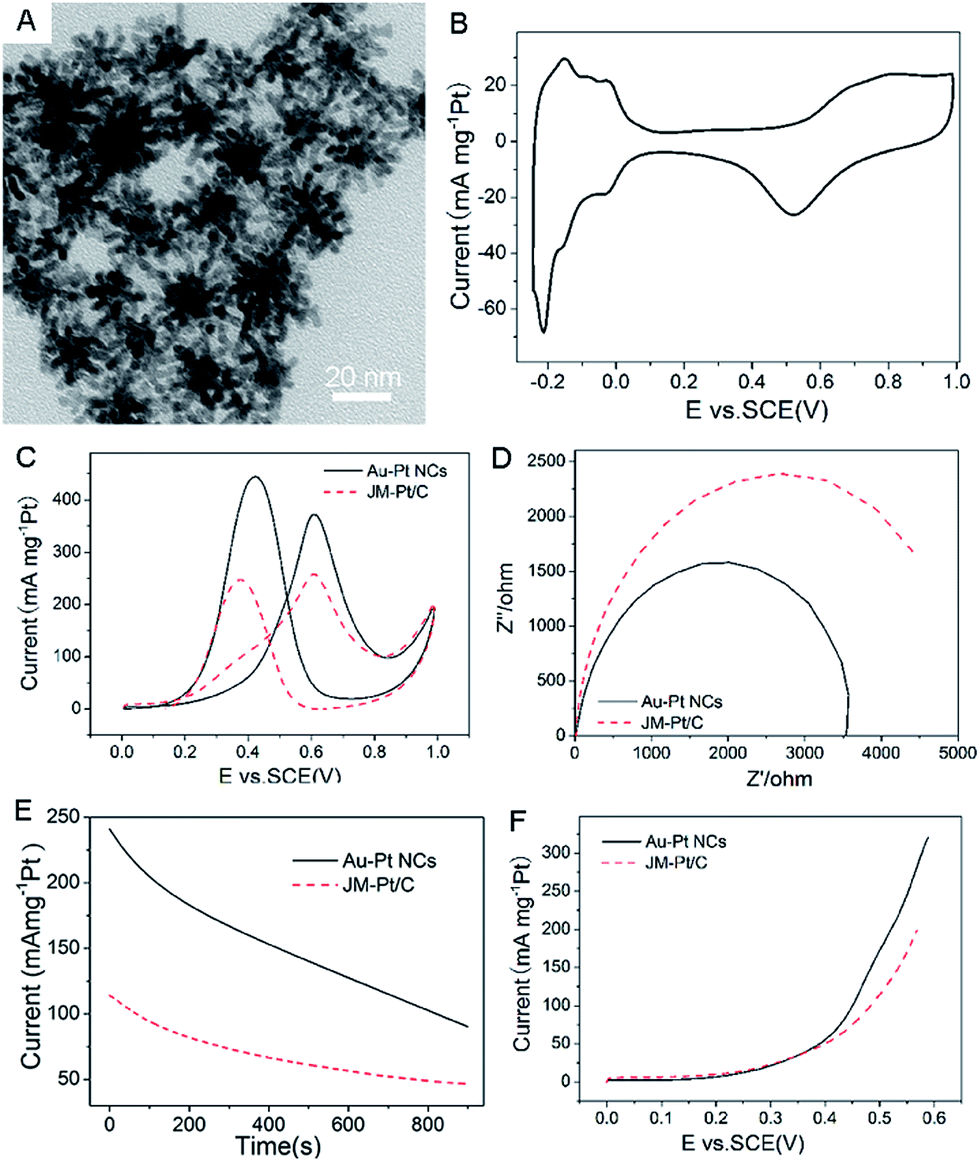 | ||
| Fig. 3 (A) A typical TEM image of Au–Pt NCs prepared at 90 °C for 2 h, (B) CVs of Au–Pt NCs in N2-saturated 0.5 M H2SO4, (C) CV, (D) electrochemical impedance spectra (EIS), (E) chronoamperometric results and (F) linear sweep voltammogram (LSV) curves of methanol oxidation by Au–Pt and commercial JM-Pt/C catalysts in N2-saturated 0.5 M H2SO4 + 0.5 M CH3OH. Scan rate: 50 mV s−1. | ||
The electrocatalytic behaviors of the NCs for a methanol-oxidation reaction were examined in detail. Fig. 3C shows typical CVs for the electrochemical oxidation of methanol over Au–Pt NCs and commercial JM-Pt/C catalysts; the CVs were recorded in an N2-saturated solution containing 0.5 M H2SO4 and 0.5 M CH3OH. All the catalysts exhibited characteristic double anodic peaks in the forward and reverse scans, which is a typical feature of methanol oxidation process. The current peak at approximately 0.60 V in the forward scan arose from oxidation of methanol, and the current peak at approximately 0.4 V in the reverse scan was attributed to the oxidative removal of CO and other incompletely oxidized carbonaceous species formed on the electrodes in the forward scan.23 In addition, the mass-normalized current density for the Au–Pt NCs (371.8 mA mg−1 Pt) is 1.44 times larger than that for the commercial catalyst (257.4 mA mg−1 Pt), showing a significant increase in mass current density.
The electrocatalytic stability and potential threshold, as the most important issues for practical applications in fuel cells, were also investigated. Fig. 3D shows that the alternating current impedance of the Au–Pt NCs is far smaller than that of the commercial JM-Pt/C catalysts, which means that the intrinsic electrocatalytic activity of the Au–Pt NCs is far smaller than that of the commercial catalysts. Fig. 3E shows the electrochemical activity and durability of the nanocrystals, measured using chronoamperometry, in an N2-saturated solution containing 0.5 M H2SO4 and 0.5 M CH3OH at a constant voltage of 0.5 V for 900 s. The current for the Au–Pt NCs decays from 241.5 mA mg−1 Pt to 90.0 mA mg−1 Pt, much higher over the whole duration of the experiment, in contrast to the commercial catalyst (from 113.8 mA mg−1 Pt to 46.5 mA mg−1 Pt). Besides, such NCs also exhibited the lowest potential for the methanol oxidation reaction at a given oxidation current density (Fig. 3F). These results indicated that the Au–Pt NCs had a satisfactory tolerance toward the carbonaceous species formed during the oxidation of methanol, and were much more electroactive and stable during the methanol oxidation reactions.
We also applied these NCs for electrocatalysis of formic acid oxidation. Fig. 4A shows typical CVs for this reaction. The exhibited characteristic double anodic peaks in the forward and reverse scans correspond to the typical feature for the oxidation of formic acid. The first peak at 0.3 V on the CV is related to the direct oxidation of HCOOH to form CO2 while the second peak at 0.66 V is related to the oxidation of the CO generated from the dissociative adsorption.25 The mass-normalized current density for these two oxidations reveals that the latter mechanism dominates this electrocatalysis for both NCs and the commercial catalyst. In addition, for the current density of Au–Pt NCs (137.1 mA mg−1 Pt) is 1.41 times larger than that for the commercial catalyst (97.5 mA mg−1 Pt), showing a significant increase in mass current density.
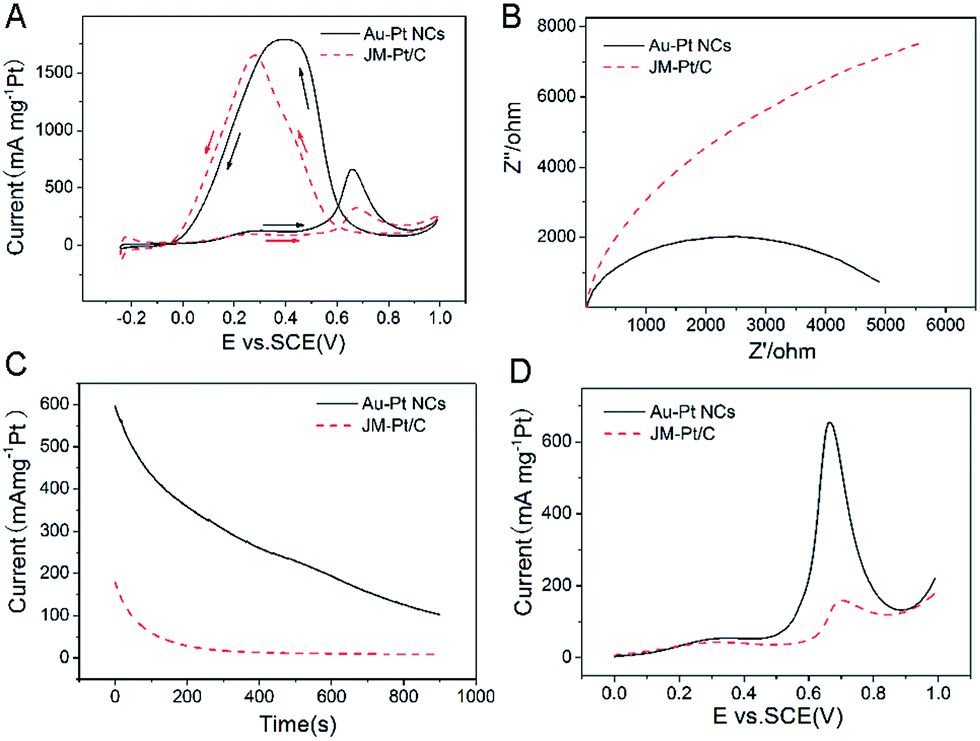 | ||
| Fig. 4 (A) CVs, (B) electrochemical impedance spectra (EIS), (C) chronoamperometric results and (D) LSV curves of formic acid oxidation by Au–Pt and commercial JM-Pt/C catalysts in N2-saturated 0.5 M H2SO4 + 0.5 M HCOOH. Scan rate: 50 mVs−1. | ||
As shown in Fig. 4B, the alternating current impedance of the Au–Pt NCs is far smaller than that of the commercial JM-Pt/C catalysts; this means that the intrinsic electrocatalytic activity of the Au–Pt NCs is much lower than that of the commercial catalyst. Fig. 4C shows the electrochemical activity and durability of the nanocrystals, as measured using chronoamperometry, in an N2-saturated solution containing 0.5 M H2SO4 and 0.5 M HCOOH at a constant voltage of 0.65 V for 900 s. The current decay for Au–Pt NCs is from 596.1 mA mg−1 Pt to 102.7 mA mg−1 Pt, higher than that of the commercial catalyst (from 179.4 mA mg−1 Pt to 8.6 mA mg−1 Pt) over the whole duration of the experiment. Besides, such NCs also exhibited the lowest potential for the formic acid oxidation reaction at a given oxidation current density. Besides, linear sweep voltammogram (LSV) curves also reveal that the CO oxidation dominates the process and the electroactivity is ∼4.1 times higher than that of the commercial catalyst, for this type of oxidation (Fig. 4D). These results indicated that the Au–Pt NCs had a satisfactory tolerance toward the carbonaceous species formed during the oxidation of formic acid, and were much more electroactive and stable during the formic acid oxidation reactions.
We also investigated the Au–Pt NCs grown under other conditions. Firstly, the NCs grown at 80 °C exhibited no branches (Au/Pt 211/18 mol/mol, Table S1†), which induce the absence of electrocatalytic activity over both methanol and formic acid oxidation (Fig. S3†). When the growth temperature was increased to 90 °C, the electrocatalysis CVs for methanol and formic acid gradually changed (Fig. S4–S8; Au/Pt 3/11-2/23 mol/mol, Table S1†). Note that, the typical double peaks for these two specimen electrocatalytic oxidations are formed when using the NCs grown at 30 min or longer time, which evidently revealed that the Pt nanobranch is very critical to trigger the electrocatalytic activity of the NPs. A comparison of the NCs grown at 5 h with those grown at 2 h indicated that there is an optimum size of nanobranch for their electrocatalytic activity, i.e., the overwhelm longer nanobranch may decrease their electrocatalytic activity, owing to the faded influence of Au NPs (Fig. S8†).
In conclusion, we here reported a facile approach for the synthesis of Au–Pt NCs with controllable composition and morphologies. We also found an optimized Au-to-Pt molar ratio of NCs, which ensures the most efficient eletrochemical activity and stability. The synthesized NCs were found to have enhanced electrocatalytic activity for direct oxidation of methanol and formic acid, which is promising for application in fuel cells.
Acknowledgements
This work was financially supported by the National Natural Science Foundation of China (no. 21373006, 51402203), Natural Science Foundation of Jiangsu Province for Young Scholars (BK20140326) and the Priority Academic Program Development of Jiangsu Higher Education Institutions (PAPD).Notes and references
- S. Guo and E. Wang, Nano Today, 2011, 6, 240–264 CrossRef CAS PubMed.
- A. Chen and P. Holt-Hindle, Chem. Rev., 2010, 110, 3767–3804 CrossRef CAS PubMed.
- P. K. Jain, X. Huang, I. H. El-Sayed and M. A. El-Sayed, Acc. Chem. Res., 2008, 41, 1578–1586 CrossRef CAS PubMed.
- J. Zhu, Y. Lu, Y. Li, J. Jiang, L. Cheng, Z. Liu, L. Guo, Y. Pan and H. Gu, Nanoscale, 2014, 6, 199–202 RSC.
- C. Wang, B. Peng, H.-N. Xie, H.-X. Zhang, F.-F. Shi and W.-B. Cai, J. Phys. Chem. C, 2009, 113, 13841–13846 CAS.
- R. Mu, Q. Fu, H. Xu, H. Zhang, Y. Huang, Z. Jiang, S. Zhang, D. Tan and X. Bao, J. Am. Chem. Soc., 2011, 133, 1978–1986 CrossRef CAS PubMed.
- X. Yang, Q. Yang, J. Xu and C.-S. Lee, J. Mater. Chem., 2012, 22, 8057–8062 RSC.
- C. Bartual-Murgui, L. Salmon, A. Akou, N. A. Ortega-Villar, H. J. Shepherd, M. C. Muñoz, G. Molnár, J. A. Real and A. Bousseksou, Chem.–Eur. J., 2012, 18, 507–516 CrossRef CAS PubMed.
- S. Zhou, G. S. Jackson and B. Eichhorn, Adv. Funct. Mater., 2007, 17, 3099–3104 CrossRef CAS.
- H. Ataee-Esfahani, L. Wang, Y. Nemoto and Y. Yamauchi, Chem. Mater., 2010, 22, 6310–6318 CrossRef CAS.
- B. Du, O. Zaluzhna and Y. J. Tong, Phys. Chem. Chem. Phys., 2011, 13, 11568–11574 RSC.
- M. Min, C. Kim, Y. I. Yang, J. Yi and H. Lee, Chem. Commun., 2011, 47, 8079–8081 RSC.
- L. Feng, X. Wu, L. Ren, Y. Xiang, W. He, K. Zhang, W. Zhou and S. Xie, Chem.–Eur. J., 2008, 14, 9764–9771 CrossRef CAS PubMed.
- M. Schrinner, S. Proch, Y. Mei, R. Kempe, N. Miyajima and M. Ballauff, Adv. Mater., 2008, 20, 1928–1933 CrossRef CAS.
- L. Kuai, S. Wang and B. Geng, Chem. Commun., 2011, 47, 6093–6095 RSC.
- J. Wang, D. F. Thomas and A. Chen, Chem. Commun., 2008, 5010–5012 RSC.
- S. Wang, N. Kristian, S. Jiang and X. Wang, Nanotechnology, 2009, 20, 025605 CrossRef PubMed.
- N. Kristian and X. Wang, Electrochem. Commun., 2008, 10, 12–15 CrossRef CAS PubMed.
- Y. Yu, Y. Hu, X. Liu, W. Deng and X. Wang, Electrochim. Acta, 2009, 54, 3092–3097 CrossRef CAS PubMed.
- H. Hiramatsu and F. E. Osterloh, Chem. Mater., 2004, 16, 2509–2511 CrossRef CAS.
- Y. Pan, J.-H. Gao, B. Zhang, X.-X. Zhang and B. Xu, Langmuir, 2010, 26, 4184–4187 CrossRef CAS PubMed.
- S. Mourdikoudis and L. M. Liz-Marzán, Chem. Mater., 2013, 25, 1465–1476 CrossRef CAS.
- H. Wu, S. Mei, X. Cao, J. Zheng, M. Lin, J. Tang, F. Ren, Y. Du, Y. Pan and H. Gu, Nanotechnology, 2014, 25, 195702 CrossRef PubMed.
- N. Aguilera-Porta, M. Calatayud, C. Salzemann and C. Petit, J. Phys. Chem. C, 2014, 118, 9290–9298 CAS.
- N. Kristian, Y. Yan and X. Wang, Chem. Commun., 2008, 353–355 RSC.
Footnote |
| † Electronic supplementary information (ESI) available: Details of general experimental procedures. See DOI: 10.1039/c4ra13285h |
| This journal is © The Royal Society of Chemistry 2015 |