
Highly organized nanofiber formation from zero valent iron nanoparticles after cadmium water remediation
Keyla T. Soto Hidalgoab,
Rolando Guzmán-Blasc,
Edwin O. Ortiz-Quilesc,
Estevão Rosim Fachinid,
Juan Corchado-Garcíac,
Eduardo Lariosef,
Beatriz Zayasg,
Miguel José-Yacamáne and
Carlos R. Cabrera*c
aUniversity High School, University of Puerto Rico at Río Piedras, San Juan, 00931, Puerto Rico
bDepartment of Environmental Sciences, University of Puerto Rico at Río Piedras, San Juan, 00931, Puerto Rico
cDepartment of Chemistry and Physics, University of Puerto Rico at Río Piedras, P.O. Box 70377, San Juan, 00936-8377, Puerto Rico. E-mail: carlos.cabrera2@upr.edu
dPhysical Sciences Department, University of Puerto Rico at Río Piedras, San Juan, 00931, Puerto Rico
ePhysics and Astronomy Department, University of Texas at San Antonio, San Antonio, Texas 78249, USA
fDepartamento de Ingeniería Química, Universidad de Sonora, 83000 Hermosillo, Sonora, México
gSchool of Environmental Affairs, Metropolitan University, San Juan, 00928, Puerto Rico
First published on 27th November 2014
Abstract
Many studies have used nanoscale zero valent iron (nZVI) nanoparticles to remove redox-sensitive metals (e.g., As, Cr, U, Se, Ni, Cu) from aqueous systems by absorption or reduction processes. However, very few investigations present a detailed study of the product formed after the remediation process. In order to quantify the efficiency of nZVI particles as a possible cadmium remediation agent, we prepared nZVI by sodium borohydride reduction of an iron complex, FeCl3·6H2O, at room temperature and ambient pressure. Fe0 and nanocrystalline structures of iron oxides and oxyhydroxides were obtained with this method. We exposed the nZVI to 6 ppm of Cd2+ and characterized the products with X-ray diffraction, X-ray absorption and X-ray photoelectron spectroscopy. Inductively coupled plasma analysis showed that the nZVI remediation efficiency of cadmium ions was between 80% and 90% in aqueous media. All of the physical characterization results confirmed the presence of Fe0, α-Fe2O3 and FeOOH. High resolution transmission electron microscopy images showed nanofiber formation of a mixture of Fe0, oxyhydroxides and oxides iron formed after interacting with cadmium ions, possibly forming CdFe2O4. These results suggest that the FeOOH shell and other iron oxides in nZVI could enhance Cd2+ removal. This removal is observed to cause a change of the initial structure of nZVI to nanofibers due to possible formation of CdFe2O4 as a waste product.
A. Introduction
Cadmium is a metal used today by industry (e.g. electronic industry) that has been released to the environment through the combustion of fossil fuels, metal production, use of phosphate fertilizers, electroplating, and the manufacturing of batteries, pigments, and computer screens.1 This metal tends to accumulate in plant and animal tissues, reaching dangerous levels in the food chain, even when released in small amounts.2–4 Cadmium is toxic at high concentrations because it disrupts enzyme functions, replacing essential metals in pigments or producing reactive oxygen species.5 It is poorly retained by the soil and is readily absorbed by plants.2,4,6 This heavy metal can be accumulated in leaves and cause phytotoxic effect on plants, such as chloroplast structure change and cell death.7,8 In hazardous waste sites, the levels of cadmium in the soil has become about 4 parts per million, while in water the levels have reached 6 ppm.9U.S. Environmental Protection Agency (EPA) recognize cadmium to be a probable human carcinogen (e.g. breast cancer) and has been classified as a Group B1 carcinogen.9–11 Since cadmium represents a great threat to human health, considerable effort has been placed on the development of techniques to remove this contaminant from water.12
In the course of developing suitable options to treat heavy metal contaminants in wastewater, nanoscale zero valent iron (nZVI) particles have been found to be an alternative approach to reduce the concentration of several kinds of contaminants.13,14 This approach provides a real alternative to remove cadmium by using particles at nanoscale. Cadmium remediation is of the utmost importance because Cd species have been detected in aquatic ecosystems and found to bioaccumulate in organisms in nanomolar to micromolar concentrations.2 Iron nanoparticles are particularly attractive for remediation purposes due to their significant surface area to mass ratio, leading to a greater density of reactive site and heavy metal removal capacity.14 Because of their smaller size, nanoscale based iron materials are much more reactive than conventional iron powders and they can be easily suspended in slurry and pumped straight to the contaminated site.15,16 Efficient nZVI remediations of groundwater contaminants have been shown in multiples studies.12,17–20 However, in the literature there is a lack of comparable studies for different nZVI materials and deployment strategies.13
Very few investigations of nZVI materials present a detailed study of the products formed in the remediation process. Various adsorption and kinetic models to describe metal adsorption on nZVI and Cd–nZVI surfaces using SEM/EDX and XPS measurements have been studied1,13 but, to our knowledge, the interactions between surface Fe(0) and Cd(II) and subsequent cadmium retention in nZVI particles has not been the subject of detailed study. The specific objectives of this work are to (1) analyze by inductively couple plasma measurements the efficiency of the nanoscale zero valent iron (nZVI) at low treatment dose in the removal of Cd(II); (2) characterize the nanoparticles of Fe0, Fe0–H2O and Fe0–Cd using spectroscopy and microscopy techniques; and (3) establish a conceptual model of the Cd ions with the surface of nZVI. Results from this study provide important information of the products formed during the remediation process of cadmium. We also report an unexpected nanofiber formation and the potential synthesis of cadmium ferrite. This remediation product has been suggested as a photocatalyst material that has tremendous potential application for light harvesting.21 These results could be useful because by understanding the products of remediation processes, alternative applications may be suggested for them. This will decrease the amount of new toxic substances formed after water remediation processes.
B. Experimental
B.1. Chemicals
The chemicals used were iron(III) chloride hexahydrate (97%, ACS reagent), sodium borohydride (≥98.5%, reagent grade), trichloroethylene (99.5+%, ACS reagent), Tween® 80 and humic acid (sodium salt) obtained from Sigma-Aldrich, FeCl3·6H2O (F2877 Sigma Aldrich), NaBH4 (Alfa Aesar), ethanol 200 proof, 99.5% anhydride (Sigma Aldrich), Cd (CHOO3)2·2H2O (Sigma Aldrich) and HCl (Alfa Aesar). All solutions were prepared with deionized water (18.2 MΩ cm, Nanopure Diamond, Barnstead).B.2. Preparation of nanoscale zero valent iron
Nanoscale zero valent iron (nZVI) particles were produced by adding NaBH4 as the reducing agent to a solution of FeCl3·6H2O. The resulting reductive reaction may be given as:22| 2Fe3+ + 6BH4− + 18H2O → 2Fe0(s) + 6B(OH)3 + 21H2 | (1) |
To obtain 1.13 g of nZVI, a 0.6 M solution of FeCl3·6H2O (molar mass 270.30 g mol−1) was prepared in 30 mL of ethanol (83% v/v) and nanopure water (17% v/v). The solution was purged with N2 for 30 minutes to remove oxygen prior to the reaction; this was done to avoid the rapid oxidation of iron. Then, the solution was titrated by adding a total of 100 mL of 0.8 M NaBH4 aqueous solution under a nitrogen atmosphere.
After 30 minutes of stirring with a magnetic bar at 700 rpm, the solution was filtered using a 0.22 μm filter paper (Millipore) under vacuum at 25 °C.
The sample was rinsed three times with 99% absolute ethanol. Various filtered samples, prepared as mentioned, were placed immediately in a vacuum desiccator.
B.3. Preparation of cadmium concentrations in synthetic wastewater
Cadmium solutions were prepared using Cd(CH3COO)2·2H2O due to its high solubility in water and ethanol. To represent different samples of wastewater contaminated with cadmium, a solution of 6 ppm was prepared. This was followed by two dilutions of the 6 ppm solution (stock concentration) to prepare solutions of 3 ppm and 1 ppm. The initial pH of each solution was adjusted to 2 using 1.0 M HCl. Concentration units were presented as “ppm” in keeping with toxicity nomenclature (ppm = mg L−1).B.4. Determination of the reduction of the cadmium concentration in aqueous solution nZVI
All reactions were carried out in a dry box under argon atmosphere to prevent Fe oxidation. In some treatment processes with 1 ppm or more of Zn (which has chemical properties similar to Cd) the dose used was between 1.0 g L−1 to 3.5 g L−1 of nZVI.23 Here, 200 mL of all the prepared cadmium solutions of 1, 3 and 6 ppm were treated with 3.0 g L−1 of nZVI in periods of 1, 3, and 5 hours. One sample of each solution was taken before and after treatment to corroborate the accuracy in the preparation of the initial concentrations and to determine the final concentration of cadmium.The pH of each cadmium solution was determined before and after adding the nZVI. To determine the effect of the nanoparticles in the amount of cadmium ions in the samples after certain reaction time, the samples were processed and analyzed using inductively coupled plasma (ICP-AES) Model: PerkinElmer 4300 DV with a detection limit of 0.002 ppm for cadmium.
B.5. Characterization of Fe0, Fe0/H2O and Fe0/Cd particles
Characterization of nZVI is needed to understand their reaction mechanism and kinetics.18 In this study, the synthesized nanoparticles and nanofibers were characterized by X-ray Photoelectron Spectroscopy (XPS), X-ray Absorption (XAS), High Resolution Transmission Electron Microscopy (HRTEM) and X-ray diffraction (XRD).HRTEM images were done with a Cs-corrected JEOL JEMARM200F electron microscope operated at 200 kV and equipped with a CEOS Cs corrector on the illumination system. XRD patterns were obtained on a PANalytical X'Pert Material Research Diffractometer operating with a Cu Kα radiation (λ = 1.54 Å) source. XPS binding energy spectra were obtained using a PHI spectrometer equipped with an Al Kα mono and polychromatic X-ray source operating at 15 kV, 350 W and pass energy of 58.70 eV. All the binding energies reported were corrected fixing the carbon 1s peak (C 1s) at 284.5 eV. X-ray absorption spectroscopy (XAS) was carried at National Synchrotron Light Source (NSLS) in Brookhaven National Laboratory (BNL) using beam line X18A. The iron K edge (7112 eV) was measured for the Cd–nZVI sample in transmission mode. The data acquisition setup consisted of three 12 in. ionization chamber detectors: incidence (I0) transmittance (IT) and reference (IRef) detector.
Data analysis was done with the Demeter Suite of Programs.24 The Athena software was used for linear combination fittings of the X-ray Absorption Near Edge (XANES) region with theoretical XANES spectra of different iron species. The reference spectra were calculated with the Hephaestus program.
C. Results and discussion
C.1. Analysis of reduction process in cadmium concentration after treatment with Fe0 nanoparticles
Previous researchers have studied redox and adsorption processes as mechanisms of metal concentration reduction by nanoscale iron.15 However, there is very little research that presents in detail adsorption features that occur with certain metals (i.e. cadmium).13 Iron nanoparticles have standard a reduction potential (E°) of −0.447 V, which is lower than the reduction potential of cadmium (−0.40 V, 25 °C).1,13 Similar with other studies, our data suggest that Cd2+ is sequestrated on nZVI by adsorption or surface complex formation with no apparent reduction of Cd2+.25To analyze the results and determine the concentration reduction of cadmium in the nZVI sample, we used ICP. According to the results, we observe a change in the decrease of cadmium concentration as treatment time elapsed. The maximum percentages of cadmium adsorption relative to the initial concentration (% CCd) for Cd2+ aqueous solutions of 1, 3 and 6 ppm were 93%, 91% and 89%, respectively (see Fig. 1). These percentages were obtained in a period of 5 hours, which indicates that longer interaction times between cadmium ions and nZVI promoted larger cadmium concentration reduction.
 | ||
| Fig. 1 Bar graph of the ratio between final and initial cadmium(II) ion concentration (CCd) versus time. The nZVI concentration (CFe) was 3 g L−1 and cadmium concentrations (C0) were 1, 3 and 6 ppm. Experimental conditions: pH = 2; 25 °C; argon atmosphere; magnetic bar stirrer at 700 r min−1. | ||
The correlation between the final concentration versus time and the coefficient of determination (R2) for the three concentrations was calculated. The correlations for the 6 ppm, 3 ppm, and 1 ppm Cd2+ samples gave values of 0.944, 0.989 and 0.992, respectively. These values indicate that the percentage of the variability of the final cadmium concentration may be proportional with respect to reaction time. Nevertheless, for the 6 ppm Cd2+ sample, there seems to be an induction period until the pH reaches a value higher than 4 when the rate of adsorption increases and reaches the same rate as the 3 and 1 ppm samples after 3 hours (Fig. 2).
 | ||
| Fig. 2 Correlation of the final cadmium concentration and solution pH vs. time using nZVI with initial pH of 2 and CFe = 3 g L−1; initial Cd2+ concentrations of 1, 3, and 6 ppm; temperature of 25 °C and under argon atmosphere; magnetic bar stirrer was at a w of 700 r min−1. | ||
The samples showed changes of pH from 2 to 6 with increasing cadmium treatment time. This is due to the formation of hydroxides (OH−) on the surface of the nZVI by its interaction with water.23 The maximum cadmium reduction efficiency was greater in 5 hours of treatment. Previous studies suggested that the rate and efficiency in metal reduction increases as the pH decreases.25 When water has a basic initial pH, iron may precipitate as an oxyhydroxide. The presence of this elements cause a passivation on the surface of the iron nanoparticles. Thus, acidic pHs should be used for best results.23
These studies prove that nZVI are a viable option in order to decrease cadmium contamination in affected sites. Since cadmium is being removed from the solution, it must mean that the nZVI plays a role in cadmium sequestering. Thus, it is expected that the used nZVI contains cadmium, which would in turn make the remediation product toxic. For this reason, we decided to analyze the structure of used nZVI in order to gain an understanding of the interactions between nZVI and cadmium. This new knowledge may serve to optimize the remediation process and to provide alternatives uses for the remediation product.
C.2. X-ray photoelectron spectroscopy analysis
In the XPS binding energy spectrum, we observed peaks for Fe 2p3/2 and O1s of the prepared nanoparticles (Fig. 3A). The XPS spectrum also shows other peaks for oxygen, iron and adventitious carbon (from atmosphere contamination). The amount and extension of rinsing was determined following the presence or absence of B1s and Na1s peaks at the XPS spectrum. Rinsing in this synthesis procedure is a critical step, necessitating the use of absolute alcohol, because water promotes rapid oxidation when the samples are exposed to the atmosphere.26 Cd–nZVI particles were analyzed by high resolution XPS to determine the elemental composition and the valence state of elements on the nZVI surface. | ||
| Fig. 3 X-ray photoelectron spectroscopy spectrum of nZVI particles (A) and spectra of the Fe 2p binding energy region for (B) freshly synthesized and (C) one year old, under dry air, of nZVI particles. (D) Spectra of the Cd 3d binding energy region for the samples of nZVI particles exposed to 6 ppm Cd2+ aqueous solution (3 g L−1 of nZVI, contact time of 5 h). | ||
The Fe 2p3/2 peak in the XPS spectrum for elemental iron commonly arises at 707 eV.27 The Fe 2p3/2 peak located at 711 eV was ascribed to ferric iron.
Since the major contribution on the Fe 2p3/2 envelope from a fresh iron nanoparticles sample corresponds to Fe(III) (see Fig. 3B), the particles should have a core of metallic iron surrounded by a thick outer shell of iron oxides/hydroxides. Probably this oxygenated iron layer was rapidly formed after the particles had been exposed to the atmosphere. The FWHM for the FeIII 2p3/2 peak in the XPS spectrum was large (4.0 eV) which also suggests multiple oxidized species of iron on the surface.
This interpretation is compatible with the XPS spectrum for the oxygen that presented great amounts of metal oxides (530.0 eV, 41%) and metal hydroxides (531.5 eV, 57%) species, as determined by deconvolution treatment on the O1s binding energy peak (data not shown). The O1s peak also indicates that water was practically absent on the surface, since any significant contribution (less than 2%) was found for the O1s peak at binding energies higher than 533 eV. Examining the ratio of peak areas Fe/OH and OH/O2− it was established that the covering oxide layer may be composed of iron hydroxides or oxyhydroxides. This is an important observation because the mechanism for aqueous metal contamination adsorption is regulated by the presence of different oxygenated groups on the particle surface. A number of mechanisms have been proposed, depending also of the adsorption conditions such as pH and the kind of metal ion that is being fixed on the surface.26–28 The binding energy difference between Fe 2p3/2 and Fe 2p1/2 was 13.6 eV, making the assignment of the principal iron specie as FeIII in Fe2O3 and FeOOH.28
In the XPS spectrum, metallic iron was only identified in fresh samples (see Fig. 3B). After approximately 12 months aging, little or any presence of the zero valence iron could be determined (see Fig. 3C).
The arrows in the spectra indicate the Fe 2p satellites contribution, which are characteristic of Fe(III) state. The spectrum also suggests small amounts of Fe(II) for freshly prepared nanoparticles, since a small shoulder can be seen in Fig. 3B at 729 eV. This is because iron reacts not only with the contaminants, which are generally present at low concentrations, but also with dissolved oxygen and with water as shown below.29
| 2Fe0(s) + O2(g) + 4H+ → 2Fe2+(aq) + 2H2O(l) | (2) |
| Fe0(s) + 2H2O → Fe2+(aq) + H2(g) + 2OH−(aq) | (3) |
Through a high resolution XPS, Cd 3d3/2 and 3d5/2 peaks can be observed (see Fig. 3D). After completing the deconvolution of the peaks, a Cd2+ signal can be detected, especially at 405 eV which is in accordance with the values reported for in the literature.13 The XPS results confirm the ICP data; the reduction of cadmium concentration on the test solutions is due to nZVI. Data suggest that Cd2+ is sequestrated within nZVI by adsorption or surface complex formation with no apparent reduction on the nZVI surface.
C.3. XAS analysis
XPS studies confirmed the presence of both cadmium and oxygen containing iron species on the nZVI surface. Due to the limitations of the surface sensitive XPS technique, XAS experiments were performed because they can provide a better understanding of the bulk composition of the various oxygen containing iron species.30,31 The linear combination fit was done in the 7092 eV and 7142 eV range of the sample spectrum and the theoretical spectra. The fit was done with reference spectra of Fe0, Fe2O3, ferrihydrite, FeO(OH) and γ-FeO(OH). 25 different combinations of the 5 reference spectra were performed and the model with the least residual error was chosen.Fig. 4 shows that a good fit was achieved with the reference spectra used and Table 1 summarizes the percent composition results. The predominant oxygen containing iron species in the Cd–nZVI sample were ferrihydrite and α-Fe2O3 which is consistent with the XPS analysis. This implies that ferrihydrite and α-Fe2O3 can be found both in the surface of the sample and in the bulk. The linear combination fitting detected the presence of metallic iron in the Cd–nZVI sample whereas the XPS shows almost no metallic iron signals. The apparent contradiction between XPS and XAS can be explained by the fact that the metallic iron contained in the samples is covered by and oxidized iron layer. The surface sensitive XPS technique cannot detect it but the bulk sensitive XAS technique can. This suggests that the structure of the Cd–nZVI may contain an Fe0 core surrounded by a shell made up of ferrihydrite and α-Fe2O3. This hypothesis is confirmed by HRTEM studies discussed later. The presence of α-Fe2O3 throughout the bulk is particularly interesting because studies show that CdFe2O4 is formed under similar conditions as those in this study when α-Fe2O3 is in the presence of Cd2+. In order to confirm the formation of CdFe2O4, XRD and HRTEM studies were performed.
 | ||
| Fig. 4 XANES region of the XAS measurements of the Cd–nZVI particles with the theoretical linear combination peak with reference spectra of Fe0, Fe2O3, ferrihydrite and FeO(OH). | ||
| Iron species | Composition% |
|---|---|
| Fe0 | 23% |
| α-Fe2O3 | 17% |
| Ferrihydrite | 47% |
| FeO(OH) | 13% |
| γ-FeO(OH) | 0% |
C.4. X-ray diffraction patterns
Three XRD patterns with broad peaks characteristic of small particles are shown in Fig. 5. In Fig. 5A, a nZVI sample pattern with two peaks at 44.9° and 65.1°, which indicate the presence of body-centered cubic crystal Fe0, is presented. Both peaks are in good agreement with those reported in the literature.32–35 In the next pattern (Fig. 5B), nZVI were placed in water for 5 hours as a blank to compare the oxidation states without the presence of cadmium. The intensity of the characteristic peak for Fe0 near 44.9° decreases in this pattern. A possible explanation to this change is a strong interaction of the iron with the oxygen either from the atmosphere at the time of preparation or the hydroxides (OH–) group from the water. Preliminary results indicate that these iron nanoparticles can prevent oxidation under atmospheric conditions for extended periods.18,21,22 Characteristic peaks of hematite (α-Fe2O3) were identified.36 Xiaoqin Li et al. also proves the formation of Fe2O3 and FeOOH in a previous work.37,30 | ||
| Fig. 5 X-ray diffraction pattern of nZVI particles synthesized using the sodium borohydride reduction method. (A) Pure nZVI particles freshly synthesized; (B) nZVI particles exposed to nanopure water (3 g L−1 of nZVI, contact time of 5 h) and (C) nZVI particles exposed to 6 ppm Cd2+ aqueous solution (3 g L−1 of nZVI, contact time of 5 h). | ||
In this work, we obtained similar peaks of α-Fe2O3 and FeOOH visible at 30.2°, 38.0°, 43.3°, 49.1°, 57.2° and 62.8°; and 27.1°, 35.6°, 46.9°, 52.9° and 60.6°, respectively.
In Fig. 5C, an XRD pattern of nZVI at 3 g L−1 placed for 5 hours with 6 ppm of Cd2+ is presented. This pattern has several peaks that required a comprehensive analysis. Previous studies show that CdFe2O4 may occur in similar chemical environments as the one presented in this work. Fig. 5C due to the low amount of cadmium used during the preparation of the sample. A pattern analysis was completed and characteristic peaks were identified for Fe0: 44.7° and 65.0°; α-Fe2O3: 36.3°, 38.2°, 43.2°, 49.1° and 62.7°; FeOOH: 27.1°; and CdFe2O4: 30.1°, 35.6°, 46.9°, 52.6°, 57.1° and 60.6°.38,21 Diffraction lines of Fe2O3 in the XRD pattern of nZVI exposed to Cd indicates that possible formation of CdFe2O4 is partial.39 This analysis was done taking in consideration that possible CdFe2O4 formation can occur at different temperatures based on previous works.39–41
An important observation is the nZVI peak in 44.7° has a higher intensity in Fig. 5C than in Fig. 5B. The change in intensity may be explained as a result of cadmium interacting with oxygen. This reaction prevents iron to have enough oxygen available to fully react with it, preserving metallic iron integrity. In general, intensity changes of all peaks are observed in both samples (Fig. 5B and C), suggesting different physical arranges after the cadmium exposure to nZVI. These results can be explained by a strong interaction between the Fe(III), O and Cd(II) detected in the XPS results, probably by the formation of cadmium ferrite.
The mean crystallite size (L) of nZVI samples can be calculated by using Scherrer's equation:42
L = 0.9λ/(B2θ![[thin space (1/6-em)]](https://www.rsc.org/images/entities/char_2009.gif) cos(2θ)) cos(2θ))
| (4) |
The pure iron standard had a Fe0 particle size of 7.7 nm, the Fe0–H2O sample, where we observe Fe2O3, FeOOH and small quantities of Fe0, had a particle size of 16.6 nm. The samples with Fe0–Cd, where FeOOH, Fe2O3, Fe0 are clearly observed and possible formation of CdFe2O4 was identified, had a particle size of 12.4 nm. The observed decrease in the average particle size of the samples with the possible formation of CdFe2O4 with respect to samples of Fe2O3 and iron oxides is referred to the strong chemical affinity of Cd2+ to the tetrahedral A site and the metastable cation distribution in the nanoscale range of the ferrites particles.46 These chemical characteristics can help explain that there is a dependence of particle size with the stoichiometry of the cations.
C.5. High resolution transmission electron microscopy
HRTEM images of synthesized iron nanoparticles exhibit spherical shapes and chain aggregates (see Fig. 6A and B) as shown by others.43 These images show that the particles have a diameter range between 25 nm and 64 nm. The aggregates may be due to the magnetic properties of Fe0, which promotes iron linear orientation.44–46 | ||
| Fig. 6 Transmission electron microscopy images of nZVI particles after suspension in pure water. Experimental conditions: nZVI particles concentration of 3 g L−1; pH adjusted to 2 with dilute solution of HCl, temperature at 25 °C, argon atmosphere; 5 hours; magnetic bar stirrer at 700 r min−1. | ||
The pure iron standard had an Fe0 particle size of 7.7 nm, the Fe0–H2O sample, where we observe Fe2O3, FeOOH and small quantities of Fe0, had a particle size of 16.6 nm. The samples with Fe0–Cd, where FeOOH, Fe2O3, Fe0 are clearly observed and possible formation of CdFe2O4 is identified, had a particle size of 12.4 nm. The observed decrease in the average particle size of the samples with the possible formation of CdFe2O4 with respect to samples of Fe2O3 and iron oxides is referred to the strong chemical affinity of Cd2+ to the tetrahedral A site and the metastable cation distribution in the nanoscale range of the ferrites particles.46 These chemical characteristics can help explain that there is a dependence of particle size with the stoichiometry of the cations.
The HRTEM images (see Fig. 6C and D) show a core–shell structure where the core is Fe and the shell may be iron oxides such as FeOOH, α-Fe2O3 (see Fig. 6B). The HRTEM images of the Cd2+ treated nZVI show nanofiber formation (see Fig. 7), while the HRTEM images of untreated nZVI samples do not present nanofibers, only clusters and nanoparticles.
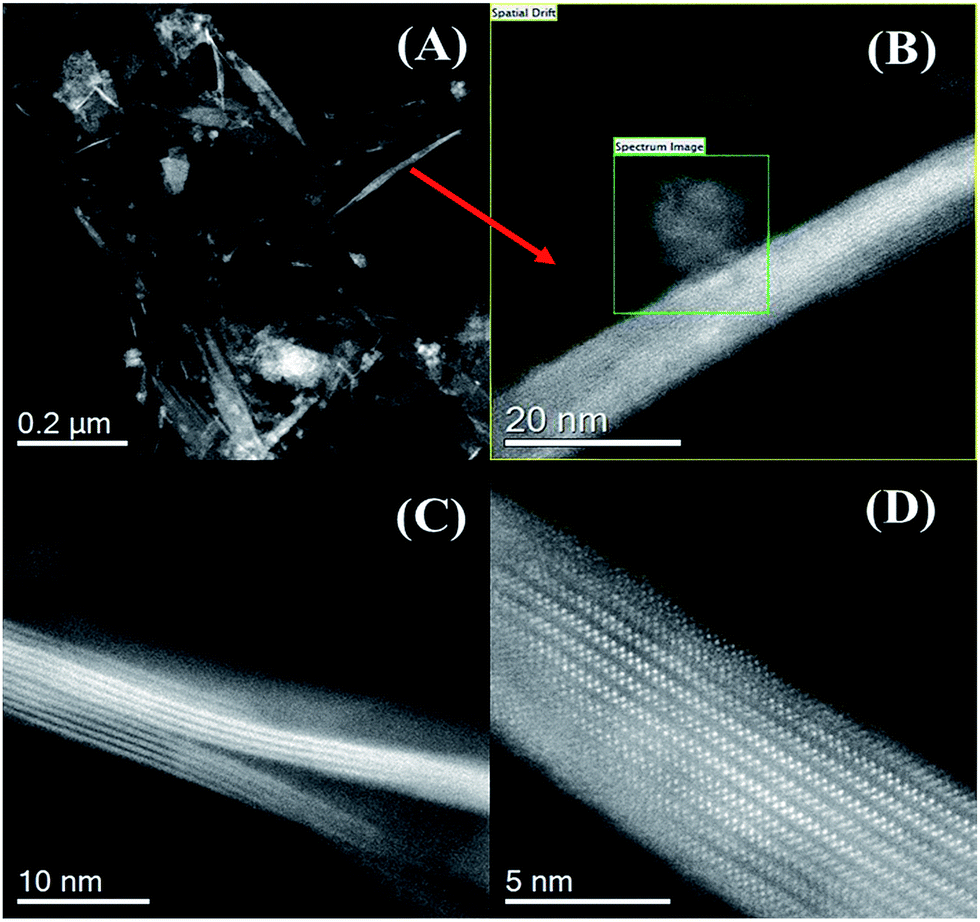 | ||
| Fig. 7 High resolution transmission electron microscopy of iron nanofibers formed during the cadmium ion remediation process. The contact time was 5 h, the nZVI concentration (CFe) was 3 g L−1; and Cd(CH3COO)2·2H2O concentration (C0) was 6 ppm. Experimental conditions: pH = 2; 25 °C; argon atmosphere; magnetic bar stirrer at 700 r min−1. | ||
The presence of two nano-constituents in the core–shell structure may impart dual properties for contaminant removal: the metallic iron acts as the electron source and exerts a reducing character, while the oxide shell facilitates the sorption of contaminants via electrostatic interactions and forming complexes with the surface. At the same time, the oxide shell allows electron passage from the metal core.47
A structural model of Cd-nZVI fibers is illustrated in Fig. 8. We proposed this conceptual model of Fe0(nZVI), FeOOH/α-Fe2O3 and CdFe2O4/α-Fe2O3/FeOOH nanofibers considering the results of XRD patterns, XPS, XAS and HRTEM images. Fig. 8A shows the Fe0 nanoparticles, Fig. 8B shows the Fe0–H2O where we observe Fe2O3 and FeOOH surrounding small quantities of Fe0 and Fig. 7C shows Fe0–Cd where we observe CdFe2O4, FeOOH, Fe2O3 and Fe0. In the case of the formation of the structure of Fig. 8C, cadmium ions act as the limiting reagent, where the onset of the reaction of Cd, Fe0, Fe2O3 and FeOOH allowing the possible formation of cadmium ferrite. Henceforth, the structure changes detected by HRTEM are consistent with the presence of Cd ions in the sample as presented in XPS and XRD studies.
 | ||
| Fig. 8 Conceptual model of cadmium adsorption process on nZVI nanostructures with cadmium–iron oxides on the surface. | ||
The oxyhydroxide iron (FeOOH) has a crystal structure containing tunnel-shaped cavities that run parallel to the c-axis. This sites are bound by double rows of fused octahedral in which cadmium ions probably reside.41
This is important for understanding that the presence of cadmium ions with FeO and other iron oxides (e.g. Fe(OH)2) is one of the possible interaction that promotes the formation of cadmium ferrite, therefore we propose:
| 2Fe2+ + Cd2+ + 4OH− → CdFe2O4 + 2H2 | (5) |
The fiber formation as product of nZVI in the presence of cadmium ions possibly is due to the rearrangement of the nanomaterial structure as a consequence of the adsorption process. Fig. 8 shows a schematic of the possible surface reaction.
The interactions of Cd2+ and Fe3+ particularly, possibly promote the CdFe2O4 formation which is in accordance with what is reported in the literature.39 Our results showed the fiber formation as previous studies in the literature with CdFe2O4 particles synthesized by coprecipitation method.41 These studies showed the aggregation of fine particles of CdFe2O4 having two kinds of shapes, fibrous and granular in HRTEM. Due to the fact that XPS and XAS analysis showed that we had the necessary precursors to synthesize CdFe2O4 in our system and because of the formation of the nanofibrous structures, we can conclude that our remediation process has CdFe2O4 as a product.
D. Conclusions
nZVI were synthesized using chemical reduction technique and exposed to a Cd–water environment. Accordingly to results obtained in the XPS, XRD and HRTEM techniques, ICP study confirm that cadmium has been removed from water and integrated to the iron oxide after the nZVI treatment. A comprehensive characterization confirmed the production of highly organized nanofibers composed of iron oxides and cadmium ferrite after adding nZVI contact with the cadmium solution. Cd ions were removed from the solution at ca. 90% in 5 h by a pH dependent process. Optimum operational pH was identified at a range between 2 and 4. As general overview of the results, hydroxides groups are important to assure the nZVI particles interaction with Cd ions, yet there is a compromise were pH higher than 4 induce a surface passivation that exacerbates when this pH increased. The unintended formation of CdFe2O4 nanofibers as a remediation product presents an opportunity to reuse the remediation products for applications pertaining to light harvesting.Acknowledgements
The authors acknowledge the use of facilities of the Materials Characterization Center of the University of Puerto Rico. We would like to thank Dr Lisandro Cunci (UPR) and Josue Ortiz for the XRD and XPS analysis. This work had financial support of NASA-URC Grant no. NNX10AQ17A. Financial support of the NSF-NSEC Center for Hierarchical Manufacturing, Grant no. CHM-CMMI-0531171, is also gratefully acknowledged. The authors of this work would like to thank the NSF PREM Grant no. DMR-0934218, Title: Oxide and Metal Nanoparticles. The Interface between life sciences and physical sciences. The authors would also like to acknowledge The Welch Foundation Agency Project # AX-1615, “Controlling the Shape and Particles Using Wet Chemistry Methods and Its Application to Synthesis of Hollow Bimetallic Nanostructures” and to NSF for its support through Grants DMR-1103730, “Alloys at the Nanoscale: The Case of Nanoparticles Second Phase”. Use of the National Synchrotron Light Source, Brookhaven National Laboratory, was supported by the U.S. Department of Energy, Office of Science, Office of Basic Energy Sciences, under Contract no. DE-AC02-98CH10886.Notes and references
- H. K. Boparai, M. Joseph and D. M. O'Carroll, J. Hazard. Mater., 2011, 186, 458 CrossRef CAS PubMed.
- S. Clemens, Biochimie, 2006, 88, 1707 CrossRef CAS PubMed.
- J. Szkoda, M. Durkalec, R. Kolacz, S. Opalinski and J. Zmudzki, Med. Weter., 2012, 68, 689 Search PubMed.
- H. A. Castillo-Michel, N. Hernandez, A. Martinez-Martinez, J. G. Parsons, J. R. Peralta-Videa and J. L. Gardea-Torresdey, Plant Physiol. Biochem., 2009, 47, 608 CrossRef CAS PubMed.
- P. Babula, V. Adam, R. Opatrilova, J. Zehnalek, L. Havel and R. Kizek, Environ. Chem. Lett., 2008, 6, 189 CrossRef CAS PubMed.
- N. Vrinceanu, D. M. Motelica, M. Dumitru, E. Gament, A. Manea, V. Tanase and M. Preda, Sci. Pap. Univ. Pardubice, Ser. A, 2010, LIII, 73 Search PubMed.
- M. P. Benavides, S. M. Gallego and M. L. Tomaro, Braz. J. Plant Physiol., 2005, 17, 21 CAS.
- L. Wan and H. Zhang, Plant Signaling Behav., 2012, 7, 1 CrossRef PubMed.
- J. A. McElroy, M. M. Shafer, A. Trentham-Dietz, J. M. Hampton and P. A. Newcomb, J. Natl. Cancer Inst., 2006, 98, 869 CrossRef CAS PubMed.
- J. Huff, R. M. Lunn, M. P. Waalkes, L. Tomatis and P. F. Infante, Int. J. Occup. Environ. Health, 2007, 13, 202 CrossRef CAS PubMed.
- U.S. Environmental Protection Agency, National Center for Environmental Assessment, Office of Research and Development, Washington, DC, 1999, http://www.epa.gov/iris/subst/0141.htm Search PubMed.
- R. A. Crane and T. B. Scott, J. Hazard. Mater., 2012, 211, 112 CrossRef PubMed.
- H. K. Boparai, M. Joseph and D. M. O'Carroll, Environ. Sci. Pollut. Res., 2013, 20, 6210 CrossRef CAS PubMed.
- B. I. Kharisov, H. V. Rasika Dias, O. V. Kharissova, V. Manuel Jimenez-Perez, B. Olvera Perez and B. Munoz Flores, RSC Adv., 2012, 2, 9325 RSC.
- A. S. Adeleye, A. A. Keller, R. J. Miller and H. S. Lenihan, J. Nanopart. Res., 2013, 15, 18 CrossRef.
- H. J. Shipley, K. E. Engates and A. M. Guettner, J. Nanopart. Res., 2011, 13, 2387 CrossRef CAS.
- S. M. Ponder, J. G. Darab and T. E. Mallouk, Environ. Sci. Technol., 2000, 34, 2564 CrossRef CAS.
- Y. P. Sun, X. Q. Li, J. S. Cao, W. X. Zhang and H. P. Wang, Adv. Colloid Interface Sci., 2006, 120, 47 CrossRef CAS PubMed.
- E. J. Bishop, D. E. Fowler, J. M. Skluzacek, E. Seibel and T. E. Mallouk, Environ. Sci. Technol., 2010, 44, 9069 CrossRef CAS PubMed.
- B. Schrick, B. W. Hydutsky, J. L. Blough and T. E. Mallouk, Chem. Mater., 2004, 16, 2187 CrossRef CAS.
- K. N. Harish, H. S. Bhojya Naik, P. N. Prashanth Kumar, R. Vishwanath and G. S. Yashvanth Kumar, Arch. Appl. Sci. Res., 2013, 5, 42 CAS.
- C. B. Wang and W. X. Zhang, Environ. Sci. Technol., 1997, 31, 2154 CrossRef CAS.
- S. Y. Chen, W. H. Chen and C. J. Shih, Water Sci. Technol., 2008, 58, 1947 CrossRef CAS PubMed.
- B. Ravel and M. Newville, J. Synchrotron Radiat., 2005, 12, 537 CrossRef CAS PubMed.
- Y. L. Zhang, Y. T. Li, C. M. Dai, X. F. Zhou and W. X. Zhang, Chem. Eng. J., 2014, 244, 218 CrossRef CAS PubMed.
- C. Uzum, T. Shahwan, A. E. Eroglu, I. Lieberwirth, T. B. Scott and K. R. Hallam, Chem. Eng. J., 2008, 144, 213 CrossRef CAS PubMed.
- P. Ghods, O. B. Isgor, J. R. Brown, F. Bensebaa and D. Kingston, Appl. Surf. Sci., 2011, 257, 4669 CrossRef CAS PubMed.
- C. Uzum, T. Shahwan, A. E. Eroglu, K. R. Hallam, T. B. Scott and I. Lieberwirth, Appl. Clay Sci., 2009, 43, 172 CrossRef CAS PubMed.
- S. M. Ponder, J. G. Darab, J. Bucher, D. Caulder, I. Craig, L. Davis, N. Edelstein, W. Lukens, H. Nitsche, L. F. Rao, D. K. Shuh and T. E. Mallouk, Chem. Mater., 2001, 13, 479 CrossRef CAS.
- W. B. Kim, S. H. Choi and J. S. Lee, J. Phys. Chem. B, 2000, 104, 8670 CrossRef CAS.
- A. J. Berry, H. S. C. O'Neill, K. D. Jayasuriya, S. J. Campbell and G. J. Foran, Am. Mineral., 2003, 88, 967 CAS.
- G. H. Lee, S. H. Kim, B. J. Choi, S. H. Huh, Y. Chang, B. Kim, J. Park and S. J. Oh, J. Korean Phys. Soc., 2004, 45, 1019 CAS.
- X. B. Cao, W. H. Wang, X. H. Zhang, L. Y. Li, Y. H. Cheng, H. Liu, S. C. Du and R. K. Zheng, Nanoscale Res. Lett., 2013, 8, 423 CrossRef PubMed.
- H. B. Liu, T. H. Chen, D. Y. Chang, D. Chen, Y. Liu, H. P. He, P. Yuan and R. Frost, Mater. Chem. Phys., 2012, 133, 205 CrossRef CAS PubMed.
- M. F. R. Fouda, M. B. ElKholy, S. A. Mostafa, A. I. Hussien, M. A. Wahba and M. F. El-Shahat, Adv. Mater. Lett., 2013, 4, 347 Search PubMed.
- Z. H. Ban, Y. A. Barnakov, V. O. Golub and C. J. O'Connor, J. Mater. Chem., 2005, 15, 4660 RSC.
- L. Li, M. H. Fan, R. C. Brown, J. H. Van Leeuwen, J. J. Wang, W. H. Wang, Y. H. Song and P. Y. Zhang, Crit. Rev. Environ. Sci. Technol., 2006, 36, 405 CrossRef CAS.
- M. Chakrabarti, D. Sanyal and A. Chakrabarti, J. Phys.: Condens. Matter, 2007, 19, 236210 CrossRef.
- S. M. Ismail, S. Labib and S. S. Attallah, J. Ceram., 2013, 2013, 8 Search PubMed.
- M. Yehia, S. Labib and S. M. Ismail, Phys. B, 2014, 446, 49 CrossRef CAS PubMed.
- M. Yokoyama, T. Sato, E. Ohta and T. Sato, J. Appl. Phys., 1996, 80, 1015 CrossRef CAS PubMed.
- A. L. Patterson, Phys. Rev., 1939, 56, 978 CrossRef CAS.
- A. Liu and W.-x. Zhang, Analyst, 2014, 139, 4512–4518 RSC.
- J. Feng and T. T. Lim, Chemosphere, 2007, 66, 1765 CrossRef CAS PubMed.
- A. T. Ngo and M. P. Pileni, J. Phys. Chem. B, 2001, 105, 53 CrossRef CAS.
- W. Liang, C. Dai, X. Zhou and Y. Zhang, PLoS One, 2014, 9, 1 Search PubMed.
- W. L. Yan, A. A. Herzing, C. J. Kiely and W. X. Zhang, J. Contam. Hydrol., 2010, 118, 96 CrossRef CAS PubMed.
| This journal is © The Royal Society of Chemistry 2015 |