A heating-up method for the synthesis of pure phase kesterite Cu2ZnSnS4 nanocrystals using a simple coordinating sulphur precursor

Ping Anab, Zhurong Liangab, Xueqing Xu*ab, Xin Wanga, Hu Jinab, Nan Wanga, Junxia Wanga and Furong Zhuc
aCAS Key Laboratory of Renewable Energy, Guangzhou Institute of Energy Conversion, Chinese Academy of Sciences, Guangzhou 510640, P. R. China. E-mail: xuxq@ms.giec.ac.cn; Fax: +86-020-37278821; Tel: +86-020-87057782
bUniversity of Chinese Academy of Sciences, Beijing 100049, P. R. China
cDepartment of Physics, Institute of Advanced Materials and Research Centre of Excellence for Organic Electronics, Hong Kong Baptist University, Hong Kong

Received 27th October 2014 , Accepted 21st November 2014

First published on 3rd December 2014


Abstract

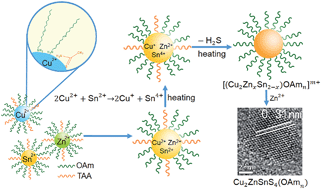
Pure phase kesterite Cu2ZnSnS4 (CZTS) nanocrystals (NCs) have been successfully synthesized via a heating-up method utilizing metal salts as cation sources and thioacetamide (TAA) as a coordinating sulphur precursor in combination with oleylamine (OAm) as a coordinating ligand and solvent. The slower release of H2S from the metal–TAA complexes, as compared with the commonly used sulphur powder, is crucial for control of the grain size and size distribution of the NCs. As dominating coordinating ligands, OAm led to Sn-rich nuclei and kesterite CZTS NCs. The formation of pure phase kesterite CZTS NCs depends significantly on the temperature and Zn2+/Sn4+ molar ratio of the reaction system. The formation mechanism of the pure phase kesterite CZTS NCs has been clarified taking into account the chemical potentials of the elements involved.


Introduction

The quaternary Cu2ZnSnS4 (CZTS) semiconductor has been considered one of the most promising candidates for application in low cost solar cells, due to its low toxicity, optimal direct band gap (ca. 1.5 eV) and high absorption coefficient (over 104 cm−1) in the visible wavelength region.1–3 Recently, CZTS-based thin film solar cells, fabricated using a hydrazine solution-based process, with a power conversion efficiency (PCE) of up to 12.6% were reported.4 On the other hand, a relatively high PCE of ∼9.8% has been achieved for solar cells based on environmentally friendly colloidal CZTS nanocrystals (NCs) with post-annealing treatment,5 which is suitable for scale-up for manufacturing processes. So far, a variety of synthetic routes for high quality CZTS NCs have been investigated,6–8 including hot injection,9–13 heating-up processes,14–22 solvothermal,23,24 hydrothermal syntheses,25,26 and precursor decomposition approaches.27 A brief description of the synthetic conditions and the characteristics of the resulting NCs reported in the literature is provided in ESI 1.

To synthesize solution-processed CZTS NCs with a low defect density, it is important to realize precise control of the crystal phase, composition, and size of the NCs. For this purpose, CZTS NCs with controllable diameters ranging from 2 nm to 7 nm have been prepared by precursor decomposition methods using copper, zinc, and tin diethyl dithiocarbamate complexes as precursors, and oleylamine (OAm) as a coordinating ligand. It was indicated that OAm played an important role in the control of the decomposition temperatures of the dithiocarbamate complexes, and eventually in the compositions and phases of the prepared NCs. However, precursor decomposition methods normally require precursors with precise design, including metal thiolate and metal dithiocarbamate complexes.

As listed in ESI 1, hot injection and heating-up methods have also been widely investigated, in which the nucleation and growth of NCs can be more feasibly controlled as compared to hydrothermal and solvothermal approaches. In combination with coordinating ligands, such as OAm, trioctylphosphine (TOPO), dodecanethiol (DDT) etc., sulphur powder or DDT were commonly used as sulphur precursors. Wurzite phase CZTS tended to be formed when DDT was used as the sulphur source and coordinating ligand.10,12,15 Using sulphur powder in octadecene (ODE) solution as a sulphur source, combined with DDT and OAm as coordinating ligands, Jiang's results showed that the orange ODE–S complex led to relatively Zn-rich nuclei and finally formed wurztite CZTS NCs, while the yellow ODE–S complex led to Sn-rich nuclei, resulting in the preferential formation of kesterite CZTS NCs.20 However, the relatively high formation rate of H2S from sulphur powder generally led to NCs with sizes above 10 nm and wide size distributions. In addition, thiourea has also been used as a sulphur precursor resulting in large-sized spindle-like kesterite CZTS. For the purpose of separating the nucleation and growth of the NCs, Jasieniak et al.17 reported a one-pot heating-up synthesis of kesterite CZTS utilizing the binary sulphur precursor zinc ethyl xanthate in conjunction with DDT, which allowed multi-gram yields with high concentrations of the reaction precursors. However, the precursors are quite expensive and need to be specially designed. Accordingly, alternative routes are desired for developing high quality CZTS NCs using facile operation techniques and feasible precursors at low cost.

In this paper, we report the utilization of thioacetamide (TAA) as a coordinating sulphur source in combination with OAm as a coordinating ligand for the facile synthesis of CZTS NCs via a simple heating-up method. Herein, the coordination of TAA with metal cations ensures the slow release of H2S during the reaction process, which plays a key role in the control of the size and size distribution of the prepared CZTS NCs. As dominating coordinating ligands, OAm leads to Sn-rich nuclei and kesterite CZTS NCs. Furthermore, the formation mechanisms of the pure phase kesterite CZTS NCs have been analyzed taking into account the chemical potentials of the elements involved.

Experimental section

Materials

Thioacetamide (TAA, 99.99%), oleylamine (OAm, 98%), and copper(II) acetylacetonate (Cu(acac)2, 99.99%) were purchased from Aladdin Reagent Company. Zinc(II) acetate dehydrate (Zn(OAc)2·2H2O, 99.0%), tin(II) chloride dehydrate (SnCl2·2H2O, 99.0%), sulfur (S, 99.0%), chloroform, methanol, and ethanol were from Guangzhou Chemical Reagent Factory. All the chemicals were of analytical grade and used directly without further purification.

Preparation of kesterite CZTS NCs

First, 0.2 mmol of Cu(acac)2, 0.125 mmol (or 0.1 mmol) of Zn(OAc)2·2H2O, and 0.1 mmol of SnCl2·2H2O were mixed with 10 mL of OAm in a 50 mL three-neck flask to give a blue slurry. Then, 0.4 mmol of TAA (or sulphur powder) was added into the mixture under stirring, and the solution became black. After that, the reaction mixture was degassed by nitrogen flow three times, and then was heated to 220 °C or 240 °C within 15 min, and held for 2 hours. In order to monitor the growth of the NCs, aliquots of the reaction solutions were taken using a syringe at different reaction times and injected into chloroform to end the reactions. After the colloidal NCs were precipitated by the addition of ethanol, the solutions were centrifuged at 4000 rpm for 5 min. Finally, the supernatant was decanted, and the precipitate was redispersed in chloroform for further analysis.

Characterization

The crystal structures of the samples were measured using X-ray diffraction (XRD, PAN analytical X'Pert Pro MPD, Japan). The sizes and morphologies of the samples were observed using transmission electron microscopy (TEM, Tecnai G2 F30, accelerating voltage 200 kV). The chemical composition of the samples was analyzed using energy dispersive X-ray (EDX, Oxford Instruments Inca EDX system) spectrometry. The UV-Vis absorption spectra of the samples were measured using a Lambda 750 spectrophotometer. The valence states of Cu, Zn, Sn and S in the CZTS NCs were identified using X-ray photoelectron spectroscopy (XPS, K-Alpha, Thermo). Raman spectra were measured using a LabRAM HR800 spectrometer using a laser excitation wavelength of 532 nm. Fourier transform infrared (FT-IR) spectra of the materials were recorded on a Bruker TENSOR27 FT-IR spectrometer.

Results and discussion

Composition, structure and optical properties of the obtained CZTS NCs

First, TAA was compared with commonly used sulphur powder as a sulphur precursor for the synthesis of CZTS NCs. In order to observe the growth kinetics of CZTS NCs, aliquots of the reaction mixtures were taken at different reaction times for analysis. Fig. 1a shows the XRD patterns of the samples obtained at a reaction time of 1 hour. The diffraction peaks of the samples made from TAA and those made from sulphur powder were identical and can be indexed to the kesterite CZTS phase (JCPDS 26-0575). However, the diffraction peaks for the samples synthesized from TAA were broader and weaker than those synthesized from sulphur powder, indicating that the grain size of the CZTS NCs synthesized from TAA was smaller than that of those synthesized from sulphur powder. The absorption spectra (ESI 2) of the samples also showed that the CZTS NCs from TAA were smaller than those synthesized from sulphur powder. This fact can be attributed to the slower release of H2S from TAA as compared with sulphur powder, which resulted from the coordination of TAA with metal cations as indicated in the FT-IR analysis (ESI 3). It is believed that the slow release of H2S from metal–TAA complexes gave a way to control the nucleation and growth of the CZTS NCs.
image file: c4ra13252a-f1.tif
Fig. 1 XRD patterns of CZTS NCs synthesized from (a) S and TAA, and from (b) TAA at different reaction times.

It was observed that H2S was released from the metal–TAA complexes at around 80 °C. Fig. 1b presents the XRD patterns of the CZTS NCs obtained at 240 °C for different reaction times. The average grain sizes calculated from the widths of the (112) and (220) peaks using the Debye–Scherrer formula are listed in Table 1. It can be seen that the CZTS NCs grew to ∼5.5 nm at the very beginning of the heating at 240 °C, and the size of the grains remained nearly constant between 1 min and 30 min. It is worth noting that the average size of the CZTS NCs obtained between 1 min and 30 min is smaller than the Bohr diameter of CZTS (around 6 nm).25 It became larger than 6 nm at reaction times longer than 30 min.

Table 1 Grain sizes, compositions, and band gaps of CZTS NCs obtained at different reaction times
Reaction time XRD TEM size (nm) EDX UV
(112) (nm) (220) (nm) Cu/Zn/Sn/S Cu/Zn/Sn Cu/Zn + Sn Eg (eV)
1 min 5.3 5.5 6.70 ± 1.43 1.66/0.74/0.94/4 2.24/1/1.27 1/1 1.75
5 min 5.0 5.8 6.95 ± 1.72 1.74/0.84/1.01/4 2.07/1/1.2 1/1.05 1.65
30 min 5.1 5.7 6.98 ± 1.57 2.06/1.09/1.04/4 1.88/1/0.95 1/1.03 1.55
60 min 4.4 6.3 2.23/0.83/1.16/4 2.68/1/1.39 1/0.89
120 min 5.8 6.4 11.72 ± 3.98 2.05/0.59/1.1/4 3.47/1/1.86 1/0.82 1.48


The morphology and size distributions of the CZTS NCs obtained at different reaction times were further observed using TEM measurements. As shown in Fig. 2, the CZTS NCs had irregular polygonal shapes, and their average grain sizes were ∼6.7 to 6.9 nm with a narrow size distribution at reaction times between 1 min and 30 min, which were larger than those derived from XRD measurements. The average size of the grains increased to ∼11.77 nm and the size distribution became broader at a reaction time of ∼120 min due to Ostwald ripening. HRTEM images further confirmed the high crystallinity of the NCs, with a lattice spacing of 0.31 nm which can be ascribed to the (112) plane of kesterite CZTS.25


image file: c4ra13252a-f2.tif
Fig. 2 TEM images and size distribution histograms of CZTS NCs synthesized using TAA as the sulphur precursor at 240 °C for different reaction times: 1 min (a and e), 5 min (b and f), 30 min (c and g), and 120 min (d and h). The insert in (c) shows an HRTEM image of representative CZTS NCs.

The formation of kesterite CZTS NCs cannot be confirmed only based on the XRD patterns, which could come from the diffraction of several related sulfides such as ZnS and Cu2SnS3.9 Accordingly, Raman spectra measurements were performed to obtain a more precise assignment of the structure. The formation of kesterite CZTS was confirmed by the single Raman peak detected at 333 cm−1 (Fig. 3a), which is expected for bulk CZTS. In particular, no Raman peaks of impurity phases, such as Cu2S, ZnS, SnS2, and Cu2SnS3, were detected, which confirmed that the as-prepared CZTS NCs had a pure kesterite phase. However, we note that by lowering the reaction temperature to 220 °C, in addition to the Raman peak at ∼333 cm−1 for CZTS, peaks at 300 cm−1 and 478 cm−1, attributed to Cu2SnS3 and Cu2S, respectively also appeared (Fig. 3b).


image file: c4ra13252a-f3.tif
Fig. 3 Raman spectra of the samples (a) synthesized at 240 °C for different reaction times, (b) obtained at different temperatures, and (c) prepared with different molar ratios of Zn2+/Sn4+.

The chemical compositions of the samples obtained at different reaction times were estimated from EDX measurements averaged from a set of samples and summarized in Table 1. It can be seen that the samples obtained at 1 min and 5 min were Cu and Sn-rich. However, the compositions of the samples were close to the expected stoichiometry of CZTS at 30 min, probably due to ionic exchange between Sn4+ and Zn2+ ions. However, at longer reaction times, the Cu/(Zn + Sn) ratio increased, while the content of Zn decreased, which can be attributed to the formation of point defects of CuZn.28 Since the CZTS NCs used for the most efficient reported photovoltaic devices are Cu and Sn deficient, the composition of the CZTS NCs needs to be further optimized.

The valence states of Cu, Zn, Sn and S in the CZTS NCs obtained after 30 min of growth were further identified by XPS (Fig. 4). The Cu 2p peaks appeared at binding energies of 931.7 eV (2p3/2) and 951.6 eV (2p1/2) with an energy difference of 19.9 eV, which can be assigned to Cu(I). The 2p3/2 peak of Cu(II) (942 eV) was not detected. The presence of Zn(II) was confirmed by the peak splitting of 23.1 eV between the two peaks located at 1044.6 eV (2p1/2) and 1021.5 eV (2p3/2). The peaks located at 486.2 eV (3d5/2) and 494.6 eV (3d3/2) with a difference of 8.4 eV were consistent with Sn(IV) 3d. The doublet peaks of S 2p were located at 161.4 eV (2p3/2) and 162.6 eV (2p1/2) with a peak splitting of 1.2 eV. These results further confirmed that pure phase CZTS NCs were obtained.29


image file: c4ra13252a-f4.tif
Fig. 4 XPS spectra of CZTS NCs obtained at 240 °C for 30 min.

The UV-Vis absorption spectra of the CZTS NCs obtained at different reaction times are presented in Fig. 5. With increasing reaction time, the absorption edges gradually shifted toward longer wavelengths. No pronounced excitonic peaks were observed, so the optical band gap Eg of CZTS NCs was estimated from the commonly used formula Ahν = (Eg)1/2 by plotting (Ahν)2 as a function of (inset in Fig. 5), where A = absorbance, h = Planck constant, and ν = optical frequency. The values of the optical band gaps of the CZTS NCs were estimated and are presented in Table 1. They ranged from 1.75 eV to 1.50 eV, reaching the value of bulk CZTS (1.5 eV) at a reaction time of 2 hours. At reaction times between 1 min and 30 min, quantum confinement effects can be observed owing to the size of the NCs being smaller than their Bohr diameter, as detected in the XRD measurements. The absorption of the CZTS NCs extended towards the near infrared region because of the NCs with large size, and the absorptions above 800 nm can be attributed to the deep defect states existing in the samples.


image file: c4ra13252a-f5.tif
Fig. 5 Absorption spectra of the CZTS NCs obtained at different reaction times. The inset in the right corner shows the plots of (Ahν)2 as a function of hv.

Formation mechanism of pure phase kesterite CZTS

From the above analysis, the formation mechanism of the CZTS NCs was proposed and is shown in Fig. 6. First, when Cu(acac)2, Zn(OAc)2·2H2O, and SnCl2·2H2O were mixed with OAm, Cu2+, Zn2+, and Sn2+ cations were released from the metal precursors and coordinated with OAm to form metal ion micelles. After TAA was added, it was further coordinated with metal cations to form metal–OAm(TAA) complexes as proven with the FT-IR measurements (ESI 3), and the mixture solutions became black, probably due to the formation of Cu–OAm(TAA) complexes. With stirring, the different kinds of metal ion micelles collided with each other, and micelles with a mixture of metal ions formed. At a suitable temperature, the redox reaction between Cu2+ and Sn2+ occurred to form Cu+ and Sn4+. It was observed that at a temperature around 80 °C, H2S was released gradually from the metal–OAm(TAA) complexes, and reacted with the metal cations to form Cu2ZnxSn2−xS4–OAm complexes.
image file: c4ra13252a-f6.tif
Fig. 6 Schematic map for the formation mechanism of CZTS NCs via a simple heating-up method with TAA as the coordinating sulphur source combined with OAm as coordinating ligand.

It is worth noting that, according to the hard–soft acid–base theory, Cu+, Zn2+, Sn4+ are soft, intermediate, and hard acids, respectively, so the coordinating powers between the metal ions and the hard base OAm are in the order: Sn4+ > Zn2+ > Cu+. The resulting Cu2ZnxSn2−xS4–OAm complexes were therefore Sn-rich, which led to nuclei of Sn and Cu-rich kesterite CZTS,20 or even nuclei of Cu2SnS3 at lower temperature as detected in the Raman analysis. Therefore, the CZTS NCs obtained at 240 °C at reaction times of 1 min and 5 min were Cu and Sn-rich as shown in Table 1. As the reaction time progressed, Zn2+ diffused into the NCs, resulting in compounds with the expected stoichiometry at a reaction time of 30 min. The slow release of H2S from the metal–OAm(TAA) complexes gave rise to the separation of the nucleation and growth of CZTS NCs, leading to a small size distribution of NCs.

In fact, as indicated by Chen et al.,28 the stable region of pure phase kesterite CZTS in the chemical potential diagram (ESI 4) is very narrow, so a great deal of attention should be given to precisely controlling the reaction conditions. As shown in the Raman spectra in Fig. 3b, pure phase kesterite CZTS NCs can be obtained at 240 °C, while the undesirable Cu2SnS3 and Cu2S phases appeared if the reaction temperature was set at 220 °C. From the point of view of chemical thermodynamics, to obtain pure phase CZTS, the chemical potential of Cu+, Zn2+, Sn4+, and S must satisfy the following equation: 2μCu + μZn + μSn + 4μS = ΔHf(CZTS), where ΔHf(CZTS) = −4.21 eV is the calculated formation enthalpy of CZTS. To avoid the secondary phases Cu2SnS3 and Cu2S, the following relations should be satisfied, i.e. 2μCu + μSn + 3μS < ΔHf(Cu2SnS3) and 2μCu + μS < ΔHf(Cu2S), where ΔHf(Cu2SnS3) = −2.36 eV and ΔHf(Cu2S) = −0.52 eV are the calculated formation enthalpies of Cu2SnS3 and Cu2S respectively. With decreasing reaction temperature, the chemical potentials of the elements, i.e. μCu, μZn, μSn, and μS, increased.30 As a result, (2μCu + μSn + 3μS) and (2μCu + μS) became larger than ΔHf(Cu2SnS3) and ΔHf(Cu2S) respectively, leading to the formation of Cu2SnS3 and Cu2S at 220 °C.

In addition, the molar ratio of the metal ion precursors may have an important effect on the chemical potential of each element, and eventually on the phase composition of the obtained NCs. As presented in Fig. 3c, an additional Raman peak from the Cu2SnS3 phase appeared at 300 cm−1 when the molar ratio of Zn2+/Sn4+ became 1/1 instead of 1.25/1. It can be imagined that, when the molar ratio of Zn2+/Sn4+ is 1.25/1, the chemical potential of each element can fall within the region for the formation of pure CZTS phase (ESI 4). However, for a molar ratio of Zn2+/Sn4+ of 1/1, with the decrease in μZn and the increase in μSn, (2μCu + μSn + 3μS) became larger than ΔHf(Cu2SnS3), leading to the formation of Cu2SnS3. This fact highlights that the molar ratio of metal ion precursors should be carefully controlled to obtain pure phase kesterite CZTS NCs.

Conclusions

In conclusion, pure phase kesterite CZTS NCs have been synthesized via a simple heating-up method with TAA as a coordinating sulphur precursor combined with OAm as a coordinating ligand. The slow release of H2S from metal–TAA complexes allowed for the control of the nucleation and growth of the CZTS NCs. Moreover, as a hard base, OAm led to Sn-rich nuclei and kesterite CZTS NCs. The formation mechanism of pure phase CZTS in terms of chemical potential has been clarified, and indicates that the molar ratio of Zn2+/Sn4+ and temperature of the reaction system should be carefully controlled to obtain pure phase kesterite CZTS NCs. In the future, the compositions of the CZTS NCs need to be further optimized.

Acknowledgements

This work was supported by the National Natural Science Foundation of China (projects 21073193, 21273241), Project on the Integration of Industry, Education and Research of Guangdong Province (2012B091100476), Science and Technology Research Project of Guangzhou City (2014J4100218) and HKBU Strategic Development Fund (SDF13-0531-A02).

Notes and references

  1. M. P. Suryawanshi, G. L. Agawane, S. M. Bhosale, S. W. Shin, P. S. Patil, J. H. Kim and A. V. Moholkar, Mater. Sci. Technol., 2013, 28, 98–109 CrossRef CAS PubMed.
  2. H. P. Zhou, W. C. Hsu, H. S. Duan, B. Bob, W. B. Yang, T. B. Song, C. J. Hsu and Y. Yang, Energy Environ. Sci., 2013, 6, 2822–2838 CAS.
  3. D. Aldakov, A. Lefrancois and P. Reiss, J. Mater. Chem. C, 2013, 1, 3756–3776 RSC.
  4. W. Wang, M. T. Winkler, O. Gunawan, T. Gokmen, T. K. Todorov, Y. Zhu and D. B. Mitzi, Adv. Energy Mater., 2014, 4, 1301465 Search PubMed.
  5. C. Leidholm, A. Hotz, C. Breeze, C. Sunderland and W. Ki, NREL Subcontract Report NREL/SR-5200-56510, 2012.
  6. X. S. Yin, C. H. Tang, M. H. Chen, S. Adams, H. Wang and H. Gong, J. Mater. Chem. A, 2013, 1, 7927–7932 CAS.
  7. X. Xin, M. He, W. Han, J. Jung and Z. Lin, Angew. Chem., Int. Ed., 2011, 50, 11739–11742 CrossRef CAS PubMed.
  8. M. Miyauchi, T. Hanayama, D. Atarashi and E. Sakai, J. Phys. Chem. C, 2012, 116, 23945–23950 CAS.
  9. S. C. Riha, B. A. Parkinson and A. L. Prieto, J. Am. Chem. Soc., 2009, 131, 12054–12055 CrossRef CAS PubMed.
  10. X. T. Lu, Z. B. Zhuang, Q. Peng and Y. D. Li, Chem. Commun., 2011, 47, 3141–3143 RSC.
  11. S. K. Saha, A. Guchhait and A. J. Pal, Phys. Chem. Chem. Phys., 2012, 14, 8090–8096 RSC.
  12. A. Singh, H. Geaney, F. Laffir and K. M. Ryan, J. Am. Chem. Soc., 2012, 134, 2910–2913 CrossRef CAS PubMed.
  13. Q. J. Guo, H. W. Hillhouse and R. Agrawal, J. Am. Chem. Soc., 2009, 131, 11672–11673 CrossRef CAS PubMed.
  14. C. Steinhagen, M. G. Panthani, V. Akhavan, B. Goodfellow, B. Koo and B. A. Korgel, J. Am. Chem. Soc., 2009, 131, 12554–12555 CrossRef CAS PubMed.
  15. M. Li, W. H. Zhou, J. Guo, Y. L. Zhou, Z. L. Hou, J. Jiao, Z. J. Zhou, Z. L. Du and S. X. Wu, J. Phys. Chem. C, 2012, 116, 26507–26516 CAS.
  16. T. Rath, W. Haas, A. Pein, R. Saf, E. Maier, B. Kunert, F. Hofer, R. Resel and G. Trimmel, Sol. Energy Mater. Sol. Cells, 2012, 101, 87–94 CrossRef CAS PubMed.
  17. A. S. R. Chesman, N. W. Duffy, S. Peacock, L. Waddington, N. A. S. Webster and J. J. Jasieniak, RSC Adv., 2013, 3, 1017–1020 RSC.
  18. A. S. R. Chesman, J. van Embden, N. W. Duffy, N. A. S. Webster and J. J. Jasieniak, Cryst. Growth Des., 2013, 13, 1712–1720 CAS.
  19. T. Kameyama, T. Osaki, K. Okazaki, T. Shibayama, A. Kudo, S. Kuwabata and T. Torimoto, J. Mater. Chem., 2010, 20, 5319–5324 RSC.
  20. Y. Zou, X. Su and J. Jiang, J. Am. Chem. Soc., 2013, 135, 18377–18384 CrossRef CAS PubMed.
  21. A. Walsh, S. Y. Chen, S. H. Wei and X. G. Gong, Adv. Energy Mater., 2012, 2, 400–409 CrossRef CAS.
  22. H. Yang, L. A. Jauregui, G. Zhang, Y. P. Chen and Y. Wu, Nano Lett., 2012, 12, 540–545 CrossRef CAS PubMed.
  23. Y. L. Zhou, W. H. Zhou, Y. F. Du, M. Li and S. X. Wu, Mater. Lett., 2011, 65, 1535–1537 CrossRef CAS PubMed.
  24. W. Xie, X. Jiang, C. W. Zou, D. Li, J. Zhang, J. Quan and L. X. Shao, Phys. E, 2012, 45, 16–20 CrossRef CAS PubMed.
  25. W. C. Liu, B. L. Guo, X. S. Wu, F. M. Zhang, C. L. Mak and K. H. Wong, J. Mater. Chem. A, 2013, 1, 3182–3186 CAS.
  26. W. C. Liu, B. L. Guo, C. Mak, A. D. Li, X. S. Wu and F. M. Zhang, Thin Solid Films, 2013, 535, 39–43 CrossRef CAS PubMed.
  27. A. Khare, A. W. Wills, L. M. Ammerman, D. J. Norris and E. S. Aydil, Chem. Commun., 2011, 47, 11721–11723 RSC.
  28. S. Y. Chen, J. H. Yang, X. G. Gong, A. Walsh and S. H. Wei, Phys. Rev. B: Condens. Matter Mater. Phys., 2010, 81, 245204 CrossRef.
  29. N. S. Arul, D. Y. Yun, D. U. Lee and T. W. Kim, Nanoscale, 2013, 5, 11940–11943 RSC.
  30. Physical Chemistry: A Key Course, ed. W. Shen, Science Press, Beijing, 2nd edn, 2004, ch. 4, p. 105 Search PubMed.

Footnote

Electronic supplementary information (ESI) available: Overview of formulation and size distribution of colloidal CZTS NCs reported by different groups; UV-Vis absorption spectra of the CZTS synthesized using sulfur powder and TAA as sulphur sources with the reaction time of 1 hour; FT-IR spectra analysis of the mixture of metal ion precursors with OAm or with OAm plus TAA; schematic diagram of the stable chemical-potential region of CZTS. See DOI: 10.1039/c4ra13252a

This journal is © The Royal Society of Chemistry 2015
Click here to see how this site uses Cookies. View our privacy policy here.