Preparation of montmorillonite-pillared graphene oxide with increased single- and co-adsorption towards lead ions and methylene blue

Lu Liua, Yaru Zhanga, Yanjin Hea, Yongfen Xiea, Langhuan Huanga, Shaozao Tan*a and Xiang Cai*b
aDepartment of Chemistry, Jinan University, Guangzhou 510632, P. R. China. E-mail: tanshaozao@163.com
bDepartment of Light Chemical Engineering, Guangdong Polytechnic, Foshan 528041, P. R. China. E-mail: cecaixiang@163.com

Received 23rd October 2014 , Accepted 21st November 2014

First published on 21st November 2014


Abstract

To prevent the aggregation of graphene oxide (GO) during storage or application, montmorillonite (MMT) was used as the modifier, and MMT-pillared GO (GM) was prepared. The features of GM were characterized using Fourier transform infrared spectroscopy, scanning electron microscopy, transmission electron microscopy, energy dispersion X-ray spectrometry, atomic force microscopy and X-ray diffraction measurements. Then, a batch system was applied to study the adsorption behaviors of lead ions (Pb2+) and methylene blue (MB) by GM in single and binary systems. The results showed that GM possessed a higher Brunauer–Emmett–Teller (BET) specific surface area than GO. In a single system, the maximum adsorption capacities of GM for MB and Pb2+ were 350 and 285 mg g−1, respectively. With increasing the storage days, the BET specific surface area and the maximum adsorption capacity of GM remained approximately unchanged, while that of GO dramatically decreased. For a binary system, the presence of MB in water provides additional binding sites for Pb2+, promoting the adsorption of Pb2+ on GM. The presence of Pb2+ in water would compete with MB on GM during the adsorption process, resulting in a decrease in the adsorption of MB. The adsorption results recorded under different conditions indicated that this experiment was capable of the simultaneous removal of Pb2+ and MB using GM as the adsorbent. In addition, the pillared structure of GM greatly enhanced the noncovalent adhesion.

1. Introduction

Potentially toxic metals represent an important group of pollutants that are commonly found in surface waters that are contaminated with natural or industrial sources.1–3 Among the various metals, lead is one of the most dangerous pollutants. Even at low concentrations, lead is extremely toxic, causing behavioral changes, learning disabilities, developmental defects, language difficulties, mental retardation and abnormality in pregnant women.4,5 Dyes have become one of the main sources of severe water pollution as a result of the rapid development of the textile industry and their low production cost, brighter colour, better resistance towards environmental factors and easy-to-apply factor.1,2 Among the various dyes, methylene blue (MB) has the widest application, which includes coloring paper, temporary hair colourant, dyeing cotton, wool and a coating for paper stock. The presence of dyes in water, even at very low concentrations, is highly visible and undesirable.6–8

In the past years, several technologies have been employed for the removal of potentially toxic metals and dyes from aqueous solution such as adsorption, ion exchange, chemical precipitation and membrane separation.9–11 Among the various techniques, adsorption is usually the simplest and the most cost-effective technique. In addition, adsorption does not result in secondary pollution by producing harmful substances during the process.12 Numerous works have presented results for the adsorption of dyes or potentially toxic metals onto various materials such as activated carbon, natural and synthetic polymers, clay mineral or its modified composite, zeolite, agricultural and industrial by-products.13–18

Clay minerals (e.g., montmorillonite (MMT)) are good adsorbents for metal ions from aqueous solution owing to their high cation-exchange capacity, high abundance, local availability, nontoxicity, chemical and mechanical stability, low cost and the ability to be recycled.19,20 In the past few years, graphene oxide (GO) and graphene nanosheets have attracted tremendous interest all over the world. Some reviews on graphene-based material as an adsorbent for the removal of pollutant are available.21 The main shortcoming of GO is agglomeration during storage or application, which results in the decline of adsorption capacity in practical applications. To solve this problem, the physical22 or chemical23,24 modification of GO has been used, but the results are still not ideal. Therefore, it is necessary to probe new methods, which can solve the abovementioned problem. Moreover, most of these studies only deal with single-component aqueous solutions; thus, the development of a bi-functionalized adsorbent that is capable of enabling the simultaneous removal of two types of environmental pollutants has become an emerging frontier in the field of water treatment, and limited works have been published about dealing with the adsorption of dyes25–29 or toxic metals30,31 in multi-component aqueous systems. For more specific and complicated studies, few literature have investigated about the utilization of GO and MMT composites for the removal of potentially toxic metals and dyes.

In this study, MMT was used as the modifier, and MMT-pillared GO (GM) was prepared. Then, we used GM as an adsorbent to simultaneously remove a potentially toxic metal ion and a dye. MB and lead ions (Pb2+) were chosen as the typical dye and potentially toxic metal ion, and their adsorption in single and binary systems were compared to investigate the simultaneous adsorption process. As a new type of material, the GM combined the properties of MMT and GO, exhibited higher adsorption efficiency than GO and MMT after long-term storage, and possessed a high adsorption efficiency for Pb2+ and MB than GO and MMT.

2. Experiment section

2.1. Materials

MMT with a cation-exchange capacity (CEC) of 100 meq/100 g on dry basis (dried at 110 °C) was obtained from Hongyu Clay Co., Ltd. (Zhejiang, China). Graphite powder (spectral pure), KMnO4, P2O5, concentrated H2SO4, H2O2, MB and lead nitrate (Pb2+) were purchased from Sinopharm Chemical Reagent Co., Ltd. (Shanghai, China). All MB and Pb2+ aqueous solutions used in this study were prepared by dissolving certain amounts of MB and Pb2+ in deionized water. All the reagents were used without further purification. The deionized water used for the preparation of reagents was purified by Millipore reverse osmosis (RO).

2.2. Preparation of GM

GO was synthesized from natural graphite powder by a modified Hummers method.32–35 In brief, 115 mL of concentrated H2SO4 was added into a 500 mL flask containing 5 g of graphite powder and 5 g of P2O5, and the mixture was stirred in an ice bath. Then, 25 g of KMnO4 was slowly added into the abovementioned mixture. The rate of addition was carefully controlled to keep the reaction temperature below 3 °C. Subsequently, the temperature was raised to 35 °C and the solution was kept stirring for 2 h at 35 °C. The temperature was then gradually increased to 80 °C. When the mixture turned into a reddish brown suspension, 200 mL of H2O and 5 mL of 30% H2O2 were added to the mixture. Then, the mixture was washed and centrifuged with deionized water several times. After filtering and drying under vacuum, GO was obtained as a solid. Finally, 0.05 g GO was mixed with 1 g MMT in a flask and dispersed in 80 mL of H2O. After sonication for 8 h, the mixture was vacuum dried at 60 °C, and the resulting product was named GM.

2.3. Characterization

Fourier transform infrared (FTIR) spectra were measured with a Bruker Vertex 70 FT-IR spectrophotometer using the KBr method. The morphologies of the samples were observed by scanning electron microscopy (SEM) using a PHILIPS XL-30 scanning electron microscope and by transmission electron microscopy (TEM) using a TECNAI-10 transmission electron microscope. Energy dispersive X-ray (EDX) spectra were measured with an Oxford ISIS-300 energy dispersive X-ray spectrometer. X-ray diffraction (XRD) patterns were obtained on a PANalytical's X'Pert Power X-ray Diffraction (40 kV, 30 mA) with Cu Kα radiation at a scanning rate of 2.4°/min. The continuous scan mode was applied to collect 2θ data from 2° to 40°. Atomic force microscopy (AFM) images were observed by an atomic force microscope (Benyuan CSPM5500) on a flat mica substrate. Brunauer–Emmett–Teller (BET) specific surface area was determined using a Micromeritics ASAP 2010 instrument. Zeta potential measurements were performed using a zeta sizer nano ZS (Malvern Instruments), and all the aqueous samples were diluted to 0.05 mg mL−1 before measurements.

2.4. Adsorption experiment

The adsorption tests of the dye and potentially toxic metal onto the GM were conducted in batch experiments at 30 °C. In a single system, a series of 100 mL solutions in 250 mL flasks were used and each flask was filled with GM at various mass loadings and dye or Pb2+ solution at different initial concentrations. The conical flasks were agitated in an orbital shaker at 150 rpm and reacted at a given time interval. The suspension was centrifuged at 4500 g for 10 min to separate the liquid from the solid phase, and then the supernatant liquid was analyzed for MB and Pb2+. MB was spectrophotometrically determined by measuring the absorbance at λmax = 664 nm (Spectronic 20 Genesys Spectrophotometer), while Pb2+ was measured using atomic absorption spectrometry at λmax = 217 nm (SpectrAA110, Varian).

In the co-adsorption experiment, GM with various mass loadings was added into a test solution (100 mL) containing Pb2+ and MB. The procedures for adsorption and analysis were kept the same as described above.

At equilibrium, the adsorbed amount of dye or potentially toxic metal per unit mass of adsorbent (qe, mg g−1) was determined according to the following mass balance:

 
image file: c4ra13008a-t1.tif(1)
where V is the liquid volume (L), C0 is the initial concentration in the solution (mg L−1), Ce is the equilibrium concentration (mg L−1), and M is the amount of the adsorbent sample on a dry basis (g).

3. Results and discussion

3.1. Characterization of GM

FTIR spectroscopy was carried out to confirm the composition of the GM. According to the FTIR spectrum of MMT (Fig. 1a), the characteristic vibration bands of the MMT appeared at 3626 cm−1 (–OH stretch of the lattice hydroxyl), 3452 cm−1 (–OH stretch from free H2O), 1636 cm−1 (–OH bending) and 1035 cm−1 (Si–O stretch). In the FTIR spectrum of GO (Fig. 1c), a broad and intensive peak that appeared at 3399 cm−1 was assigned to –OH stretching band, which might originate from water molecules adsorbed inside GO. In addition, the peaks at 1730, 1622, 1384 and 1052 cm−1 corresponded to C[double bond, length as m-dash]O, C–OH, C[double bond, length as m-dash]C and C–O–C vibration frequency, respectively. These peaks suggested that graphite had been already oxidized to GO.32–36 In the FTIR spectrum of GM (Fig. 1b), all the peaks of GO and MMT appeared, and the bands of the peaks belonging to GO became weak. These results illustrated that GO formed a composite with MMT.
image file: c4ra13008a-f1.tif
Fig. 1 The FTIR spectra of the MMT (a), GM (b) and GO (c).

The representative SEM image of MMT is shown in Fig. 2a. Fig. 2b shows the EDX spectrum of MMT, revealing that MMT contained elements Ca, O, Na, Mg, Al and Si, which meant it is a calcium montmorillonite.37 The representative SEM image of GM is shown in Fig. 2c with a high magnification. The GM contained a mass of wrinkles on the surface and in the interlayer sheets, which was suggested to be GO. The layered structure of the GM exhibited a much rougher surface, which provides more active sites for the adsorption of the dye or potentially toxic metal ion and helps to enhance the adsorption activity of GM. Fig. 2d shows the EDX spectrum of GM, revealing that GM contained elements C, O, Mg, Al and Si. The presence of Si, Mg and Al atoms corroborated the existence of MMT, and the element C could be related to GO.


image file: c4ra13008a-f2.tif
Fig. 2 SEM micrographs of MMT (a) and GM (c). EDX spectra of MMT (b) and GM (d).

The XRD patterns of the MMT, GO and GM are presented in Fig. 3. For GO, a diffraction peak at 2θ = 11.00° could be found, corresponding to an interplanar spacing of 0.80 nm (Fig. 3b). For MMT, a typical well-defined d001 diffraction peak at 6.12° was consistent with a basal spacing of 1.44 nm (Fig. 3a), which manifested that this was a calcium montmorillonite.37 For GM, the characteristic peak of MMT still existed but was weakened, whereas the characteristic peak of GO disappeared (Fig. 3c), and the d001 diffraction peak appeared at 6.07° with a 1.47 nm basal spacing, which suggested that a block of MMT was pillared in every layer of the GO, resulting in the MMT-pillared GO.


image file: c4ra13008a-f3.tif
Fig. 3 XRD patterns of the MMT (a), GO (b) and GM (c), which were all sonicated for 8 h.

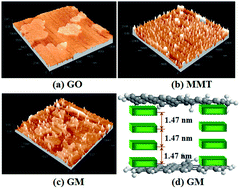
To further illustrate the abovementioned XRD results, AFM and TEM were used. Shown in Fig. 4 are the representative results of the AFM images for the samples prepared from GO, MMT and GM dispersion in water. The size of GO was about 3–4 μm (length) × 2–3 μm (width) × 1.0–1.2 nm (height); and the size of MMT was about 0.2–0.3 μm (length) × 0.2–0.3 μm (width) × 15–25 nm (height). The image of GO was flake-like and MMT was sharp (Fig. 4a and b), whereas the image of GM revealed the presence of GO sheets and sharp peaks of MMT. Moreover, MMT was deeply embedded in each of the GO (Fig. 4c). We suggested that MMT was pillared in every layer of the GO and formed a stable structure (Fig. 4d). This conclusion was consistent with the SEM and XRD results.


image file: c4ra13008a-f4.tif
Fig. 4 Tapping-mode AFM image of (a) GO, (b) MMT and (c) GM on a clean mica surface. (d) The schematic of GM.

The TEM analysis clearly illustrated the flake-like shapes of GO (Fig. 5a); the size of GO was about 3–4 μm (length) × 2–3 μm (width). The partially folded structure of the GO might be due to the diversity of oxygen functionalities in the thin GO layers. The TEM image of MMT (Fig. 5b) showed that the blocky structure of MMT aggregated together, and the size of MMT was about 0.2–0.3 μm (length) × 0.2–0.3 μm (width). As shown in Fig. 5c, the MMT nanoparticles were coated on the GO layers with a high density, and the wrinkled GO disappeared. Because of sonication, their appearance was partially transparent and a little folded with isolated small fragments of GO on their surfaces, we also suggested that MMT was pillared in every layer of the GO. This conclusion was consistent with the SEM, EDX and XRD results. According to previous study,38 exfoliated MMT nanoplatelets can partially reduce GO and both the hydrogen-bonding interactions and Na+-mediated interactions between MMT and GO, obtained the MMT-GO hybrid films by vacuum filtration. In this work, ultra-sonication for 8 h, possibly exfoliated the layered MMT, and the layered MMT was pillared in every layer of the GO to obtain GM by drying.


image file: c4ra13008a-f5.tif
Fig. 5 TEM images of the GO (a), MMT (b) and GM (c).

As shown in Fig. 6, the BET specific surface area of GM, GO and MMT were 973, 612 and 245 m2 g−1, respectively. The discrepancy of the as-obtained data and theoretical value of the surface area of GO (≥2000 m2 g−1) was attributed to the incomplete exfoliation and aggregation during the reduction process because of the unavoidable van der Waals force between each single layer of GO. The higher BET specific surface area of GM than GO was due to the pillar of GO by MMT. With the increase of the storage days, for example, after 60 days, the BET specific surface area of GO decreased to 26 m2 g−1, whereas the BET specific surface area of GM only decreased to 913 m2 g−1. π–π bonding interaction was used to interpret the phenomenon. Because the GO contained π electrons to interact with the π electrons of the nearby GO through π–π electron coupling,39 GO would reunite within the increased storage days; however, the reuniting of GM was interrupted by MMT. These results showed that MMT could increase the storage stability.


image file: c4ra13008a-f6.tif
Fig. 6 The BET specific surface areas of GM, GO and MMT with different storage days in water.

3.2. Adsorption of a dye and potentially toxic metal ion by GM, MMT or GO in a single solution

We performed batch adsorption experiments of MB (C0 = 0 to 400 mg L−1) and Pb2+ (C0 = 0 to 2000 mg L−1) using GM, MMT and GO at 30 °C, pH = 5. As shown in Fig. 7, initially, the adsorptions of MB and Pb2+ both increased with increasing concentration of MB and Pb2+, while the continuous increase in the concentration of MB and Pb2+ decreased the adsorption abilities instead. This might be explained by the fact that when the concentration of MB and Pb2+ reached a certain degree, the adsorption had reached saturation. However, continuous increase in the concentration of MB and Pb2+ led to the decrease of the adsorption ability due to insufficient adsorption sites. According to eqn (1), for the removal of MB, the maximum adsorptions of GM, MMT and GO were 350, 315 and 265 mg g−1, respectively (Fig. 7a), which indicated that the GM was able to adsorb more dye than MMT alone or GO alone; for the removal of Pb2+, the maximum adsorptions of GM, MMT and GO were 285, 136 and 60 mg g−1, respectively (Fig. 7b), which indicated that the GM had the ability to adsorb more potentially toxic metal ion than MMT alone or GO alone.
image file: c4ra13008a-f7.tif
Fig. 7 Comparison of the adsorptive capacities of MB (a) and Pb2+ (b) by different materials (n = 3).

The strong adsorptive ability of MMT for removing potentially toxic metal ions from aqueous solution had been reported in other studies.40,41 GO could also serve as an effective adsorbent towards dyes.39 In our study, we found that the adsorption property of GM was better than those of MMT and GO. Because the surface of GM in water is negatively charged (zeta potential = −30.4 mV), dissolved Pb2+ and MB that are positively charged would undergo attraction on approaching the anionic GM. On this basis, it was expected that Pb2+ and MB would have a strong sorption affinity for GM. In other words, the GM combined the properties of MMT and GO.

Moreover, GM, MMT and GO expressed different adsorption speeds for MB and Pb2+. The sorption of MB molecule is a noncovalent functionalization involving π-stacking interactions corresponding to a weak binding energy, and the sorption of Pb2+ is an ionic bond interaction. The π–π bonding interaction and ionic bond interaction between the adsorbent (GM, MMT or GO) and absorbable substances (MB or Pb2+) was affected by the BET specific surface area. Because GM had a larger BET specific surface area than MMT or GO, GM expressed a faster adsorption speed than MMT or GO.

3.3. Adsorption study of a dye–metal binary mixture

The adsorption of potentially toxic metal or dye by MMT and GO has been extensively studied and several review works have been reported in the literature.43 However, most of these investigations only focused on the affinity of MMT and GO for a single metal ion or dye. In this work, the simultaneous adsorption using a dye–metal binary mixture was considered because the wastewater of some industries (e.g., automobile production and paper manufacturing) usually contains two types of pollutants. First, we investigated the influence of MB (an initial concentration of 150 mg L−1) on the adsorption of Pb2+ onto GM with different concentrations of Pb2+ (0 to 2000 mg L−1) at 30 °C, pH = 5. For GM, the adsorption capacity of Pb2+ in the presence of MB was slightly greater than that in the absence of MB (Fig. 8a). It could be seen that about 31 mg g−1 of adsorbed Pb2+ was higher in the presence of MB than that in the absence of MB according to eqn (1). The results suggested that MB would get favorably adsorbed on the GM surface and produce many organic functional groups on the GM surface, which would cause the enhancement in the adsorption of Pb2+. Then, the effect of Pb2+ (an initial concentration of 150 mg L−1) on the adsorption of MB by GM with different concentrations of MB (0 to 1500 mg L−1) at 30 °C, pH = 5 was studied, and the results are depicted in Fig. 8b. It could be seen that about 67 mg g−1 of adsorbed MB was less in the presence of Pb2+ than that in the absence of Pb2+ according to eqn (1). This suggested that the active sites for the metal ion and MB were similar, and the competitive adsorption between the metal ion and MB decreased the adsorption of MB.
image file: c4ra13008a-f8.tif
Fig. 8 (a) Effect of MB (C0 = 150 mg L−1) on the adsorption of Pb2+ by GM. (b) Effect of Pb2+ (C0 = 150 mg L−1) on the adsorption of MB by GM (n = 3).

3.4. Effects of pH and temperature on the adsorption of GM

It is well-known that the pH of a system is an important variable in the adsorption process. The variation of pH could affect the surface charge of the adsorbent, the degree of ionization and the speciation of the adsorbate. Fig. 9a shows the variation of adsorption of Pb2+ (200 mg L−1) and MB (200 mg L−1) on GM at various pH values. It was seen that a higher pH value resulted in a lower adsorption of Pb2+, while the adsorption of MB remained nearly unchanged with the increase of pH. The high uptake level of Pb2+ at low pH values could be attributed to the increased concentration of hydrogen (H+) ions interacting with Pb2+, leading to increased binding sites on GM. As the pH increased, the removal of Pb2+ was possibly inhibited as a result of being flawed by precipitation as Pb(OH)2 or due to the competition between hydroxyl ions and metal ions on the sorption site. For MB, the adsorption kept nearly constant between pH 2 and 11. It might be because of the existence of Pb2+ prior to the effect of pH, and the association of dye cation on a solid would not take place easily, resulting in slight increase in adsorption.
image file: c4ra13008a-f9.tif
Fig. 9 (a) Effect of pH on MB–Pb2+ binary mixture by GM. (b) Effect of temperature on MB–Pb2+ binary mixture by GM.

The effect of temperature on the adsorptions of Pb2+ (200 mg L−1) and MB (200 mg L−1) was studied by changing the temperature from 20 to 40 °C, and the results are presented in Fig. 9b. The adsorption capacities of Pb2+ decreased and MB slightly decreased at temperatures ranged from 20 to 40 °C, which indicated that the adsorption process of the MB–Pb2+ binary system on the GM adsorbent was an exothermic process. Thus, the optimum temperature for the adsorption of Pb2+ and MB was elected to be 20 °C. The standard free energy change (ΔG0) provided information about the interaction between the surface of GM and MB or Pb2+. The ΔG0 could be calculated from the following relationship:44

 
ΔG0 = RT[thin space (1/6-em)]ln[thin space (1/6-em)]Kc (2)
 
image file: c4ra13008a-t2.tif(3)
where Ce (mg L−1) and qe (mg g−1) are the concentration and adsorption capacity at the equilibrium, respectively. Kc is the thermodynamic equilibrium constant, R is the universal gas constant 8.314 J mol−1 K−1 and T is the absolute temperature. The ΔG0 calculated from eqn (2) and (3) are listed in Table 1.

Table 1 ΔG0 values of the adsorptions of MB and Pb2+ on GM at 20, 30, and 40 °C
  20 °C (293.15 K) 30 °C (303.15 K) 40 °C (313.15 K)
ΔG0 (MB) −4.146 −3.775 −3.864
ΔG0 (Pb2+) −18.747 −16.650 −16.453


The negative ΔG0 values at different temperatures indicated the spontaneous nature of the adsorptions of Pb2+ and MB onto the adsorbent GM. The more negative value with the decrease of temperature showed that the amount adsorbed at equilibrium must increase with the decreasing temperature.

3.5. Effect of contact time on adsorption of GM

Fig. 10 presents the dynamic adsorption of MB (200 mg L−1) and Pb2+ (200 mg L−1) on the GM at 30 °C, pH = 5. During the adsorption process, it was seen that the MB adsorption gradually increased and reached an equilibrium adsorption of 298 mg g−1 at 50 min; Pb2+ adsorption also increased with the time but the equilibrium adsorption was slightly reduced; the equilibrium adsorption was 49 mg g−1. Therefore, GM is suitable for the efficient removal of potentially toxic metal ions and dyes.
image file: c4ra13008a-f10.tif
Fig. 10 Effect of contact time on the adsorption of MB and Pb2+ by GM.

3.6. Adsorption mechanism

To illustrate the mechanism of synergistic and competitive adsorption of potentially toxic metal ions and dyes on GM, an XRD study was performed (Fig. 11), and the corresponding adsorption mechanism is shown in Fig. 12. As shown in Fig. 11a, a typical diffraction peak of GM at 6.07° corresponded to a basal spacing of 1.47 nm (Fig. 12a). When MB was adsorbed on GM, the peak moved to a low angle at 5.46°, which corresponded to a basal spacing of 1.61 nm (Fig. 11b and 12b). Then, Pb2+ was adsorbed on GM, and the peak moved to a lower angle at 5.35°, which corresponded to a basal spacing of 1.65 nm (Fig. 11c and 12c). When Pb2+ was adsorbed on GM, the peak moved to a lower angle of 5.54°, which corresponded to a basal spacing of 1.59 nm (Fig. 11 and 12d). Then, MB was adsorbed on GM, and the peak was unchanged, which corresponded to a basal spacing of 1.59 nm (Fig. 11e and 12e). When Pb2+ and MB were adsorbed on GM at the same time, the peak moved to a lower angle of 5.79°, which corresponded to a basal spacing of 1.52 nm (Fig. 11f and 12f).
image file: c4ra13008a-f11.tif
Fig. 11 XRD patterns: (a) GM, (b) GM adsorbed MB, (c) GM adsorbed MB and then adsorbed Pb2+, (d) GM adsorbed Pb2+, (e) GM adsorbed Pb2+ and then adsorbed MB, and (f) GM adsorbed MB and Pb2+ simultaneously.

image file: c4ra13008a-f12.tif
Fig. 12 Adsorption mechanism: (a) GM, (b) GM adsorbed MB, (c) GM adsorbed MB and then adsorbed Pb2+, (d) GM adsorbed Pb2+, (e) GM adsorbed Pb2+ and then adsorbed MB and (f) GM adsorbed MB–Pb2+ simultaneously.

In a previous study, a multi-component solution might exhibit three possible types of adsorption effects under competitive conditions: (a) synergism: the effect of the mixture was greater than that of the individual sorbate in the mixture; (b) antagonism: the effect of the mixture was less than that of the individual sorbate in the mixture; (c) non-interaction: the mixture had no effect on the adsorption of each sorbate in the mixture.44

In our study, first of all, compared with that of GM (Fig. 12a), the basal spacing of MB-adsorbed GM (Fig. 12b) and Pb2+-adsorbed GM (Fig. 12c) increased 0.14 and 0.12 nm, respectively. As shown in Fig. 12a, the diameters of MB and Pb2+ were 0.16 and 0.14 nm, respectively, which suggested that the MB and Pb2+ could adsorb into the layer of GM; moreover, compared with MB-adsorbed GM (Fig. 12b), the basal spacing of MB-adsorbed, then Pb2+-adsorbed GM (Fig. 12c) increased, which indicated that the MB-adsorbed GM had a synergistic adsorption effect to Pb2+ adsorption onto the GM. Compared with the Pb2+-adsorbed GM (Fig. 12d), the basal spacing of Pb2+-adsorbed then MB-adsorbed GM (Fig. 12e) was unchanged, which indicated that the Pb2+-adsorbed GM had an antagonistic adsorption effect to MB adsorption onto the GM. As for the GM adsorb MB–Pb2+ binary mixture (Fig. 12f), the basal spacing decreased more than the basal spacing of MB-adsorbed GM (Fig. 12b) or Pb2+-adsorbed GM (Fig. 12c), which indicated that the GM adsorbed MB–Pb2+ binary mixture had an antagonistic adsorption effect to each other onto the GM. These results were in accordance with those of Fig. 8; in addition, the effect of Pb2+ on MB adsorption could mainly be explained by the reaction occurring at the surface of the GM (Fig. 12e). The adsorption of Pb2+ on the surface of GM might affect MB adsorption through the following mechanisms: (1) Pb2+ was bound to the same sites on GM surface as MB; (2) Pb2+ was attached to the GM surface through a mechanism different from MB, and the total sites available for subsequent MB adsorption remained the same, but a layer of Pb2+ adsorbed on the surface of GM might produce a barrier for MB to connect to the available adsorption sites.42,45 On the contrary, the effect of MB on Pb2+ adsorption might account for the adsorption of MB on GM (Fig. 12c), causing an increase in the surface negative charges, which might favor the adsorption of Pb2+. In addition, MB was adsorbed on the GM surface and produced more organic functional groups in the GM-MB surface, which caused an enhancement in the Pb2+ adsorption.

4. Conclusion

In this study, MMT-pillared GO as an adsorbent was prepared. Due to the pillar of GO by MMT, the BET specific surface area of GM (973 m2 g−1) was higher than that of GO (612 m2 g−1). The GO reunited during the increasing storage days, while the reuniting of GM was interrupted by MMT. The GM expressed faster adsorption speeds than GO. In single systems, GM showed a considerably higher adsorption of MB and Pb2+ than MMT or GO. In a binary-adsorbate system, a higher solution pH resulted in lower adsorption of Pb2+, while MB adsorption remained unchanged with the increasing pH. The adsorption capacity of Pb2+ and MB both decreased when the temperature ranged from 20 to 40 °C, which indicated that the adsorption process of MB–Pb2+ binary system on the GM adsorbent was an exothermic process. The adsorption mechanism shows that the presence of MB enhanced the adsorption efficiency of Pb2+ on GM, whereas the existence of Pb2+ decreased the adsorption capacity of MB on GM. Because GM is easily obtained and cheap, it would be promising for the removal of potentially toxic metal ions and dyes.

Acknowledgements

The authors acknowledge financial support from the National Natural Science Foundation of China (51172099, 21006038 and 21376104), the Foundation of Science and Technology Projects of Guangdong Province (2011B090300018), the Fundamental Research Funds for the Central Universities (21612109), the Research and innovation project of Jinan University for Excellent Master (201321), and the 2013 Jinan University Challenge Cup for Student Extracurricular Academic Science and Technology Work Competition (201312B07 and 201312B49). Dongliang Wan and Jinglin Zhang contributed equally to this work.

References

  1. B. Prelot, V. Einhorm, F. Marchandeau, J. M. Douillard and J. Zajac, J. Colloid Interface Sci., 2012, 386, 300 CrossRef CAS PubMed.
  2. L. Campbell, D. G. Dixon and R. E. Hecky, J. Toxicol. Environ. Health, 2003, 6, 325 CrossRef CAS PubMed.
  3. S. Wang and H. Wu, J. Hazard. Mater., 2006, 136, 482–501 CrossRef CAS PubMed.
  4. L. Mouni, D. Merabet, A. Bouzaza and L. Belkhiri, Desalination, 2011, 276, 148 CrossRef CAS PubMed.
  5. R. A. Goyer, Environ. Health Perspect., 1993, 100, 177 CrossRef CAS.
  6. T. Wu, X. Cai, S. Z. Tan, H. Y. Li, J. S. Liu and W. D. Yang, Chem. Eng. J., 2011, 173, 144 CrossRef CAS PubMed.
  7. C. A. P. Almeida, N. A. Debacher, A. J. Downs, L. Cottet and C. A. D. Mello, J. Colloid Interface Sci., 2009, 332, 46 CrossRef CAS PubMed.
  8. S. T. Yang, S. Chen, Y. L. Chang, A. Cao, Y. F. Liu and H. F. Wang, J. Colloid Interface Sci., 2011, 359, 24 CrossRef CAS PubMed.
  9. S. K. Porter, K. G. Scheckel, C. A. Impellitteri and A. Ryan, Rev. Environ. Sci. Technol., 2004, 34, 495 CrossRef CAS.
  10. J. L. Gardea-Torresdey, G. de la Rosa and J. R. Peralta-Videa, Pure Appl. Chem., 2004, 76, 801 CrossRef CAS.
  11. M. Pansini, Miner. Deposita, 1996, 31, 563 CrossRef CAS.
  12. S. B Wang, T. Terdkiatburana and M. O. Tadé, Sep. Purif. Technol., 2008, 58, 353 CrossRef PubMed.
  13. E. Repo, J. K. Warchoł, A. Bhatnagar and M. Sillanpää, J. Colloid Interface Sci., 2011, 358, 1261 CrossRef PubMed.
  14. S. J. Allen, G. McKay and J. F. Porter, J. Colloid Interface Sci., 2004, 280, 322 CrossRef CAS PubMed.
  15. M. Y. Chang and R. S. Juang, J. Colloid Interface Sci., 2004, 278, 18 CrossRef CAS PubMed.
  16. A. Bhatnagar and A. K. Jain, J. Colloid Interface Sci., 2005, 281, 49 CrossRef CAS PubMed.
  17. V. K. Gupta, A. Mittal and V. Gajbe, J. Colloid Interface Sci., 2005, 284, 89 CrossRef CAS PubMed.
  18. M. Choi and J. Jang, J. Colloid Interface Sci., 2008, 325, 287 CrossRef CAS PubMed.
  19. L. D. Pablo, M. L. Chávez and M. Abatal, Chem. Eng. J., 2011, 171, 1276 CrossRef PubMed.
  20. J. Zhu, V. Cozzolino, M. Pigna, Q. Y. Huang, A. G. Caporale and A. Violante, Chemosphere, 2011, 84, 484 CrossRef CAS PubMed.
  21. S. B. Wang, H. Q. Sun, H. M. Ang and M. O. Tadé, Chem. Eng. J., 2013, 226, 336 CrossRef CAS PubMed.
  22. D. Ma, J. T. Lin, Y. Y. Chen, W. Xue and L. M. Zhang, Carbon, 2012, 50, 3001 CrossRef CAS PubMed.
  23. S. H. Abhishek, W. I. Choi and G. Tae, Chem. Commun., 2012, 48, 5820 RSC.
  24. Z. Y. Sui, Y. Cui, J. H. Zhu and B. H. Han, ACS Appl. Mater. Interfaces, 2013, 5, 9172 CAS.
  25. O. S. Chan, W. H. Cheng and G. McKay, Chem. Eng. J., 2012, 191, 162 CrossRef CAS PubMed.
  26. M. S. Chiou and G. S. Chuang, Chemosphere, 2006, 62, 731 CrossRef CAS PubMed.
  27. G. Atun and E. T. Acar, Sep. Sci. Technol., 2010, 45, 1471 CrossRef CAS.
  28. D. L. Zhao, G. D. Sheng, C. G. Chen and X. K. Wang, Appl. Catal., B, 2012, 111, 303 CrossRef PubMed.
  29. G. Zhao, S. Song and C. Wang, et al., Adv. Mater, 2011, 23, 3959 CrossRef CAS PubMed.
  30. D. Mohan and K. P. Singh, Water Res., 2002, 36, 2304 CrossRef CAS.
  31. G. X. Yang and H. Jiang, Environ. Sci. Technol., 2011, 45, 10454 CrossRef PubMed.
  32. X. Cai, S. Z. Tan, A. G. Xie, M. S. Lin, Y. L. Liu, X. J. Zhang, Z. D. Lin, T. Wu and W. J. Mai, Mater. Res. Bull., 2011, 46, 2353 CrossRef CAS PubMed.
  33. X. Cai, S. Z. Tan, M. S. Lin, A. G. Xie, W. J. Mai, X. J. Zhang, Z. D. Lin, T. Wu and Y. L. Liu, Langmuir, 2011, 27, 7828 CrossRef CAS PubMed.
  34. X. Cai, S. Z. Tan, A. L. Yu, J. L. Zhang, J. H. Liu, W. J. Mai and Z. Y. Jiang, Chem.–Asian J., 2012, 7, 1664 CrossRef CAS PubMed.
  35. C. M. Chen, Q. H. Yang, Y. G. Yang, Y. F. Wen, P. X. Hou, M. Z. Wang and H. M. Cheng, Adv. Mater., 2009, 21, 3007 CrossRef CAS.
  36. X. Cai, M. S. Lin, S. Z. Tan, W. J. Mai, Y. M. Zhang, Z. W. Liang, Z. D. Lin and X. J. Zhang, Carbon, 2012, 50, 3407 CrossRef CAS PubMed.
  37. H. H. Murray, Applied clay mineralogy: occurrences, processing and applications of kaolins, bentonites, palygorskite-sepiolite, and common clays, Oxford, 2007 Search PubMed.
  38. C. Zhang, W. W. Tjiu, W. Fan, Z. Yang, S. Huang and T. Liu, J. Mater. Chem., 2011, 21, 18011 RSC.
  39. Z. G. Pei, L. J. Li, L. X. Sun, S. Z. Zhang, X. Q. Shan, S. Yang and B. Wen, Carbon, 2013, 51, 156 CrossRef CAS PubMed.
  40. S. H. Lin and R. S. Juang, J. Hazard. Mater., 2002, 92, 315 CrossRef CAS.
  41. L. D. Pabloa, M. L. Chávezb and M. Abatala, Chem. Eng. J., 2011, 171, 1276 CrossRef PubMed.
  42. G. K. Ramesha, A. Vijaya Kumara, H. B. Muralidhara and S. Sampath, J. Colloid Interface Sci., 2011, 361, 270 CrossRef CAS PubMed.
  43. V. K. Upadhyayula, S. G. Deng, M. C. Mitchell and G. B. Smith, Sci. Total Environ., 2009, 408, 1–13 CrossRef CAS PubMed.
  44. V. Hernández-Montoya, M. A. Pérez-Cruz, D. I. Mendoza-Castillo, M. R. Moreno-Virgen and A. Bonilla-Petriciolet, J. Environ. Manage., 2013, 116, 213 CrossRef PubMed.
  45. T. Terdkiatburana, S. B. Wang and M. O. Tadé, Chem. Eng. J., 2008, 139, 437 CrossRef CAS PubMed.

This journal is © The Royal Society of Chemistry 2015