Density functional theory calculations of atomic, electronic and thermodynamic properties of cubic LaCoO3 and La1−xSrxCoO3 surfaces

Shuguang Zhang*ab, Ning Hana and Xiaoyao Tanc
aSchool of Chemical Engineering, Shandong University of Technology, Zibo 255049, China. E-mail: gregzhangsg@gmail.com
bDepartment of Chemical and Biomolecular Engineering, University of Notre Dame, Notre Dame 46556, USA
cDepartment of Chemical Engineering, Tianjin Polytechnic University, Tianjin 300387, China

Received 17th October 2014 , Accepted 24th November 2014

First published on 24th November 2014


Abstract

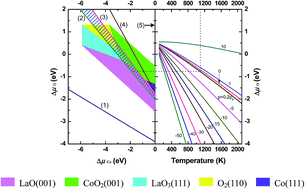
Spin-polarized density functional theory calculations employing the generalized gradient approximation (GGA) + U scheme were used to investigate the atomic, and electronic structures of ferromagnetic LaCoO3 and La1−xSrxCoO3 surfaces. Nonstoichiometric symmetrical slab models were adopted. The thermodynamic stability of these surfaces was analyzed with phase diagrams drawn with the total energies obtained from calculations. The influence of Sr-doping on the thermodynamic stability of the surfaces was also examined. The results indicate that Sr ions prefer to substitute La ions in the outermost layers rather than those in bulk layers for both (001) surfaces. In the undoped LaCoO3 system, CoO2- and LaO-terminated (001) surfaces are the most stable of all the considered surfaces under typical operational conditions of the solid oxide fuel cells (T = 1100 K, pO2 = 0.2 atm), while Sr-doping in the LaCoO3 crystal destabilizes the CoO2-terminated surface with respect to the La0.75Sr0.25O-terminated surface.


1. Introduction

The rational design of high active cathode materials for intermediate temperature solid oxide fuel cells (IT-SOFCs) remains one of the most critical scientific challenges.1–4 To achieve this goal, however, it is urgent to reveal the intrinsic relationship between the surface catalytic properties and the chemical composition and structure of the cathode materials. Although various electrochemical2 and in situ vibrational surface spectroscopy5 techniques have been applied to investigate the cathode performance, the detailed mechanisms of the surface oxygen reduction reaction (ORR) and bulk transport processes are still unclear due to the complexity of the interfaces. First-principles calculation may be a powerful approach to elucidate the oxygen–surfaces interaction nature through providing details about electronic structures, geometrical parameters, potential energy surface, transition states and intermediate species. Although Kotomin6–8 and M. Liu9,10 had used it to study the ORR mechanisms at La1−xSrxMnO3−δ (LSM) material based on the calculated reaction energetics and potential energy surfaces, most of these investigations employed the orthorhombic or ideal cubic crystal structure of LSM, which is far away from the reality. As for the more active mixed ionic and electronic conductor La1−xSrxCoO3−δ (LSC), however, to the best of our knowledge, few such literatures are available, especially focused on the surface properties related to catalysis.

Exploring the electronic structure and surface stability of cathode material at different conditions is the necessary prerequisite for interpreting the interaction between oxygen and surface. In this study, we obtained the electronic and atomic structures of LaCoO3 and La1−xSrxCoO3−δ systems using the first-principles computation method. Then the stability of three low-index surfaces ((001), (110) and (111)) with different terminations was examined by thermodynamic phase diagram analysis.11–13 This will result in a much more detailed understanding of changes in the surface stability along with the two most important environmental parameters—temperature and O2 partial pressure.

Density functional theory (DFT) with LDA or GGA schemes can give accurate ground state properties for a variety of materials.14,15 However, they introduce a non-physical electron self-interaction energy meanwhile.16,17 To a great degree, the success of them is attributable to the cancellation of the self-interaction energy between different calculations. But for those strongly correlated systems with the on-site Coulomb and exchange interactions, such as transition metal oxides and rare-earth compounds, they will obtain poor magnetic ground state and electronic structure because the error cancellation can't be relied upon any more.18 This problem can be effectively mitigated by DFT + U method19 which selectively introduces an empirical Hubbard energy correction to account for the on-site Coulomb interactions in the localized electron states (d, f orbitals) whose self-interaction is particularly large. Here we adopted the GGA + U approach for the 3d electrons of Co element.

2. Computational methods

2.1 First-principles calculation details

All periodic spin polarized first-principles computations were performed using the plane-wave pseudopotential technique with the projector-augmented wave (PAW)20 to model the ion-electron interaction as implemented in the Vienna ab initio simulation package (VASP).21,22 The generalized gradient approximation + U (GGA + U) scheme with the Perdew–Burke–Ernzerhof (PBE)23,24 functional and a 400 eV cutoff for the plane-wave basis set were used throughout the computations. La, Sr, Co, and O atoms were described by 11 (5s25p65d16s2), 10 (4s24p65s2), 9 (4s13d8), and 6 (2s22p4) valence electrons, respectively. The atomic positions of all the structures were fully relaxed using the conjugate gradient method during the geometry optimizations. The convergence thresholds were set as 10−6 eV for energy and 0.05 eV Å−1 for force. 4 × 4 × 4 and 4 × 4 × 1 Monkhorst–Pack k-point meshes25 in the Brillouin zone were used for 2 × 2 × 2 perovskite supercell containing 40 atoms and seven-layer slab geometry optimizations, respectively, so that the k-point density in reciprocal space were kept close to each other.

The rotationally invariant GGA + U approach in the simplified spherically averaged version26,27 was adopted, where the parameters U and J enter into the density functional as a combined effective interaction parameter, Ueff = UJ. According to the literature,28 J = 1 eV was used in all our GGA + U calculations. The value of Ueff (3.0 eV) was determined by bandgap scan of bulk LaCoO3 material, which will be introduced in Section 3.1 in detail.

Orthorhombic and cubic are the two most common phases of LaCoO3 material. Here only the cubic phase (Pm3m) was considered because LaCoO3 has a cubic structure under SOFC operating conditions above 500 °C in ambient air (the cooperative Jahn–Teller orbital order/disorder transition temperature is about 500 K (ref. 29)). And the cubic-structure Sr-doped LaCoO3 models (bulk and slabs) were generated based on undoped LaCoO3 systems. On the other hand, although it is on average cubic under the high-temperature conditions, the local J–T distortion persisted structure is more realistic than the ideal one.30 Therefore we have carried out calculations keeping overall cubic symmetry constraints but allowing for local distortions inside the supercell. For bulk computations, ideal cubic unit cells without internal relaxation were first performed to obtain lattice constants and then ions positions were optimized internally in a 2 × 2 × 2 cubic supercell to restore CoO6 octahedron rotation (Fig. 2). The surfaces slab calculations were performed with lattice parameters a, b identical to those of bulk supercell while that in the c direction was relaxed freely.

Previous studies indicate that neglect of spin polarization will result in considerable errors in material properties.7 Thus the spin-polarized computations were carried out in this study to properly describe the magnetic property of LaCoO3-based materials and the triplet ground state of oxygen (3O2). It is well known that the magnetic states of perovskite materials are quite complex and undergo phase transitions at elevated temperatures. Experimental results show that LaCoO3 is paramagnetic31 under the SOFC operating conditions (T = 800–1500 K). Different magnetic states (NM: nonmagnetic; FM: ferromagnetic; A-AFM: A type antiferromagnetic; C-AFM: C type antiferromagnetic; G-AFM: G type antiferromagnetic) of bulk LaCoO3 system were tested here. Results indicate that the NM configuration of LaCoO3 is the most stable magnetic state, which is in agreement with the experimental conclusion.31

The structures and stability of three low-index surfaces—(001), (110) and (111) with different terminations were discussed here by calculating several properties, including the atomic displacements, surface energies, electron densities, Bader charges,32–34 the Gibbs free energies under different external conditions, etc. The nonstoichiometric symmetrical slabs (odd number of layers, the same terminations on both sides, e.g., CoO2 or LaO for (001) surface.) were adopted because these cancel the dipole moment35 of stoichiometric nonsymmetrical ones (even number of planes, different terminations on both sides), which would reduce the computation time. In addition, this kind of model allows us to investigate separately the properties of different terminations (e.g., LaO-(001) and CoO2-(001)), which is indispensable for thermodynamic analysis of surface stability under different conditions.

Our test results indicated that seven-layer slabs were thick enough for all three surfaces with different terminations to show convergence of the main properties, which is in line with literature.6,7 The periodically repeated slabs were separated by a vacuum space of 16 Å along the z direction in order to eliminate the interaction between the surfaces through the vacuum region.

Moreover, bulk lattice optimization and energy calculation were also performed on these metals and corresponding oxides, La, Co, Sr, La2O3, CoO, Co3O4, SrO and SrCoO3, involved in the thermodynamic stability investigation of La1−xSrxCoO3 low-index surfaces.

2.2 Thermodynamics principles of surface stability

The thermodynamics calculation scheme used in this work to determine the stability of different surfaces with different terminations of complicated oxides which are in equilibrium with environmental conditions (oxygen partial pressure, temperature, etc.) had been introduced in detail in literature8,11,12,36,37 and the references therein. It's based on the data of foregoing first-principles calculations. Here is a brief description of the analysis process (Sr-doped LaCoO3 system, La1−xbSrxbCoO3, is taken as an example, xb = 0.125).

We'll begin with the characteristics of the most stable surface: (I) it is in equilibrium with both bulk material and the surrounding oxygen atmosphere; (II) it has the lowest positive surface Gibbs free energy.

Firstly, for a certain surface of La1−xbSrxbCoO3 system, criterion (I) means that the chemical potentials of four constituents (La, Sr, Co and O) follow the well-known relationship:

 
(1 − xb)μLa + xbμSr + μCo + 3μO = μ0LSC = ELSCbulk (1)
where μ0LSC, μLa, μSr, μCo, μO and ELSCbulk denote the standard chemical potential of the bulk La1−xbSrxbCoO3, the chemical potentials of four constituents and the DFT energy of La1−xbSrxbCoO3 per formula unit, respectively. In eqn (1), we substitute ELSCbulk for μ0LSC, neglecting the vibrational and pV contributions because they are typically smaller than the error of typical DFT calculation,11 especially the vibrational contribution is very difficult to be calculated accurately and feasibly at present. Similar disposal had been employed in the subsequent investigations of this study. In addition, eqn (1) also considers the strong influence of O2 partial pressure (pO2) and temperature (T) via the variable—O chemical potential.

For our symmetrical slab models, the excess surface Gibbs free energy Ω is defined as:

 
image file: c4ra12563k-t1.tif(2)
 
image file: c4ra12563k-t2.tif(3)
 
image file: c4ra12563k-t3.tif(4)
where i denote the slab termination, e.g., i = CoO2 and LaO for the (001) surface, LaCoO and O2 for (110) surface. Ai is the surface area of i-terminated slab. Eislab, Embulk are the DFT energies of the i-terminated slab and the bulk metal m per metal atom, respectively. ΓiSr,a denotes12 the excess of component a with respect to the number of Sr ions in the i-terminated slabs. Nia and Nabulk are the numbers of atom a in slab and in La1−xbSrxbCoO3 bulk, respectively. It is obvious that Φi is a constant for a certain slab. Δμ, the chemical potential deviation of four constituents, can be calculated from eqn (5)–(8):
 
ΔμCo = μCoECobulk (5)
 
ΔμSr = μSrESrbulk (6)
 
ΔμLa = μLaELabulk (7)
 
image file: c4ra12563k-t4.tif(8)

According to criterion (II), excess surface Gibbs free energy (Ω) of the most stable slab i should be the positive minimum (eqn (9), here ΔμCo and ΔμLa are taken as independent variables), otherwise the bulk La1−xbSrxbCoO3 will disintegrate spontaneously.

 
ΩiμCoμLa) > 0 (9)

Eqn (10) determines the boundary between stability regions of different slabs with i and j terminations:

 
ΩiμCoμLa) = ΩjμCoμLa) (10)

Besides the forbiddance of bulk's disintegrating spontaneously, the phase separation of corresponding metals (La, Sr and Co) and oxides (La2O3, SrO, CoO, Co3O4 and SrCoO3) should also be prevented to guarantee the stable existence of La1−xbSrxbCoO3 bulk and its surface, leading to the following relationships:

 
ΔμCo < 0 (11)
 
ΔμLa < 0 (12)
 
ΔμSr < 0, i.e. (1 − xbμLa + ΔμCo + 3ΔμO > EfLSC (13)
 
image file: c4ra12563k-t5.tif(14)
 
EfCoO > ΔμCo + ΔμO (15)
 
image file: c4ra12563k-t6.tif(16)
 
EfLSCxbEfSrO < (1 − xbμLa + ΔμCo + (3 − xbμO (17)
 
image file: c4ra12563k-t7.tif(18)
where Ef is the formation energy of corresponding oxide material calculated from the DFT energies.

Last but not least, in order to obtain more accurate result, the chemical potential deviation of O atom ΔμO(T,P) is computed by using thermodynamics data38 according to literature,12,13

 
image file: c4ra12563k-t8.tif(19)
 
ΔGO2(T,[thin space (1/6-em)]p0) = GO2(T,[thin space (1/6-em)]p0) − GO2(T0,[thin space (1/6-em)]p0) (20)
where G denotes the Gibbs free energy of O2, T0 = 298.15 K, p0= 1 atm. δμ0O, a correction term to compensate the reference state deviation of our theoretical calculations from that of experimental data, is estimated from the following eqn (21),
 
image file: c4ra12563k-t9.tif(21)
here E, ΔHf,0, S, and n denote the DFT energies of metals, oxides and O2, the experimental standard formation enthalpies of metal oxides, the experimental standard entropy of O2, and the number of metal oxide species, respectively.

Then we can plot the phase diagrams to predict the stability of different surfaces with different terminations. The investigation on undoped LaCoO3 system complies with similar process.

3. Results and discussion

3.1 Atomic and electronic structures

3.1.1 U parameter optimization and properties of bulk LaCoO3. Before the investigation on surfaces of LSC materials, we firstly determined the value of Ueff for Co element, which is generally related to the valence state and the crystal structure, through examining the atomic and electronic structures of the bulk LaCoO3. Band gap scan calculations were performed with the Ueff changing from 1.1 to 6.0 eV for every 0.1 eV (Fig. 1). From this graph, it is found that the band gap of bulk cubic LaCoO3 remains closed when Ueff < 2.2 eV, while the value of the band gap increases linearly with Ueff on the whole after it is opened at Ueff = 2.3 eV. When Ueff = 3.0 eV is employed, a band gap of 0.31 eV is obtained, which agrees with the experimental result very well.39 In addition, the effective interaction parameter Ueff = 3.0 eV is very close to the value suggested by Morgan et al.,28 3.3 eV. Thus the Ueff = 3.0 eV was used for all the subsequent GGA + U calculations to investigate the atomic, electronic structures and phase stability of the surfaces of LSC materials.
image file: c4ra12563k-f1.tif
Fig. 1 Band gap of cubic LaCoO3 as a function of effective interaction parameter Ueff (1.1–6.0 eV) calculated by GGA + U scheme.

Fig. 2(a) shows the optimized 2 × 2 × 2 supercell structure of undoped LaCoO3, local distortion could be noticed. The rotation angles of CoO6 octahedrons around the three principle axes (x, y, z) are about ±6.8°, ±7.5°and ±7.5°, respectively. The Co–O bond lengths are around 1.93–1.98 angstrom. All the ∠Co–O–Co and ∠O–Co–O are about 159–160°, 88–92°, respectively.


image file: c4ra12563k-f2.tif
Fig. 2 Optimized structures of undoped and Sr-doped LaCoO3.

The optimized parameters of cubic LaCoO3 and corresponding experimental results are presented in Table 1. It is obvious that the calculated lattice constants are in good agreement with the experimental ones40 as well as previous computational results.28 As for Co3+, there are three possible spin states (Fig. 1S), e.g. high spin (HS, t2g4eg2), intermediate spin (IS, t2g5eg1) and low spin (LS, t2g6eg0). The calculated magnetic moments of Co ions in the 2 × 2 × 2 supercell, either local or average, demonstrate that Co ions adopt a mixed LS-IS state which is some different from the experimental result,40 mixed IS-HS state, measured under the condition of high-temperature SOFC. This should be attributed to the limitation of first-principle method that it can not yet be used to calculate properties above 0 K at present.

Table 1 Optimized lattice constants, local magnetic moments, Bader charges of 2 × 2 × 2 bulk cubic LaCoO3 structure
a The local magnetic moments are calculated from the difference between electron density of up and down spins projected onto Wigner–Seitz sphere of Co (radius is 1.302 Å), while those in parentheses are the average values from the total magnetic moments of the 2 × 2 × 2 supercell.
This work a = b = c (Å)   3.856
Local magnetic momenta (μB, per Co atom)   0.29, 1.78–2.17 (1.75)
Spin state   LS/IS (t2g5+δeg1−δ)
Bader charge (e, averaged over all ions of the same type) qLa 2.092
qCo 1.349
qO −1.147
Other calculated results28 a = b = c (Å)   3.848
Local magnetic moment (μB, per Co atom)   1.8–2.0 (2.0)
Spin state   IS
Bader charge (e) qLa 2.083
qCo 1.501
qO −1.195
Experimental data40 a = b = c (Å) 3.85–3.90
Local magnetic moment 2–4
Spin state IS/HS (t2g5−δeg1−δ)


In addition, the Bader charge of La, +2.092e, is close to its formal charge of +3e, while those of Co and O ions, +1.349e and −1.147e, are much smaller than their formal charges of +3e, −2e. This indicates that the Co–O chemical bond presents the notable feature of covalent bonding, which is typical for ABO3 perovskites. The electron density difference maps of LaCoO3 system (Fig. 3) confirms this conclusion.


image file: c4ra12563k-f3.tif
Fig. 3 Electron density difference maps of the CoO2 (a) and LaO (b) planes in bulk LaCoO3 crystal calculated with respect to the superposition of atomic densities. Solid (red) and dash (blue) lines represent deficiency and excess of the electron charge, respectively, with the increment of 0.003e Å−3.

In a word, the calculated results (lattice constants, local magnetic moments and Bader charges) of undoped LaCoO3 bulk are consistent with experimental and other theoretical results on the whole, indicating our model and parameters are reasonable.

3.1.2 Sr-doped cubic LaCoO3 system—La0.875Sr0.125CoO3. It's well known that the smaller the Sr content, the larger the necessary system supercell size. In order to improve the current computational study of Sr-doped system more feasible to be carried out, the model of LaCoO3 with a 12.5% Sr doping was chose to be set up because it is very close to typical experimental concentrations (≤10% Sr). In the formerly optimized 2 × 2 × 2 LaCoO3 supercell, a Sr concentration of x = 0.125 was achieved by replacing one of the eight La by Sr (Fig. 2(b)). The optimized parameters of Sr-doped LaCoO3 are listed in Table S1. It can be seen that the lattice constants almost keep the same as those of undoped LaCoO3. The rotation angles of CoO6 octahedrons around the three principle axes (x, y, z) are about ±6.3°, ±7.1°and ±7.0°, respectively. The Co–O bond lengths are around 1.94–1.97 angstrom. All the ∠Co–O–Co and ∠O–Co–O are about 159–163°, 88–93°, respectively.

The local magnetic moments, 1.48–1.53 μB, imply that Co ions in La0.875Sr0.125CoO3 bulk also take on mixed LS-IS state. The Bader charges of La and Sr ions, +2.094e and +1.593e, are close to their formal charges, which is similar to the undoped LaCoO3. However, Bader charge of Co ion, +1.281e, is more negative than that in undoped LaCoO3 bulk system, +1.349e, indicating that Sr-doping causes a decrease of the Co–O bond covalency.

3.1.3 Optimized lattice parameters of related metals and oxides. Table S2 shows the optimized lattice constants of all metals and oxides relate to the surface thermodynamic stability analysis of La1−xSrxCoO3 systems, which are all in good agreement with the experimental values.41–48 In addition, the O–O bond length and vibrational frequency of O2 molecule we obtained are 1.23 Å and 1563 cm−1, respectively, which are in good accordance with experimental results,49,50 1.21 Å and 1550 cm−1. All these again demonstrate the models and parameters used in this study are reasonable.
3.1.4 Low-index surfaces of undoped LaCoO3. The relaxed configurations of three low-index surfaces of undoped LaCoO3 system—(001), (110) and (111) with different terminations were displayed in Fig. 4. Compared to the bulk-truncated surface structures, considerable reconstruction or rumpling occurred in all these slabs, especially along the z direction vertical to the surface planes. To describe it in detail, LaO- and CoO2-terminated (001) surface slabs were taken as examples. The calculated atomic displacements are listed in Table 2 (the layer numbered scheme is shown in Fig. S2). In the LaO-terminated (001) slab, displacements toward the slab center (0.05–1.35% of bulk lattice constant) are observed for those top-layer La of both sides, whereas the La ions in other layers move in the opposite direction (0.10–1.18%). All the Co and O ions in this slab go outward. The order of displacement values is: O > Co > La. In the CoO2-terminated (001) slab, all La ions move toward the top-layer (1.44–2.33%), while the cases of Co and O ions are more complicated, some go inward the slab center and others move outward, which maybe result from the tilting of the CoO6 octahedra. For both (001) slabs, it also can be seen that the displacements of ions decrease gradually when going along the [001] direction from top-layer to the inner-layer, whose properties are close to those of the bulk. This theoretical prediction of surface wavy distortion could be examined by means of experiments, such as LEED technique, etc.
image file: c4ra12563k-f4.tif
Fig. 4 Side views of three low-index surfaces of cubic LaCoO3 system with different terminations.
Table 2 Calculated atomic displacements along the z direction (in percent of bulk lattice constant, and the 4th layer is taken as the reference plane), Bader charges qB (e) and the deviations from bulk average values ΔqB (e) of LaO- and CoO2-terminated (001) surfaces. Negative sign of displacement means atom moving toward the slab center. 1–7 are sequence numbers of slab layers from one side to the other side (as shown in Fig. S2)
Layer sequence LaO-terminated (001) CoO2-terminated (001)
Atom Displacement Δz (%) Bader charge (e) Atom Displacement Δz (%) Bader charge (e)
qB ΔqB qB ΔqB
1 La 0.10, −0.05 to −1.35 1.98–2.02 −0.07–0.11 Co 0.42–0.74 1.43–1.46 0.08–0.11
O 3.59–5.70 −1.28 to −1.34 −0.13 to −0.19 O 0.32–1.28, −0.06 to −1.23 −0.92 to −1.08 0.07–0.23
2 Co 1.61–2.19 1.24–1.30 −0.05 to −0.11 La 1.44–1.97 2.10, 2.11 0.01, 0.02
O 1.45–3.36 −1.18 to −1.21 −0.03 to −0.07 O 0.13, −0.66 to −0.86 −1.12 to −1.16 −0.01–0.03
3 La 0.22–1.18 2.09 −0.01–0.00 Co −0.04 to −0.18 1.37–1.40 0.02–0.05
O 0.04–1.45 −1.19 to −1.22 −0.05 to −0.07 O 0.28–0.82, −0.07 to −0.50 −1.10 to −1.13 0.01–0.05
4 Co 1.33–1.49 −0.02–0.14 La 2.09, 2.10 0.00
O −1.16, −1.17 −0.01 to −0.03 O −1.14 to −1.16 −0.01–0.01
5 La 0.10–1.16 2.08, 2.09 −0.01–0.00 Co 0.56–0.74 1.36–1.39 0.01–0.04
O 0.04–1.47 −1.19, −1.21 −0.04 to −0.06 O −0.02, 0.33–1.36 −1.12 to −1.15 0.00–0.03
6 Co 1.78–2.26 1.24–1.30 −0.05 to −0.11 La 2.12–2.33 2.10, 2.11 0.01, 0.02
O 1.47–3.29 −1.18 to −1.20 −0.04 to −0.06 O 0.00–0.86 −1.13, −1.14 0.00, 0.01
7 La −0.11 to −1.34 1.98–2.02 −0.07 to −0.12 Co 1.22–1.45 1.43–1.46 0.08–0.11
O 3.03–3.52 −1.28 to −1.34 −0.13 to −0.19 O 0.49–2.14, −0.03 to −0.39 −0.91 to −1.08 0.07–0.24


The top-layer electron density difference maps of CoO2-terminated (001) and LaO-terminated (001) surface slabs calculated with respect to the superposition of atomic densities are plotted in Fig. S3(a) and (b), demonstrating the considerable covalency contribution of the Co–O bonds in the top-layer, the same conclusion as that of the bulk material. In order to visualize the charge density redistribution upon surface cleavage and atomic relaxation more intuitively, we also plotted the electron density difference maps with respect to the bulk electron density in Fig. 5, indicating that the surface-induced perturbation is not limited to the first layer. Electron densities of the near-surface atoms changed dramatically (considerably polarized) upon the surface formation and relaxation, while those in the inner layers changed a little or even identical to the bulk electron density (weakly perturbed). This agrees well with the conclusion of atomic displacements analysis.


image file: c4ra12563k-f5.tif
Fig. 5 The electron density difference maps of CoO2-terminated (001) (a) and LaO-terminated (001) (b) surface slabs projected to the (010) cross-sections, calculated with respect to the bulk electron density. Solid (red) and dash (blue) lines represent deficiency and excess of the electron charge, respectively, with the increment of 0.03e Å−3.

To further elucidate the electron density redistribution, Bader charge analysis was also carried out. Bader charge qB (e) and deviations from bulk average values ΔqB (e) of LaO- and CoO2-terminated (001) surfaces are listed in Table 2. It is shown that the charge redistribution in the CoO2-terminated (001) surface is restricted to the top-layer on the whole, while that of the LaO-terminated (001) surface spreads to deeper layers. The total Bader charge deviations of these two slabs with respect to the bulk are equal but have opposite signs, ±3.78e, deviated from ± 4e, which is expected from the formal ionic charges (La3+, Co3+, O2−), due to the partial covalent character of Co–O bond. Furthermore, Bader charges of both Co and O ions in the CoO2-terminated (001) slab become more positive than those in bulk, implying an increase of Co–O bond covalency near the top-layer upon the surface formation, similar conclusions were also obtained in other perovskites.13

Although our 7-layer slabs are nonstoichiometric, it will contain an integer number of bulk unit (LaCoO3) as long as putting two symmetrical slabs with complementary terminations (e.g., LaO-(001) and CoO2-(001)) together. Thus, definition of the nonstoichiometric slab surface energy is13

image file: c4ra12563k-t10.tif
where Esurf, S, Et1 and Et2 are surface energy, area of slab surface, total energies of the 7-layer slabs with complementary terminations, respectively. Energies of the corresponding structures and magnetic state in bulk LaCoO3 crystal (nEbulk) are taken as the reference level, n is the number of the bulk units. The surface energy calculation results of LaCoO3 surfaces ((001), (110) and (111)) are summarized in Table 3.

Table 3 Calculated surface energies for the (001), (110) and (111) surfaces of undoped LaCoO3
Surface S (× 10−19, m2) Esurface,unrelaxed (J m−2) Esurface,relaxed (J m−2)
(001)LaO-term. 5.95 1.82 1.08
(001)CoO2-term. 5.95    
(110)LaCoO-term. 8.41 2.79 1.66
(110)O2-term. 8.41    
(111)LaO3-term. 10.3 2.01 1.34
(111)Co-term. 10.3    


From the results of either unrelaxed or relaxed calculation, it can be seen that the most stable and unstable surfaces are (001), (110), respectively, among all three low-index surfaces from the point of view of the surface energy. Similar conclusion had been obtained on the investigation of LaMnO3 material.51

3.2 Surface stability of undoped cubic LaCoO3 system

According to the thermodynamics computation scheme described in Section 2.2, the formation energies of corresponding oxides Ef, parameters presented in the definition of the excess surface Gibbs free energy Ω and the correction term of O atom chemical potential, δμ0O, had been obtained and summarized in Table S3–S5.

The formation energies of a variety of oxides calculated by GGA + U scheme are compared with experimental formation enthalpies in Table S3. Our calculations underestimate these formation energies, which is probably induced by the + U term, contrary to the result of LaMnO3 system52 calculated with GGA scheme. Fortunately, formation energy of the LaCoO3 calculated from oxides (La2O3, CoO and O2) agrees with the experimental data very well,53,54 which means that the errors of our calculated formation energies for oxides will cancel out one another considerably when they are used together. All these calculated formation energies of oxides are employed to plot the boundaries separating the stable LaCoO3 area from the phases of metals and their oxides in phase diagram (Fig. 6).


image file: c4ra12563k-f6.tif
Fig. 6 Phase diagram of different surfaces with different terminations in undoped LaCoO3 system (cubic phase). The numbers in parentheses point to lines, where phase separations of metals and their oxides from bulk LaCoO3 begin to occur: (1) La, (2) La2O3, (3) Co3O4, (4) CoO, (5) Co. Hatched area between La2O3 and Co3O4 precipitation lines represents the stable region. The right part of this figure illustrates the variance of a series of ΔμO along with temperature and O2 partial pressure. The labels m on the lines express the O2 partial pressure: pO2 = 10m atm.

The right side of Fig. 6 demonstrates the dependencies of the O chemical potential on the temperature and O2 partial pressure, which were deduced from eqn (19)–(21) using thermodynamics data.38 The correction was done with the average value of δμ0O of different oxides (Table S5). The left part of Fig. 6 is the surface phase diagram of LaCoO3 drawn according to the DFT calculation results. As mentioned in Section 2.2, the most stable surface has the smallest positive excess surface Gibbs free energy. The colored areas are limited by lines where the lowest excess surface Gibbs free energy becomes zero (defined by eqn (9)). We can tell which surface of LaCoO3 is the most stable one under any conditions on these grounds from Fig. 6. The lines numbered from (1) to (5) in Fig. 6 are the boundaries separating stable LaCoO3 from phases of metals (La, Co) and corresponding oxides (La2O3, CoO, Co3O4). Therefore, the LaCoO3 material can exist stably only within the area outlined by these lines, which is prominently marked as hatched area between line 2 (precipitation of La2O3) and line 3 (precipitation of Co3O4). Five of all considered six surface slabs appear in our plotted phase diagram but only four are stable within the stability region of the cubic LaCoO3, qualitative description about this is summarized in Table 4.

Table 4 Qualitative description about the conditions for stable existence of the LaCoO3 surface slabs
Surface slabs Conditions for stable existence (different views)
Chemical potential (μ) O2 partial pressure Temperature
pO2 = 0.2 atm T = 1100 K
LaO-terminated (001) Low μO (O-poor limit) High T Low pO2
High μCo (Co-rich limit)
CoO2-terminated (001) Intermediate μO Intermediate T Intermediate pO2
LaO3-terminated (111) Intermediate μCo
O2-terminated (110) High μO (O-rich limit) Low T High pO2
Low μCo (Co-poor limit)
Co-terminated (111) Out of the hatched stability region
LaCoO-terminated (110) On the other side (ΔμCo > 0), unstable


At the ambient oxygen partial pressure (pO2 = 0.2 atm), it is found that both CoO2-terminated and LaO-terminated (001) surfaces can be stable in the temperature range of 750–1250 K, which covers the typical operational temperature of SOFC (T = 1100–1200 K). Only above 1250 K, LaO-terminated (001) surface becomes dominated. CoO2-terminated (001) and LaO3-terminated (111) surfaces coexist between 750 K and 350 K. Then, the coexistence of three surfaces, CoO2-terminated (001), LaO3-terminated (111) and O2-terminated (110), will occur from 350 K to 150 K. Next region below 150 K, the coexisting two surfaces are CoO2-terminated (001) and O2-terminated (110).

In Fig. 7, We plotted the excess surface Gibbs free energy Ωi of all studied surfaces under the typical operational conditions of SOFC (T = 1100 K, pO2 = 0.2 atm). The stability region displayed as hatched area lies between lines 2 (precipitation of La2O3) and 3 (precipitation of Co3O4). It is obvious that both LaO-terminated and CoO2-terminated (001) surfaces are stable in the stability region depending on the chemical potential deviation value of Cobalt, ΔμCo.


image file: c4ra12563k-f7.tif
Fig. 7 The variance of excess surface Gibbs free energies of all studied LaCoO3 surfaces along with chemical potential deviation of Cobalt ΔμCo (T = 1100 K, pO2 = 0.2 atm). The numbers in parentheses point to lines are the same as those in Fig. 6. Hatched area represents the stable region.

3.3 Surface stability of Sr-doped cubic LaCoO3 system

The calculations in Section 3.1.4 and 3.2 show that (001) of the LaCoO3 crystal is the most stable surface under the typical operational conditions of SOFC. Consequently, our following studies on the Sr-doped LaCoO3 system would only be focused on the LaO-terminated and CoO2-terminated (001) surface slabs, examining the influence of Sr-doping level on the stability of (001) surface slabs with two different terminations. The question needs to be answered instantly is that which LaO layer does the Sr-doping start with? Is it top-layer or central layer? It depends on the substitutional energies of Sr ion in different layers of the (001) surface slabs.
3.3.1 Sr substitutional energy. As mentioned above, the (2 × 2) 7-layer symmetrical models were used to estimate the Sr substitutional energies in different layers of the (001) surface slabs (Sr-doping level xs = 25%). Each (001) surface slab has two different Sr-doping configurations (LaO-terminated: 1,7- and 3,5-doping; CoO2-terminated: 2,6- and 4-doping), as illustrated in Fig. S4.

For our symmetrical models, the Sr substitutional energy is defined as follows.

image file: c4ra12563k-t11.tif

image file: c4ra12563k-t12.tif
where ESr,substitutional, Eperfect_slab, Edefective_slab, image file: c4ra12563k-t13.tif, ESrObulk and n are the Sr substitutional energy per Sr ion, total energies of surface slabs before and after Sr substitution, total energy of bulk La2O3 crystal per formula unit, total energy of bulk SrO crystal per formula unit, the number of La ions substituted by Sr ions in the surface slabs, respectively. The calculated Sr substitutional energies are presented in Table S6. Results suggest that Sr ions prefer to substitute the La ions in the outermost layers rather than those in the bulk layers for both LaO-terminated and CoO2-terminated (001) surface slabs. The difference between Sr substitutional energies of 1,7-doping and 3,5-doping LaO-terminated (001) surface slabs, e.g. Sr segregation energy, is 0.47 eV per Sr ion, which is close to the result of LaMnO3 (001) surface,8 0.54 eV per Sr ion.

Hence our following investigations would concentrate on the influence of Sr-doping in outermost layers on the thermodynamic stabilities of the (001) surface slabs with different terminations.

3.3.2 Phase diagrams of Sr-doped (001) surfaces. Based on the thermodynamics principles presented in Section 2.2, the phase diagram for 25% outermost-layer Sr-doped (001) surfaces of La0.875Sr0.125CoO3 system (Fig. S4(a) and (c)) was drawn in Fig. 8, here the chemical potential deviation of O atom ΔμO(T,P)was calculated under the typical operational conditions of SOFC (T = 1100 K, pO2 = 0.2 atm).
image file: c4ra12563k-f8.tif
Fig. 8 Phase diagram for outermost-layer Sr-doped (001) surfaces with different terminations (xs = 25%) of cubic La0.875Sr0.125CoO3 system (T = 1100 K, pO2 = 0.2 atm). The numbers in parentheses point to lines, where phase separations of metals and their oxides from bulk La0.875Sr0.125CoO3 begin to occur: (1) La, (2) Co, (3) Sr, (4) La2O3, (5) CoO, (6) Co3O4, (7) SrO, (8) LaCoO3, (9) SrCoO3. The hatched area among La2O3, Co3O4, LaCoO3 and SrCoO3 precipitation lines represents the stable region. Inset shows the magnified hatched area.

It can be seen from this phase diagram that the La0.875Sr0.125CoO3 material is stable only within small area, which means the variation ranges for both ΔμCo and ΔμLa are narrow. Under the SOFC operational conditions, the hatched area falls in the scope of La0.75Sr0.25O-terminated (001) surface completely, which suggests that the surface of stable La0.875Sr0.125CoO3 crystal is not CoO2-terminated but La0.75Sr0.25O-terminated. It's different from the conclusion of undoped LaCoO3 system. In other words, Sr-doping in LaCoO3 crystal destabilizes the CoO2-terminated surface with respect to the La0.75Sr0.25O-terminated surface.

In addition, (001) surface slabs with higher level of Sr-doping in the outermost-layer (50%, 75%, 100%, models are shown in Fig. S5) had also been examined to explore the influence of Sr segregation (Section 3.3.1) on the surface stability. All calculated phase diagrams are demonstrated in Fig. S6. When the Sr-doping level is 50%, the same conclusion as 25% Sr-doping is obtained (Fig. S6(a)). However, if the Sr-doping level reaches to 75% and above, as illustrated in Fig. S6(b) and (c), both the La0.75Sr0.25O-terminated and the CoO2-terminated (001) surface slabs become unstable, which probably results from the strong repulsion among the enriched Sr ions in the outermost LaSrO layers.

4. Conclusions

In this study, we investigated the atomic, electronic structures and the thermodynamic stability of LaCoO3 low-index surfaces using spin-polarized GGA + U calculations. Ferromagnetic nonstoichiometric symmetrical slab models were employed. Sr segregation on the outermost layers and the influence of Sr-doping on the thermodynamic stability of the surfaces were also examined. The main conclusions are as follows:

(1) Through bandgap scan of bulk LaCoO3 material, the Ueff used in GGA + U calculations was determined as 3.0 eV, which is very close to literature's data.

(2) Results of electron density difference and Bader charge analysis suggest the considerable covalency contribution of the Co–O bonds in both the bulk materials and the surface slabs. Covalency contribution increase of Co–O bonds in the CoO2-terminated (001) surface was observed upon the surface formation.

(3) In undoped LaCoO3 system, the thermodynamic phase diagram analysis demonstrates that CoO2- and LaO-terminated (001) surfaces are the most stable two of all considered surfaces under typical operational conditions of the solid oxide fuel cells (T = 1100 K, pO2 = 0.2 atm).

(4) Sr ions prefer to substitute La ions in the outermost layers rather than those in bulk layers for both (001) surfaces. Sr-doping destabilizes the CoO2-terminated surface with respect to the La0.75Sr0.25O-terminated surface.

These detailed results of La1−xSrxCoO3 surface properties at the atomistic level are of high importance for the further study of the oxygen reduction mechanism at the La1−xSrxCoO3 cathode.

Acknowledgements

We acknowledge the computational resources provided by the Center for Research Computing at the University of Notre Dame. Financial supports for this work were provided by the National Science Foundation-GAOLI Project under Contract no. CBET 09-67434, Shandong Provincial Natural Science Foundation (China, no. ZR2012BQ010) and the Scientific Research Foundation for the Returned Overseas Chinese Scholars (State Education Ministry of China). The authors are also greatly indebted to Prof. William F. Schneider and Mr Mike Penninger in University of Notre Dame for many stimulating discussions on the first principles calculations and the model construction.

Notes and references

  1. B. C. H. Steele and A. Heinzel, Nature, 2001, 414, 345 CrossRef CAS PubMed.
  2. C. Xia and M. Liu, Adv. Mater., 2002, 14, 521 CrossRef CAS.
  3. L. Wang, R. Merkle and J. Maier, J. Electrochem. Soc., 2010, 157, B1802 CrossRef CAS PubMed.
  4. W. Zhou, R. Ran and Z. Shao, J. Power Sources, 2009, 192, 231 CrossRef CAS PubMed.
  5. X. Lu, P. W. Faguy and M. Liu, J. Electrochem. Soc., 2002, 149, A1293 CrossRef CAS PubMed.
  6. E. A. Kotomin, Y. A. Mastrikov, E. Heifets and J. Maier, Phys. Chem. Chem. Phys., 2008, 10, 4644 RSC.
  7. Y. A. Mastrikov, R. Merkle, E. Heifets, E. A. Kotomin and J. Maier, J. Phys. Chem. C, 2010, 114, 3017 CAS.
  8. S. Piskunov, E. Heifets, T. Jacob, E. A. Kotomin, D. E. Ellis and E. Spohr, Phys. Rev. B: Condens. Matter Mater. Phys., 2008, 78, R121406 CrossRef.
  9. Y. Choi, M. C. Lin and M. Liu, Angew. Chem., Int. Ed., 2007, 46, 7214 CrossRef CAS PubMed.
  10. Y. Choi, M. E. Lynch, M. C. Lin and M. Liu, J. Phys. Chem. C, 2009, 113, 7290 CAS.
  11. K. Reuter and M. Scheffler, Phys. Rev. B: Condens. Matter Mater. Phys., 2001, 65, 035406 CrossRef.
  12. K. Johnston, M. R. Castell, A. T. Paxton and M. W. Finnis, Phys. Rev. B: Condens. Matter Mater. Phys., 2004, 70, 085415 CrossRef.
  13. E. Heifets, S. Piskunov, E. A. Kotomin, Y. F. Zhukovskii and D. E. Ellis, Phys. Rev. B: Condens. Matter Mater. Phys., 2007, 75, 115417 CrossRef.
  14. G. Ceder, G. Hautier, A. Jain and S. P. Ong, MRS Bull., 2011, 36, 185 CAS.
  15. K. Kang, Y. S. Meng, J. Bréger, C. P. Grey and G. Ceder, Science, 2006, 311, 977 CrossRef CAS PubMed.
  16. A. Rohrbach, J. Hafner and G. Kresse, Phys. Rev. B: Condens. Matter Mater. Phys., 2003, 15, 979 CrossRef CAS.
  17. J. Heyd, J. E. Peralta, G. E. Scuseria and R. L. Martin, J. Chem. Phys., 2005, 123, 174101 CrossRef PubMed.
  18. V. I. Anisimov, F. Aryasetiawan and A. I. Lichtenstein, Phys. Rev. B: Condens. Matter Mater. Phys., 1997, 9, 767 CrossRef CAS.
  19. V. I. Anisimov, J. Zaanen and O. K. Andersen, Phys. Rev. B: Condens. Matter Mater. Phys., 1991, 44, 943 CrossRef CAS.
  20. P. E. Blöchl, Phys. Rev. B: Condens. Matter Mater. Phys., 1994, 50, 17953 CrossRef.
  21. G. Kresse and J. Hafner, Phys. Rev. B: Condens. Matter Mater. Phys., 1993, 47, 558 CrossRef CAS.
  22. G. Kresse and J. Furthmüller, Phys. Rev. B: Condens. Matter Mater. Phys., 1996, 54, 11169 CrossRef CAS.
  23. J. P. Perdew and Y. Wang, Phys. Rev. B: Condens. Matter Mater. Phys., 1992, 45, 13244 CrossRef.
  24. J. P. Perdew, J. A. Chevary, S. H. Vosko, K. A. Jackson, M. R. Pederson, D. J. Singh and C. Fiolhais, Phys. Rev. B: Condens. Matter Mater. Phys., 1992, 46, 6671 CrossRef CAS.
  25. H. J. Monkhorst and J. D. Pack, Phys. Rev. B: Solid State, 1976, 13, 5188 CrossRef.
  26. A. I. Liechtenstein, V. I. Anisimov and J. Zaanen, Phys. Rev. B: Condens. Matter Mater. Phys., 1995, 52, R5467 CrossRef CAS.
  27. S. L. Dudarev, G. A. Botton, S. Y. Savrasov, C. J. Humphreys and A. P. Sutton, Phys. Rev. B: Condens. Matter Mater. Phys., 1998, 57, 1505 CrossRef CAS.
  28. Y.-L. Lee, J. Kleis, J. Rossmeisl and D. Morgan, Phys. Rev. B: Condens. Matter Mater. Phys., 2009, 80, 224101 CrossRef.
  29. C. Zobel, M. Kriener, D. Bruns, J. Baier, M. Gruninger, T. Lorenz, P. Reutler and A. Revcolevschi, Phys. Rev. B: Condens. Matter Mater. Phys., 2002, 66, R020402 CrossRef.
  30. M. C. Sanchez, G. Subias, J. Garcia and J. Blasco, Phys. Rev. Lett., 2003, 90, 045503 CrossRef CAS.
  31. J. B. Goodenough and P. M. Raccah, J. Appl. Phys., 1965, 36, 1031 CrossRef CAS PubMed.
  32. R. F. W. Bader, Atoms in Molecules – A Quantum Theory, Clarendon Press, Oxford, 1994 Search PubMed.
  33. G. Henkelman, A. Arnaldsson and H. Jónsson, Comput. Mater. Sci., 2006, 36, 354 CrossRef PubMed.
  34. http://theory.cm.utexas.edu/bader/.
  35. C. Noguera, Physics and Chemistry of Oxide Surfaces, Cambridge University Press, New York, 1996 Search PubMed.
  36. I. Batyrev, A. Alavi and M. W. Finnis, Faraday Discuss., 1999, 114, 33 RSC.
  37. F. Bottin, F. Finocchi and C. Noguera, Phys. Rev. B: Condens. Matter Mater. Phys., 2003, 68, 035418 CrossRef.
  38. M. W. Chase, NIST-JANAF Thermochemical Tables, American Chemical Society, Washington DC, 1998 Search PubMed.
  39. T. Arima, Y. Tokura and J. B. Torrance, Phys. Rev. B: Condens. Matter Mater. Phys., 1993, 48, 17006 CrossRef CAS.
  40. P. M. Raccah and J. B. Goodenough, Phys. Rev., 1967, 155, 932 CrossRef CAS.
  41. A. Taylor and R. W. Floyd, Acta Crystallogr., 1950, 3, 285 CrossRef CAS.
  42. J. J. Hanak and A. H. Daane, Acta Crystallogr., 1956, 9, 559 CrossRef.
  43. E. A. Sheldon and A. J. King, Acta Crystallogr., 1953, 6, 100 CrossRef CAS.
  44. X. Liu and C. T. Prewitt, Phys. Chem. Miner., 1990, 17, 168 CrossRef CAS.
  45. S. Sasaki, K. Fujino and Y. Takeuchi, Proc. Jpn. Acad., 1979, 55, 43 CrossRef CAS.
  46. P. Aldebert and J. P. Traverse, Mater. Res. Bull., 1979, 14, 303 CrossRef CAS.
  47. D. Taylor, Trans. Br. Ceram. Soc., 1984, 83, 5 Search PubMed.
  48. P. Bezdicka, A. Wattiaux, J. C. Grenier, M. Pouchard and P. Hagenmuller, Z. Anorg. Allg. Chem., 1993, 619, 7 CrossRef CAS.
  49. NIST Computational Chemistry Comparison and Benchmark Database, American Chemical Society, Washington DC, 14th edn, 2006 Search PubMed.
  50. G. Herzberg, Molecular Spectra and Molecular Structure: Volume I – Spectra of Diatomic Molecules, Krieger Publishing Company, Malabar, FL, 2nd edn, 1950 Search PubMed.
  51. Y. Choi, D. S. Mebane, M. C. Lin and M. Liu, Chem. Mater., 2007, 19, 1690 CrossRef CAS.
  52. Y. A. Mastrikov, E. Heifets, E. A. Kotomin and J. Maier, Surf. Sci., 2009, 603, 326 CrossRef CAS PubMed.
  53. S. Stølen, F. Grønvold, H. Brinks, T. Atake and H. Mori, J. Chem. Thermodyn., 1998, 30, 365 CrossRef.
  54. J. H. Cheng, A. Navrotsky, X. D. Zhou and H. U. Anderson, J. Mater. Res., 2005, 20(1), 191 CrossRef CAS.

Footnote

Electronic supplementary information (ESI) available. See DOI: 10.1039/c4ra12563k

This journal is © The Royal Society of Chemistry 2015