Graphene oxide wrapped hierarchical porous carbon–sulfur composite cathode with enhanced cycling and rate performance for lithium sulfur batteries†
Shuangke Liu*a,
Kai Xiea,
Yujie Lia,
Zhongxue Chenab,
Xiaobin Honga,
Liangjun Zhoua,
Junfei Yuana and
Chunman Zheng*a
aCollege of Aerospace Science and Engineering, National University of Defense Technology, Changsha, 410073, China. E-mail: liu_sk@139.com; zhengchunman@hotmail.com
bCollege of Chemistry and Chemical Engineering, Hunan University, Changsha, 410082, China
First published on 11th December 2014
Abstract
A graphene oxide sheet wrapped hierarchical porous carbon–sulfur (HPC–S@GO) composite was designed by a two-step method to improve the lithium sulfur battery performance. With this nanostructure design, the hierarchical porous carbon supplies an electronic transport pathway and provides a large pore volume to load the sulfur while the encapsulated graphene oxide sheet is effective in trapping sulfur and polysulfides during cycling. The obtained HPC–S@GO composite delivers prolonged cycling stability and an enhanced rate performance: the capacity fading is 0.12% per cycle over 400 cycles at 1 C (1672 mA g−1) rate, and the capacities at 0.2, 0.5, 1, 2 and 5 C rate are 1333.3, 896.9, 763.0, 669.5 and 505.6 mA h g−1, respectively.
1. Introduction
Rechargeable batteries with high energy density and low cost are expected to supply future portable electronic devices, electric vehicles and large-scale smart grids.1,2 In the past decade, lithium sulfur (Li–S) batteries have been paid intensive attention and are regarded as one of the most promising candidate power sources for the next generation of transportation, due to their high theoretical specific capacity (1672 mA h g−1) and energy density (2600 W h kg−1), which are several times higher than those of commercial lithium-ion batteries.3–6 In addition, the use of sulfur as a cathode material has the merits of natural abundance, environmentally benign and low cost.3–7 Regardless of these advantages, there remain some big challenges to be addressed for its practical application. First, sulfur suffers from insulating characteristics8 (σ = 5 × 10⁻³⁰ S cm−1 at 25 °C), which severely limits the sulfur utilization and its rate performance. Another problem is the dissolution and shuttling effect of the long chain lithium polysulfides (Li2Sn, 4 < n < 8) in liquid electrolytes, which results in loss of active material and low Coulombic efficiency.9,10 The third big problem is the large volume changes during cycling, which deteriorates the electrode structural stability and results in capacity decline.3–5To address these problems, various techniques have been explored especially encapsulating sulfur into various types of porous carbon are intensively studied,11–19 and regarded as one of the most effective way to enhance the electrochemical performance of Li–S battery. The porous structure of the carbon hosts could effectively contain sulfur; the porous carbon usually has a high specific surface area, which could supply efficient contact between sulfur and carbon for fast electron transport; a suitable pore size of the porous carbon may effectively suppress the diffusion of polysulfides, which is helpful to alleviate the capacity loss during cycling. According to previous reports, micropores or small pores (<3 nm) is beneficial to trap polysulfide and lead to improved stable cycling performance,13,20–22 but such microporous carbon structures only contain a low sulfur content (less than 50 wt%),20 which limits the energy density of the Li–S battery. Carbon hosts including more mesopores or macrospores could accommodate more sulfur and increase the battery energy density, but the sulfur in this structure will encounter obvious dissolution in DOL/DME electrolyte and shuttling effect, which will leads to large capacity loss during cycling. Hierarchical porous carbon with micro and mesopores thus may achieve both good cycling performance and favorable sulfur content if well combined with sulfur. For example, Guiyin Xu23 et al. reported that encapsulating sulfur into HPC derived from the soluble starch with a template of Mg(OH)2 with high sulfur loading (84%) still delivers relatively stable cycling performance up to 100 cycles. Another recent report by Meiri Wang et al.24 designed a hollow cagelike carbon host with hierarchical porous structure and shows a capacity of 1073 mA h g−1 after 100 cycles with high capacity retention of 94% when used as sulfur cathode.
Except encapsulating sulfur into porous carbon, wrapping graphene oxide or graphene on sulfur particles is also regarded as an effective way to improve their electronic conductivity and alleviate polysulphide dissolution thus to enhance the electrochemical performance of Li–S battery.25–30 Especially, the functional groups on graphene oxide is believed to be able to immobilize sulfur and lithium polysulfides. Significantly, Zhou et al.29 reported a facile method of coating graphene oxide on nanosulfur to fabricate sulfur/GO core–shell particles with 50 wt% sulfur loading, which shows superior cycling performance with a capacity of 800 mA h g−1 retained after 1000 cycle.
Herein, we designed a graphene oxide sheet wrapped hierarchical porous carbon–sulfur composite as cathode with prolonged cycling stability and enhanced rate performance. The obtained HPC–S@GO composite with a sulfur loading of 60 wt% delivers an initial discharge capacity of 986 mA h g−1 at 1 C with capacity fading rate of 0.12% per cycle up to 400 cycles, demonstrating largely improved cycling performance compared with graphene oxide-free HPC–S composite.
2. Experimental
2.1 Materials synthesis
![[thin space (1/6-em)]](https://www.rsc.org/images/entities/char_2009.gif) :
:![[thin space (1/6-em)]](https://www.rsc.org/images/entities/char_2009.gif) 1 mixture of concentrated H2SO4/H3PO4 (120
1 mixture of concentrated H2SO4/H3PO4 (120![[thin space (1/6-em)]](https://www.rsc.org/images/entities/char_2009.gif) :
:![[thin space (1/6-em)]](https://www.rsc.org/images/entities/char_2009.gif) 14 ml) was added to a mixture of graphite powders (1.0 g) and KMnO4 (6.0 g) under magnetic stirring. The reaction was then heated to 50 °C and stirred for 12 h. The reaction was cooled to room temperature and poured onto ice (140 ml), then 60 ml 30% H2O2 was poured to the mixture until it turns to gold yellow. After that, the yellow solution was centrifuged and washed in succession with 200 ml of water, 300 ml of 10% HCl, and 900 ml of ethanol to remove other ions. The solid obtained after centrifuged was vacuum-dried for 24 h at room temperature.
14 ml) was added to a mixture of graphite powders (1.0 g) and KMnO4 (6.0 g) under magnetic stirring. The reaction was then heated to 50 °C and stirred for 12 h. The reaction was cooled to room temperature and poured onto ice (140 ml), then 60 ml 30% H2O2 was poured to the mixture until it turns to gold yellow. After that, the yellow solution was centrifuged and washed in succession with 200 ml of water, 300 ml of 10% HCl, and 900 ml of ethanol to remove other ions. The solid obtained after centrifuged was vacuum-dried for 24 h at room temperature.2.2 Materials characterizations
The structure of HPC, HPC–S and HPC–S@GO materials were measured by XRD (SIEMENS D-500) using Cu Kα radiation, ranging from 10° to 60° at a step of 8° min−1. The micro morphologies of the composites were studied using field emission scanning electron microscopy (HITACHI S4800, Japan). The thermogravimetric analysis (TGA) was measured with a TGA-600 with a heating rate of 10° min−1 under N2 atmosphere to determine the sulfur content in the composite. The results indicate that the HPC–S and HPC–S@GO have sulfur loading of approximately 70% and 60%, respectively. The nitrogen adsorption–desorption analysis was done at 77.3 K on a Micromeritics TriStar II 3020 equipment.2.3 Electrochemical characterizations
Electrochemical experiments were performed using simulation cells. The working electrode was prepared by mixing 80 wt% HPC–S or HPC–S@GO with 10 wt% Super P and 10 wt% polyvinylidene fluoride (PVDF) binder using N-methyl-pyrrolidone (NMP) as the solvent. After mixing well, the slurry was pasted on Al foil and dried overnight at 60 °C in a vacuum oven. The specific capacity was calculated based on the mass of the sulfur in the composite. The sulfur loading in the electrode is 0.6 mg cm−2. The metallic lithium foils and 1 M LiTFSI in a mixed solvent of 1,3-dioxolane (DOL) and dimethyl ether (DME) (1![[thin space (1/6-em)]](https://www.rsc.org/images/entities/char_2009.gif) :
:![[thin space (1/6-em)]](https://www.rsc.org/images/entities/char_2009.gif) 1 by volume) were used as the counter electrode and electrolyte, respectively, and Celgard 2400 was the separator. Galvanostatic charge–discharge measurements were performed using a battery tester (LAND CT-2001A, Wuhan, China) at room temperature in a potential range of 1.5–3.0 V (vs. Li+/Li) at various current densities. Cyclic voltammetry (1.5–3.0 V, 0.1 mV s−1) was performed with an electrochemical workstation (CHI 660 C). Electrochemical Impedance (EIS) analyses were conducted on both battery cells from 100 kHz to 100 mHz.
1 by volume) were used as the counter electrode and electrolyte, respectively, and Celgard 2400 was the separator. Galvanostatic charge–discharge measurements were performed using a battery tester (LAND CT-2001A, Wuhan, China) at room temperature in a potential range of 1.5–3.0 V (vs. Li+/Li) at various current densities. Cyclic voltammetry (1.5–3.0 V, 0.1 mV s−1) was performed with an electrochemical workstation (CHI 660 C). Electrochemical Impedance (EIS) analyses were conducted on both battery cells from 100 kHz to 100 mHz.
3. Results and discussions
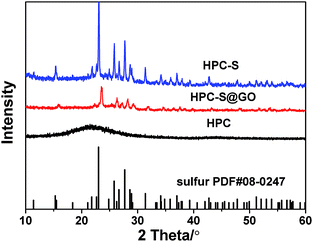
Fig. 1 shows the preparation process of the HPC–S and HPC–S@GO structures. The hierarchical porous carbon was prepared by a SiO2 template method, after high temperature carbonization and etching the SiO2 nanoparticles, the sulfur was melt-infused into the porous carbon to obtain the HPC–S. The majority of sulfur was encapsulated in the mesopores with large pore volume, other are distributed on the surface of the HPC. The graphene oxide sheets were then coated on the surface of the HPC–S by an aqueous solution process via electrostatic interaction and surface tension to obtain the HPC–S@GO composite. With this nanostructure design, the hierarchical porous carbon could effectively accommodate enough sulfur and supply efficient electronic transport pathway while the wrapped thin graphene oxide sheet could effectively mitigate polysulphide dissolution through its functional group and improve electronic conductivity.X-ray diffraction patterns of HPC, HPC–S and HPC–S@GO materials are show in Fig. 2. The HPC shows a broadened diffraction peak at 22°, suggesting amorphous nature of the HPC. The HPC–S and HPC–S@GO composites exhibit the diffraction peaks of the orthorhombic sulfur phase (JCPDS no. 08-0247), indicating a crystallized form of sulfur in the composites. However, the HPC–S@GO composite shows slightly reduced intensity of the diffraction peaks compared with that of the HPC–S composite, indicating the coating effect of the graphene oxide on the HPC–S particles.
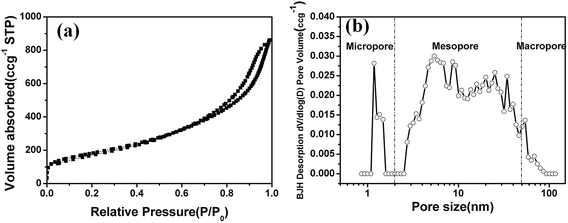
The Brunauer–Emmett–Teller (BET) surface area and pore structure of the HPC was measured by nitrogen adsorption–desorption isotherm, the pore size distribution was calculated by Original Density Functional Theory model. The HPC has a BET surface area of 638.7 m2 g−1 with a total pore volume of 0.911 m3 g−1. Fig. 3a shows the typical N2 adsorption–desorption isotherm of the HPC, exhibiting type IV according to IUPAC classification. It also indicates the coexistence of multiple pore sizes ranging from micropores to macropores. Fig. 2b shows the pore-size distribution curves of the HPC. It is obviously that the majority pores are of 3–100 nm and the other are micropores with diameter around 1.2 nm, showing the hierarchical pore characteristics. To estimate the intrinsic micro/meso/macro pore volume, the cumulative volume is plotted with increasing pore diameter of the HPC (see Fig. S1 in ESI†), the micro/meso/macro pore volume are 0.0715, 0.8094 and 0.0232 cm3 g−1, indicating the pore volume comprised mostly of mesopores in the HPC. The micropores are generated by the decomposition of the resin and the meso- and macro-pores are likely associated with the etching of nano SiO2 particles as well as the interspaces among the carbon particles.
To investigate the morphology of the products and the distribution of the elements, field-emission scanning electron microscope (FESEM) and element mapping images were measured for HPC, HPC–S, and the HPC–S@GO composites at different magnifications, respectively (Fig. 4). The images of the HPC (Fig. 4a and b) reveal that the HPC has irregular spherical shape with diameter ranging from 50 nm to 200 nm, the particles are connected with each other with lots of nano-pores on the surface, which is also indicated by pore distribution measurement results. Fig. 4c and d show that after encapsulated with sulfur, the surface of the composite became smooth and no nano-pores can be observed, indicating the sulfur infused into the hierarchical nano-pores due to the strong adsorption effects. In addition, no agglomerated sulfur particles are found on the surface of the HPC, showing the sulfur is homogeneously confined inside the pores or dispersed on the surface of the HPC. The HPC–S composite was further treated by wrapping graphene oxide sheets on the surface of the HPC–S particles through an aqueous solution self-assembly process via electrostatic interaction effect. Fig. 4e and f reveal that, thin graphene oxide sheets with wrinkles are well wrapped on the surface of the HPC–S particles, the functional groups on the coated graphene oxide is believed to confine polysulfide from dissolution. By encapsulating the sulfur into hierarchical porous carbon and coating graphene oxide on HPC–S particles, it is expected to both supply efficient contact between sulfur and carbon for fast electron transport and limit polysulfide dissolution. To further measure the distribution of sulfur in the HPC–S@GO composite, SEM element mapping analysis was performed as shown in Fig. 3g. In the selected region, the carbon and sulfur elemental maps prove that sulfur exist in this region and distributed uniformly in the carbon matrix.
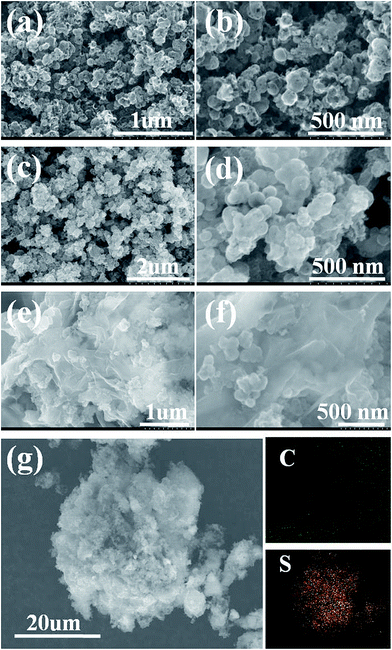 | ||
| Fig. 4 SEM images of (a and b) HPC, (c and d) HPC–S and (e and f) HPC–S@GO at different magnifications; (g) SEM image and elemental X-ray mapping of HPC–S@GO composite. | ||
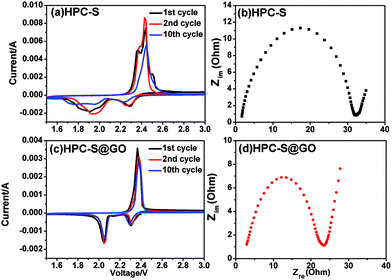
In order to compare the electrochemical properties between the HPC–S and HPC–S@GO composite, a series of electrochemical measurements were carried out. Cyclic voltammetry (CV) was used to reveal the electrochemical reaction mechanism of the cathode materials between 1.5 and 3.0 V at a sweep rate of 0.1 mV s−1. The CV curves of the HPC–S and HPC–S@GO composite electrodes for the 1st, 2nd and 10th cycle are presented in Fig. 5a and c. As seen in Fig. 5a, the CV curves of HPC–S composite show two reduction peaks at 2.3 V and 1.9 V, which correspond to the reduction of sulfur to long-chain polysulfides (Li2Sx, 4 < x < 8),9,33 and long-chain polysulphides to short-chain polysulphides (Li2Sx, 2 ≤ x ≤ 4),34 respectively. In the anodic oxidation process, two peaks at 2.35 and 2.45 V were observed, which can be attributed to the transformation of lithium sulfides to polysulphides and sulfur. The HPC–S@GO composite electrode has two reduction peaks at 2.3 and 2.05 V as the HPC–S composite, but only one oxidation peak at 2.36 V is observed, which is associated to the coupled conversion from lithium sulfide to lithium polysulfides and sulfur.35 Besides, the HPC–S@GO composite shows a slightly lower reduction potential and a slightly higher oxidation potential, indicating lower polarization and inner resistance compared with HPC–S composite. Especially, no remarkable changes of shape and position of the curves are observed for the anodic/cathodic peaks in the 1st, 2nd and 10th cycle for the HPC–S@GO composite, while obvious shifts of CV peaks can be seen in the 1st, 2nd and 10th cycle for the HPC–S composite. This indicates the coating of graphene oxide on HPC–S can effectively limit the polysulphides dissolution and shuttling effect thus to enhance the reversible electrochemical stability of the composite. Electrochemical impedance spectroscopy (EIS) measurements of the two samples were performed on freshly prepared cells, as shown in Fig. 5b and d. The semicircles in the medium-frequency region are related to the charge-transfer resistance (Rct), which represents the kinetic resistance of the electrochemical reaction at the electrode/electrolyte interface.29 Compared with the HPC–S electrode, the HPC–S@GO electrode shows a slightly lower Rct, which is in good agreement with the CV measurement. This could be attributed to the improved electrical conduction by coating graphene oxide on the HPC–S particles and reducing the sulfur content in the composite. Furthermore, EIS of the HPC–S@GO electrode before and after 50, 100 cycles were also measured (Fig. S2†), after 100 cycles, the semicircles only slightly increase than that of after 50 cycles, indicating the good stability of HPC–S@GO composite during long cycling process.
The electrochemical performance of the HPC–S and HPC–S@GO composite was further conducted to make a comparison. Typical charge–discharge profiles at different C rates are show in Fig. 6a within a voltage window of 1.5–3.0 V. The discharge profiles of the HPC–S@GO composite cell display typical two-plateau process at different C rates, while the charge profiles of the cell show two plateau at low C rates (0.2 C, 0.5 C) and only one plateau at high C rates (1 C, 2 C, 5 C). This may be associated to the large polarization that leads to the coupled conversion from lithium sulfide to lithium polysulfides and sulfur at higher current density, as explained above. The HPC–S@GO composite electrode delivers a high initial discharge capacity of 1333.3 mA h g−1 at 0.2 C rate, which is 79.7% of the theoretical value for elemental sulfur. When the C rates rise to 0.5, 1, 2 and 5 C, the electrode delivers capacities of 896.9, 763.0, 669.5 and 505.6 mA h g−1, respectively. In comparison, the HPC–S composite electrode shows lower charge–discharge capacities at the same C rates, with discharge capacities of 1055.1, 668.3, 557.7, 459.1 and 334.4 mA h g−1 at 0.2, 0.5, 1, 2 and 5 C, respectively. By coating graphene oxide on the HPC–S particles and reducing the sulfur content to 60 wt% from 70 wt% in the composite, the polarization and inner resistance of the cell can be reduced effectively, leading to higher capacities and better rate performance.
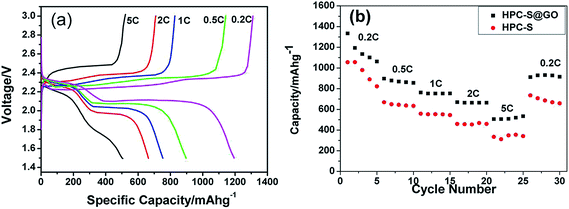 | ||
| Fig. 6 (a) charge–discharge profiles of the HPC–S@GO composite electrode; (b) discharge capacities of HPC–S and HPC–S@GO composite at different C rates. | ||
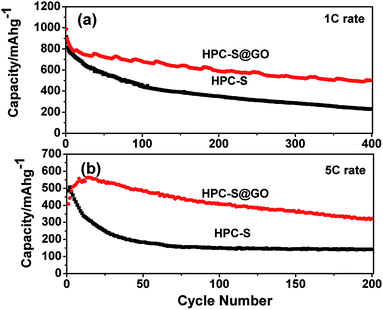
In order to evaluate the long cycling stability of the electrodes, the endurance test of HPC–S and HPC–S@GO composite was carried out at 1 C and 5 C rates (Fig. 7). At 1 C rate, the HPC–S@GO composite delivers a high initial discharge capacity of 986.7 mA h g−1, after the 5th cycle, the composite achieves a discharge capacity of 834 mA h g−1. After the rapid capacity loss for the first several cycles, the cell shows very slow capacity fade, it delivers capacities of 680.3 mA h g−1 for the 100th cycles, 587.3 mA h g−1 for the 200th cycles, and 499.8 mA h g−1 for the 400th cycles, corresponding to a small capacity decay of about 0.12% per cycle. In comparison, the HPC–S composite exhibits capacities of 911.7 mA h g−1 for the 1st cycle and 772.1 mA h g−1 for the 5th cycle, it delivers a capacity of only 229.3 mA h g−1 for the 400th cycles, showing much poorer cycling stability than that of HPC–S@GO composite. At 5 C rate, the capacity of the HPC–S@GO composite is 407.7 mA h g−1, then it slowly increases to 563.7 mA h g−1 at the 14th cycles, due to the gradual activation process caused by GO wrapping on the HPC–S particles, which is also observed in previous report.28 After 200 cycles, the HPC–S@GO composite shows a discharge capacity of 321.5 mA h g−1, corresponding to a capacity retention of 57%. In comparison, the HPC–S composite delivers discharge capacities of 485 mA h g−1 for the initial cycle and only 141.6 mA h g−1 for the 200 cycles. As a result, the electrodes employing GO wrapped HPC–S composite exhibit much better cycling stability. Fig. S3† shows the cycling performance of the HPC–S@GO composite electrodes with different sulfur loadings of 0.6 and 1.2 mg cm−2 at 1 C rate. The higher sulfur loading of 1.2 mg cm−2 HPC–S@GO cathode delivers a slightly lower discharge capacity of 667.7 mA h g−1 up to 100th cycles, compared with 680.3 mA h g−1 for the 0.6 mg cm−2 sulfur loading. Similarly, higher sulfur loading electrode also delivers a very slow capacity decay of 0.518 mA h g−1 per cycle after the initial 10 cycles. This indicates the HPC–S@GO composite electrode could still keep enhanced cycling performance with the increase of sulfur loading. The enhanced cyclability of the HPC–S@GO cathode may be attributed to the combination of the hierarchical porous carbon with large pore volume and the coating layer of graphene oxide. The HPC has sufficient mesopores to accommodate sulfur and supply efficient electronic transport pathway for electrochemical reaction, the graphene oxide sheets are tightly wrapped on the surface of the HPC–S particles, providing physical barrier for sulfur dissolution into the electrolyte, furthermore, the oxygen function groups on the graphene oxide will interact with sulfur or polysulphides to suppress the shuttling effect.
4. Conclusions
In summary, we prepared a hierarchical porous carbon with high specific area and large pore volume, and designed a graphene oxide-wrapped HPC–S composite as sulfur cathode via a simple solution process. The obtained HPC–S@GO composite shows prolonged cycling stability with a capacity fading rate of 0.12% per cycle over 400 cycles at 1 C rate, and enhanced rate performance with capacities of 896.9, 763.0, 669.5 and 505.6 mA h g−1 at 0.5, 1, 2 and 5 C respectively. This enhanced cycling and rate performance arise from combination of the hierarchical porous carbon and graphene oxide coatings, which supply efficient electronic transport pathway and effectively confine polysulfides within the cathode.Acknowledgements
The authors acknowledge the Aid program for Science and Technology Innovative Research Team in Higher Education Institutions for Hunan Province.References
- A. S. Arico, P. Bruce, B. Scrosati, J. M. Tarascon and W. V. Schalkwijk, Nat. Mater., 2004, 4, 366–377 CrossRef PubMed.
- M. S. Whittingham, Chem. Rev., 2004, 104, 4271–4302 CrossRef CAS.
- Y. Yang, G. Y. Zheng and Y. Cui, Chem. Soc. Rev., 2013, 42, 3018–3032 RSC.
- P. G. Bruce, S. A. Freunberger, L. J. Hardwick and J.-M. Tarascon, Nat. Mater., 2012, 11, 19–29 CrossRef CAS PubMed.
- X. Ji and L. F. Nazar, J. Mater. Chem., 2010, 20, 9821–9826 RSC.
- X. Ji, S. Evers, R. Black and L. F. Nazar, Nat. Commun., 2011, 2, 325 CrossRef PubMed.
- R. D. Rauh, K. M. Abraham, G. F. Pearson, J. K. Surprenant and S. B. Brummer, J. Electrochem. Soc., 1979, 126, 523–527 CrossRef CAS PubMed.
- J. A. Dean, Lange's Handbook of Chemistry, McGraw-Hill, New York, 3rd edn, 1985, pp. 3–5 Search PubMed.
- S. E. Cheon, K. S. Ko, J. H. Cho, S. W. Kim, E. Y. Chin and H. T. Kim, J. Electrochem. Soc., 2003, 150, A796 CrossRef CAS PubMed.
- Y. V. Mikhaylik and J. R. Akridge, J. Electrochem. Soc., 2004, 151, A1969–A1976 CrossRef CAS PubMed.
- X. Ji, K. T. Lee and L. F. Nazar, Nat. Mater., 2009, 8, 500–506 CrossRef CAS PubMed.
- X. L. Li, Y. L. Cao, W. Qi, L. V. Saraf, J. Xiao, Z. M. Nie, J. Mietek, J. G. Zhang, B. Schwenzer and J. Liu, J. Mater. Chem., 2011, 21, 16603–16610 RSC.
- B. Zhang, X. Qin, G. R. Li and X. P. Gao, Energy Environ. Sci., 2010, 3, 1531–1537 CAS.
- B. Ding, C. Z. Yuan, L. F. Shen, G. Y. Xu, P. Nie and X. G. Zhang, Chem.–Eur. J., 2013, 19, 1013–1019 CrossRef CAS PubMed.
- T. Xu, J. X. Song, M. L. Gordin, H. Sohn, Z. X. Yu, S. R. Chen and D. H. Wang, ACS Appl. Mater. Interfaces, 2013, 5, 11355–11362 CAS.
- K. Zhang, Q. Zhao, Z. L. Tao and J. Chen, Nano Res., 2013, 6(1), 38–46 CrossRef CAS.
- G. He, S. Evers, X. Liang, M. Cuisinier, A. Garsuch and L. F. Nazar, ACS Nano, 2013, 7(12), 10920–10930 CrossRef CAS PubMed.
- J. Wang, S. Y. Chew, Z. W. Zhao, S. Ashraf, D. Wexler, J. Chen, S. H. Ng, S. L. Chou and H. K. Liu, Carbon, 2008, 46, 229–235 CrossRef CAS PubMed.
- Z. W. Zhang, Z. Q. Li, F. B. Hao, X. K. Wang, Q. Li, Y. X. Qi, R. H. Fan and L. W. Yin, Adv. Funct. Mater., 2014, 24, 2500–2509 CrossRef CAS.
- S. Xin, L. Gu, N. H. Zhao, Y. X. Yin, L. J. Zhou, Y. G. Guo and L. J. Wan, J. Am. Chem. Soc., 2012, 134, 18510–18513 CrossRef CAS PubMed.
- D. W. Wang, G. Zhou, F. Li, Kf. H. Wu, G. Q. M. Lu, H. M. Cheng and I. R. Gentle, Phys. Chem. Chem. Phys., 2012, 14, 8703–8710 RSC.
- Z. Li, Y. Jiang, L. X. Yuan, Z. Q. Yi, C. Wu, Y. Liu, P. Strasser and Y. H. Huang, ACS Nano, 2014, 8(9), 9295–9303 CrossRef CAS PubMed.
- G. Y. Xu, B. Ding, P. Nie, L. F. Shen, H. Dou and X. G. Zhang, ACS Appl. Mater. Interfaces, 2014, 6, 194–199 CAS.
- M. R. Wang, Y. N. Zhang, H. Z. Zhang and H. M. Zhang, ChemPlusChem, 2014, 79, 919–924 CrossRef CAS.
- H. Wang, Y. Yang, Y. Liang, J. T. Robinson, Y. Li, A. Jackson, Y. Cui and H. Dai, Nano Lett., 2011, 11, 2644–2647 CrossRef CAS PubMed.
- N. Li, M. Zheng, H. Lu, Z. Hu, C. Shen, X. Chang, G. Ji, J. Cao and Y. Shi, Chem. Commun., 2012, 48, 4106–4108 RSC.
- F. F. Zhang, X. B. Zhang, Y. H. Dong and L. M. Wang, J. Mater. Chem., 2012, 22, 11452–11454 RSC.
- M. Xiao, M. Huang, S. S. Zeng, D. M. Han, S. J. Wang, L. Y. Sun and Y. Z. Meng, RSC Adv., 2013, 3, 4914–4916 RSC.
- J. P. Rong, M. Y. Ge, X. Fang and C. W. Zhou, Nano Lett., 2014, 14, 473–479 CrossRef CAS PubMed.
- G. He, C. J. Hart, X. Liang, A. Garsuch and L. F. Nazar, ACS Appl. Mater. Interfaces, 2014, 6(14), 10917–10923 CAS.
- D. C. Marcano, D. V. Kosynkin, J. M. Berlin, A. Sinitskii, Z. Z. Sun, A. Slesarev, L. B. Alemany, W. Lu and J. M. Tour, ACS Nano, 2010, 4, 4806 CrossRef CAS PubMed.
- A. B. Fuertes, P. Valle-Vigón and M. Sevilla, Chem. Commun., 2012, 48, 6124–6126 RSC.
- L. Xiao, Y. Cao, J. Xiao, B. Schwenzer, M. H. Engelhard, L. V. Saraf, Z. Nie, G. J. Exarhos and J. Liu, Adv. Mater., 2012, 24, 1176 CrossRef CAS PubMed.
- G. Zhou, D. W. Wang, F. Li, P. X. Hou, L. Yin, C. Liu, G. Q. Lu, I. R. Gentle and H. M. Cheng, Energy Environ. Sci., 2012, 5, 8901 CAS.
- H. P. Peng, J. Q. Huang, M. Q. Zhao, Q. Zhang, X. B. Cheng, X. Y. Liu, W. Z. Qian and F. Wei, Adv. Funct. Mater., 2014, 24(19), 2772–2781 CrossRef CAS.
Footnote |
| † Electronic supplementary information (ESI) available. See DOI: 10.1039/c4ra12393j |
| This journal is © The Royal Society of Chemistry 2015 |


