
Rapid scavenging of methylene blue dye from a liquid phase by adsorption on alumina nanoparticles
Sushmita Banerjeea,
Ravindra Kumar Gautama,
Amita Jaiswala,
Mahesh Chandra Chattopadhyayaa and
Yogesh Chandra Sharma*b
aDepartment of Chemistry, University of Allahabad, Allahabad – 211002, India
bDepartment of Chemistry, Indian Institute of Technology, Banaras Hindu University, Varanasi – 221005, India. E-mail: ysharma.apc@iitbhu.ac.in; sushmita.bnerjee@gmail.com
First published on 15th January 2015
Abstract
The adsorption behavior of methylene blue on as-synthesized alumina nanoparticles has been investigated. The adsorbent was characterized by Fourier transform infrared spectroscopy (FTIR), TG/DTA/DTG, X-ray diffractrometry and scanning electron microscopy. N2 adsorption–desorption measurements were carried out to analyze the porous structure and surface area of the adsorbent and results revealed that the adsorbent is mesoporous with a specific surface area of 76 m2 g−1. Batch experiments indicated that solution pH, initial dye concentration, contact time, temperature and the presence of ions had prominent impact on the dye removal process. The sorption kinetic data were found to be in accordance with pseudo-second order kinetics. The mechanistic interaction of the adsorbate–adsorbent system was also interpreted with the help of Weber–Morris model and the Boyd model and it was found that the adsorption process is controlled by a film diffusion mechanism. The investigation of adsorption isotherms suggested that the data fitted Langmuir isotherm model. The values the thermodynamic parameters for the process of removal were determined and the negative values change in free energy, ΔG0, indicated the spontaneous nature of the sorption process. A high desorption efficiency of 90.11% indicated a possible regeneration of the adsorbent. The adsorbent displayed almost the same adsorption capacity even after three cycles of regeneration bringing down the cost of treatment.
1. Introduction
In recent years nanoscience and nanotechnology have gained significant impetus. The emerging world of nanotechnology offers immense opportunities towards remediation of environmental problems.1 In this series, treatment of wastewater using different nano materials has attracted attention of scientific workers. The concept of nanotechnology relies upon the control of matter on the nanometer scale, having critical dimensions of 1 to 100 nm. The most fascinating feature is its high ‘surface area to volume’ ratio. The materials thus obtained on the nanoscale possess a proportionately higher surface area than their larger counterparts. Therefore, synthesis of nanoscale based materials has emerged as a breakthrough in the field of wastewater treatment. Various attempts have been made by researchers to synthesise and use nanosized materials (nano-adsorbents) purposely for the removal of water pollutants through adsorption. Varieties of nano adsorbents were synthesized and their performances for the removal of organic as well as inorganic water pollutants were extensively studied and reported by various workers.2–5 Out of several nanoadsorbents reported, nano sized alumina is one of the important materials. Alumina is known to have spinel structure and exists in a variety of metastable structures including γ (cubic spinel), δ (tetragonal), θ (monoclinic), η (cubic spinel), κ (orthorhombic), χ (cubic spinel), and β (hexagonal).6 Out of several forms, γ alumina is highly reported due to its widespread applications as an electrical insulator, heat resistant material, catalytic activity, microelectronic, membrane application, etc.7,8 It has been reported that spinel structure of γ alumina exhibits intriguing property as the material behaves like “sponge” in which water molecules decomposed and reconstituted in reactive ways.9 Thus, the spinel structure of γ alumina comprises of numerous reactive sites that may easily interact with chemical species. This unique surface feature of γ alumina makes it an efficient adsorbent material for its use in water or wastewater treatment. The use of γ alumina nanoparticles in water treatment has been documented by numerous researchers. Sharma et al.10 and Srivastava et al.11 investigated the potential of γ alumina nanoparticles for Ni(II) adsorption from aqueous solutions. Bhatnagar et al.12 have reported nitrate adsorption using this as an adsorbent. Rahmani et al.8 have examined the adsorption competence of this adsorbent material for various heavy metals and Renuka et al.13 employed this adsorbent for the removal of anionic dye, congo red from aqueous solutions. Sumptuous literature survey on nanosized alumina revealed that despite having unique property viz. thermal stability, large surface area and remarkable adsorption capacity, its application as an adsorbent material is still scantily reported. The present study has been targeted on the evaluation of decolorizing efficiency of the adsorbent using cationic dye, methylene blue. Methylene blue is one of the extensively used coloring agent which exhibited several detrimental effects on human beings like diarrhea, nausea, vomiting, and breathlessness.14 Its frequent detection in the wastewater streams triggered concern for its elimination from the source streams. A careful literature survey revealed that so far no study has been reported on the application of alumina nanoparticles for the removal of methylene blue from aqueous solutions. The effect of parameters on the removal of methylene blue by alumina nanoparticles has been discussed. Isotherm studies, equilibrium and sorption dynamics for the removal of methylene blue have also reported.2. Materials and methods
2.1 Adsorbate
Analytical grade chemicals and reagents were used as such without any further purification during the experiments. Methylene blue [3,7-bis(dimethylamino)-phenazathionium chloride tetramethylthionine chloride, C.I. number, 52015] was purchased from British Drug House, Poole, England. It is a thiazine class water soluble dye (50 g L−1 at 20 °C) with a molecular weight of 319.86 g mol−1. Stock solution of the dye was prepared by dissolving 3.1 × 10⁻³ M of dye in 1000 mL of double distilled water. The standard solutions of various concentrations (3.1 × 10⁻⁵ M to 6.2 × 10⁻⁴ M) were prepared by diluting the stock solution with double distilled water. The solution pH was maintained by using 0.1 M HCl or 0.1 M NaOH and the measurements were taken on a pH meter (pH meter 335, Systronics, Ahmedabad, India). The determination of residual dye concentration was done spectrophotometrically using UV/vis spectrophotometer (Model-2203 Systronics, Ahmadabad, India) at λmax of 665 nm. The quantification of dye adsorption was examined graphically by plotting a calibration curve between absorbance and concentration of standard solutions of dye (1.5 × 10⁻⁵ to 7.8 × 10⁻⁵ M) at a specific pH of 8.0.2.2 Synthesis of adsorbent
Alumina nanoparticles of γ phase, the adsorbent material was synthesized using controlled precipitation technique as per procedure reported by Parida et al.15 The essential ingredients required for the synthesis of alumina nanoparticles were aluminum nitrate Al (NO3)3·9H2O (Alfa Aesar), sodium carbonate (Merck), double distilled water and 0.1 M HNO3 or 0.1 M NaOH for pH adjustment. The preparation of precursor of 0.066 M was carried out by dissolving appropriately weighed 25.0 g of aluminum nitrate in 600 mL of double distilled water. The precipitating agent was prepared by dissolving 13.24 g of sodium carbonate in 600 mL of double distilled water. Arrangement was made in such a way that both the precursor and the precipitating solutions were allowed to fall slowly drop by drop from the two separate burettes into the beaker of 2.0 L capacity containing 400 mL of double distilled water and the solutions were blended homogenously under continuous magnetic stirring. The temperature of the precipitation reaction was maintained at 70 °C and pH of the reaction was maintained between 7.5–8.5 by the addition of HNO3 or NaOH. The obtained precipitate was kept for aging at 80 °C for 2 h, filtered and washed several times with hot double distilled water followed by washing with ethanol and acetone simultaneously. The resultant product was then kept in oven for 2 h for drying. The dried material was calcined in a muffle furnace at 600 °C for 3 h in presence of air with a heating rate of 5 °C min−1. The solid white dried material was ground into smooth textured powder to obtain alumina (Al2O3) of desired γ phase which was used as adsorbent in the experiments. The yield of the as prepared alumina nanoparticles was found to be 89%.2.3 Characterization of the adsorbent
Fourier transform infrared spectra were collected using spectrophotometer (FTLA-2000, ABB; Canada). The sample preparation was required before measurement for which sample was intimately mixed with KBr and pressed into pellet by applying an optimum pressure of 9 Ton using 15 Ton hydraulic pellet press (Kimaya Engineeres, Thane). Measurements were taken in the wavelength range from 400 cm−1 to 4000 cm−1 with resolution of 4 cm−1. TG/DTA was performed in a Simultaneous Thermal Analysis System, EXSTAR TG/DTA 6300. 10 mg of sample was used in analysis. The sample was heatedat a scanning rate of 10 °C min−1 under dynamic N2 flow of 200 mL min−1 in temperature range from 35 °C to 1000 °C. The X-ray diffraction pattern of the adsorbent has been recorded by X-ray diffractometer (Rigaku D/max – 2200 PC) operated at 40 kV/20 mA using CuKα radiation with wavelength of 1.54 Å with a scanning rate of 1° min−1. The surface features of the adsorbent were examined by scanning electron microscope (ZEISS, EVO 50, UK) at an accelerating electron voltage of 15.0 kV using gold sputtering prior to analysis. Surface area of the adsorbent was determined by BET method using surface area analyzer (ASAP 2020, Micromeritics, USA).2.4 Point of zero charge (pHZPC)
The pHZPC of the adsorbent was determined in order to ascertain its surface behavior at variable pH conditions and adsorbate–adsorbent interaction as a function of pH. The measurement of pHZPC was performed on the basis of solid addition method.16 A series of 50 mL of 0.1 N KNO3 placed in Stoppard Erlenmeyer flasks. The initial pH of the 0.1 N KNO3 solutions required to be adjusted to a value of pH 2.0 to pH 12.0 by using pH buffers (buffers were used intentionally instead of 0.1 N HCl or 0.1 N NaOH as after addition of adsorbent material into the flasks containing solutions with different pH values may alter the pH and this alteration can be eliminated by use of concerned pH buffers). The adsorbent dose of 0.5 g was added into each flask and kept for agitation up to 30 min. The final pH of the resultant solution was measured. The results were plotted in graphical form of ‘initial pH vs. final pH’ and a point of intersection of the two graphs was expressed as “pHZPC” of the adsorbent.2.5 Adsorption Experiments
The effect of process variables such as pH, initial dye concentration, contact time and effect of coexisting ions that play important role in the adsorptive removal of methylene blue from aqueous solutions were experimentally investigated. In all experiments, 100 mL of methylene blue with a concentration of 1.5 × 10⁻⁴ M was taken in 250 mL closed Erlenmeyer flasks containing 1.0 g of adsorbent and agitated on a temperature controlled water bath shaker (Macro Scientific Works Pvt. Ltd., MSW 275, Delhi, India) at constant shaking speed of 240 rpm for 60 min to ensure equilibrium. The resultant solution taken at periodic intervals of 5 min were then centrifuged (REMI R-8C BC, New Delhi, India) for 10 min at 5000 rpm to separate solid from the liquid phase. The pH of the solution was adjusted using 0.1 M HCl/0.1 M NaOH. Effect of various experimental parameters such as pH (2.0–10.0), temperature (298, 303, 313 and 323) K, initial dye concentration (3.1 × 10⁻⁵ to 6.2 × 10⁻⁴ M) and contact time on the removal of dye were examined. The determination of residual dye concentration was carried out by using UV-vis double beam spectrophotometer (Systronics 2203; Ahmadabad, India) at 664 nm. A profile of absorbance against each standard solution was plotted and this plot was used to determine residual dye concentrations.The removal percentage of methylene blue was calculated using the relationship described as:
| Dye removal (%) = {(C0–Ce)/C0} × 100 | (1) |
| qe (mg g−1) = (C0 − Ce) × V/M | (2) |
Kinetic experiments were performed by analyzing residual dye concentration of different initial concentrations at constant pH, temperature, adsorbent dose and for the purpose; samples were withdrawn at a regular time interval of 5 min up to equilibrium period. The experiments for adsorption isotherms were carried out using various initial dye concentrations at different temperature keeping pH, temperature and sorbent dose constant and agitated till the attainment of equilibrium.
Two blank experiment runs, one by using 1.5 × 10⁻⁴ M dye solution without adsorbent to ensure that no dye was adsorbed onto the glass flasks and another one with adsorbent and water only to check that no leaching occurred, that may interfere with the measurement of dye concentrations on spectrophotometer were carried out. All experiments were performed three times and the mean values were used for evaluation purpose.
2.6 Desorption study
For desorption experiments, 1.0 g of spent adsorbent was isolated from the dye solution with initial dye concentration of 1.56 × 10⁻⁴ M. The collected spent material was oven dried for 3 h at 50 °C and was then added in 100 mL of double distilled water. The resultant suspension was sonicated at ultrasonic frequency of 40 ± 3 KHz for 50 min at 323 K using Digital Ultrasonic Cleaner (Model LMUC-2A, Labman Scientific Instruments, Delhi, India). The supernatant solution was analyzed for desorbed dye concentration by UV-vis spectrophotometer. Desorption efficiency was calculated as:| Desorption (%) = (Dye desorbed/Dye adsorbed) × 100 | (3) |
The reusability of the adsorbent was determined by performing adsorption–desorption experiments repetitively several times.
3. Results and discussion
3.1 Characterization of the adsorbent
FT-IR spectrum of the as-prepared alumina (Fig. 1a) was recorded in order to detect the phase as well as functional impurities present on the surface of adsorbent material. The characteristic absorption band in the region of 3453 cm−1 is due to –OH stretching vibration of Al–OH and the absorption peak at 1634 cm−1 is ascribed to bending vibration of hydrogen bonded surface hydroxyl groups of the physically adsorbed water molecules.15 The peak at 1178 cm−1 corresponds to asymmetric bending of Al–O–H modes of chemically adsorbed water on the alumina surface.17 The strong broad absorption band appearing in the region of 1000 cm−1 to 500 cm−1 is indicative of γ alumina.12 The band appearing at 750 cm−1 is attributed to skeletal vibration of Al–O bonds.18 The peak at 819 cm−1 and 509 cm−1 can be related to the occupancy of the tetrahedral and octahedral sites by aluminum ions in the ccp and hcp lattice of the oxide ions respectively.12,15,17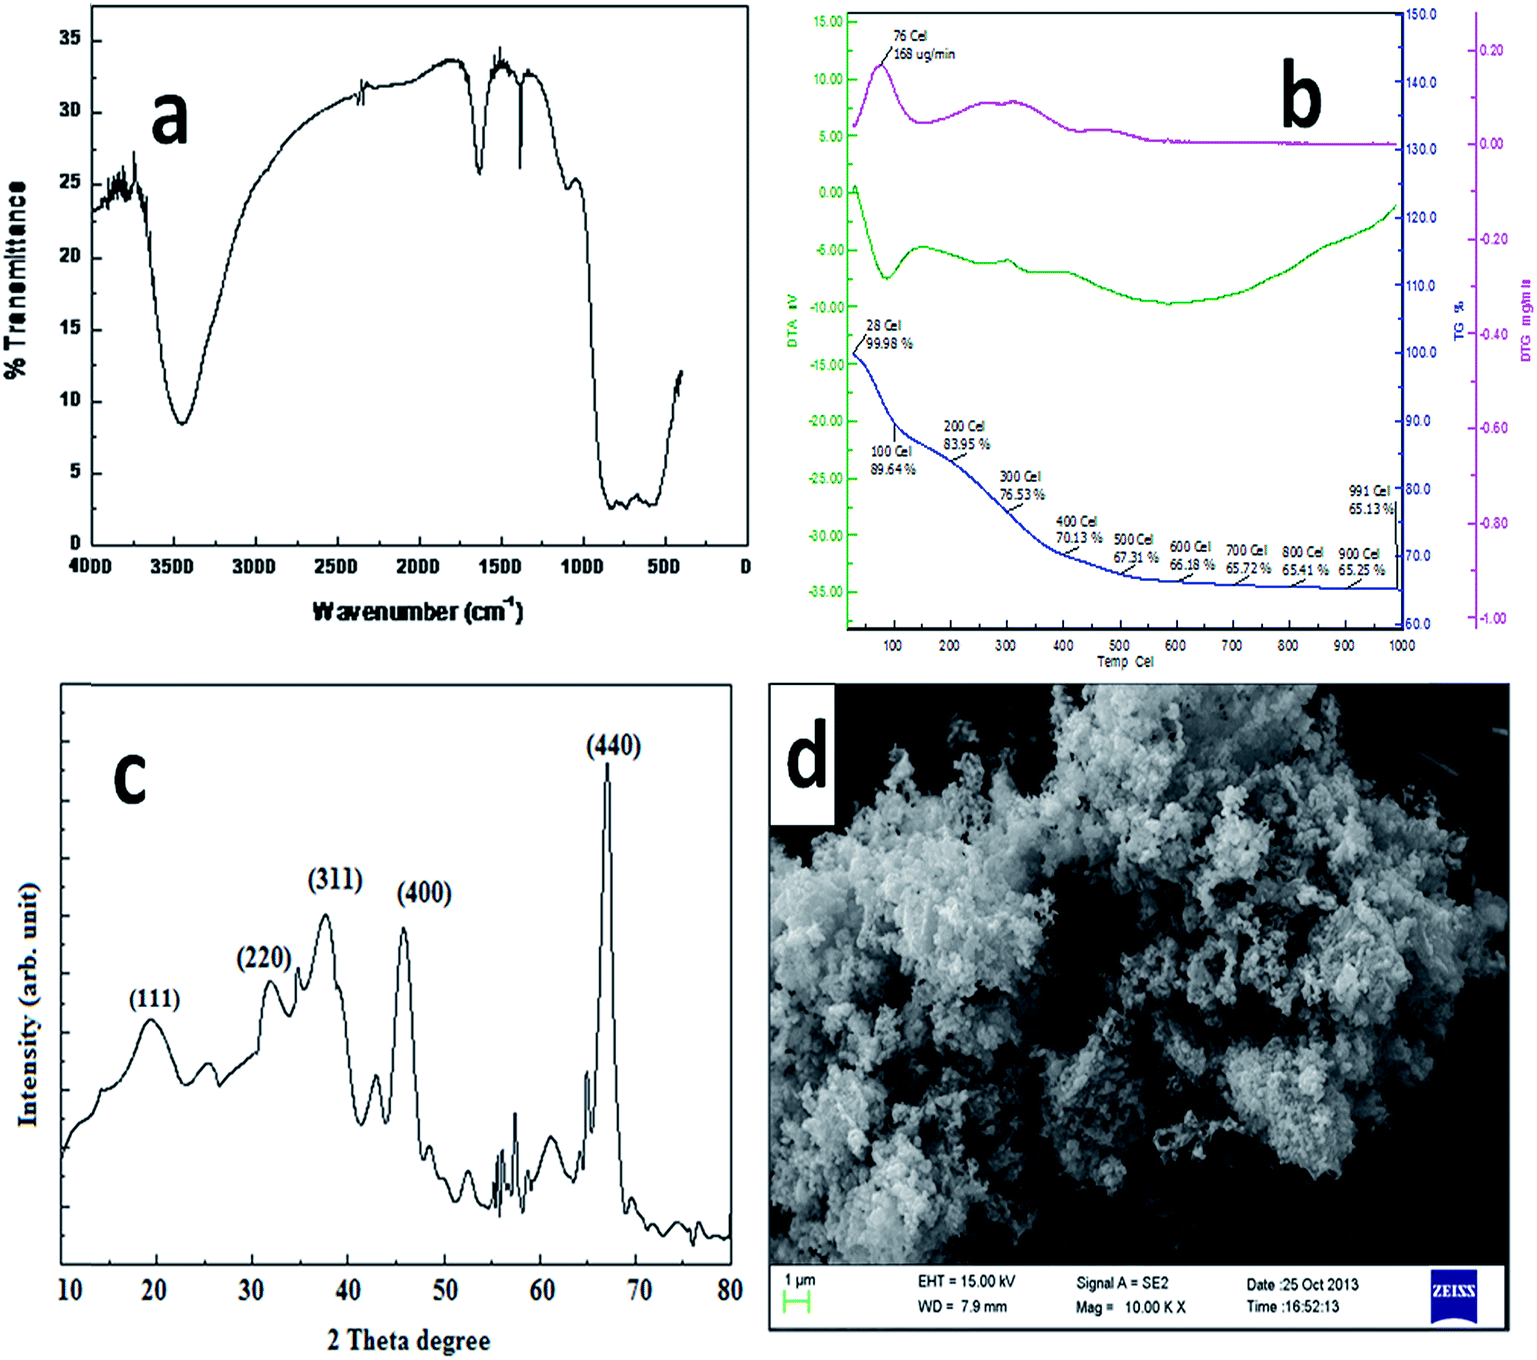 | ||
| Fig. 1 Characterization of alumina nanoparticles, (a) FTIR spectra, (b) TG/DTA/DTG curves, (c) X-ray diffraction pattern, and (d) SEM image at magnification of 10.00 KX. | ||
TG/DTA/DTG curves of adsorbent material are depicted in Fig. 1b. The decomposition curve of alumina nanoparticles exhibited two distinctive weight losses. The first peak observed between 50–100 °C (DTG peak at 76 °C) can be attributed to elimination of adsorbed water molecules accompanied by weight loss of approximately 14%. Another peak appears between 150–400 °C (DTG peak at 310 °C) represents loss of water molecules trapped in alumina crystals and decomposition of nitrates which leads to further weight loss of 18%. Therefore, the total weight loss observed within the temperature range of 50–1000 °C for synthesized alumina nanoparticles was nearly 35% and this value is very close to theoretical weight loss value of 34.6% after transformation of alumina into γ-alumina.19 DTA curve shows one strong and sharp endothermic peak at 72 °C. In the present study, no significant weight loss was observed after 500 °C hence the prepared sorbent was calcined at 600 °C to obtain desired γ phase of the material.
XRD (Fig. 1c) study of the synthesized material was carried out to ascertain the phase of the same. The characteristic peaks obtained at 36.78°, 46.42° and 68.24° of 2θ axis with corresponding spacing values of 2.57, 2.13 and 1.67 Å respectively are in good agreement with the JCPDS File no. 29-63 which confirmed the presence of γ phase alumina having spinel structure represented by empirical formula of H3m Al2−m O3 with space group of Fd3m (227) and lattice parameters aγ = bγ = 7.943 Å and cγ = 7.858. Similar diffraction pattern has been observed for γ-alumina by Krokidis et al.20 The particle size of the adsorbent material was determined by Debye–Scherrer's formula:
d = 0.9λ/fwhm![[thin space (1/6-em)]](https://www.rsc.org/images/entities/char_2009.gif) cosθ cosθ
| (4) |
Scanning electron microscopy of alumina synthesized by controlled precipitation route and calcined at 600 °C is depicted in Fig. 1d. The micrograph reveals that adsorbent particles appear to have smooth spherical configuration but not furnished any information related to possession of porous structures. The particles are nearly homogenous and consistent in nature with a size of ca. 60–70 nm. The image also displays that the solid powder forms loose agglomerates which may be due to formation of weak van der Waals bond between the particles. However, the problem of agglomeration can be minimized by ball milling the adsorbent prior to batch study.
The textural characteristics of the alumina nanoparticles were studied by N2 adsorption–desorption (Fig. 2). The surface area of the material was found to be 76 m2 g−1 using Brunauer–Emmett–Teller equation.21 The figure exhibited typical type IV isotherm according to IUPAC system of classification with a H1 kind of hysteresis loop observed in the region of relative pressure (P/P0) in range of 0.7 to 0.99 indicating existence of ordered mesopores with cylindrical channels. Furthermore, H1 hysteresis loop suggests narrow distribution of pores' size with characteristic property of capillary condensation and evaporation processes in a cylindrical channel open at both ends.22 Comparable adsorption–desorption isotherm curves for γ alumina reported by Cai et al.23 The adsorption–desorption profile reveals the monolayer adsorption and the monolayer value calculated as 17.7 cm3 g−1 at low relative pressure (P/P0) in the linear range between 0.01–0.18. This region suggests the presence of micropores. At higher relative pressure (P/P0 > 0.5), multilayer adsorption occurs in well developed uniform sized mesopores, and further increase in N2 adsorption capacity observed at higher relative pressure (P/P0 > 0.9) indicates existence of few macroporous features.24 Moreover, the Barrett–Joyner–Halenda (BJH) pore size distributions (Fig. 2 inset) obtained from the isotherms suggest that the sample mainly comprises of mesopores (diameter 2–50 nm) having total pore area of about 88%, whereas the micropores (diameter < 2 nm) and macropores (diameter > 50 nm) accounted for 10% and 2% respectively. The average pore diameter estimated by BET method was 33.1 Å, whereas, the BJH adsorption–desorption average pore diameter measured was found to be 326/225 Å. BJH adsorption cumulative surface area and BJH desorption cumulative surface area were found to be 72.4/105 m2 g−1, respectively. The single point adsorption total pore volume of pores (diameter < 9.418 Å) was determined and found to be 0.02 cm3 g−1. The cumulative adsorption–desorption volume of pores (diameter between 17 Å to 3000 Å) were also estimated with values of 0.591/0.596 cm3 g−1, respectively. Thus the high pore volume obtained for the synthesized nano adsorbent is desirable for deep removal of adsorbate from aqueous phase.
 | ||
| Fig. 2 N2 adsorption–desorption isotherm for alumina nanoparticles; (Inset: Pore-size distribution curves of the porous alumina particles). | ||
3.2 Effect of pH
Solution pH plays an important role in the adsorption process by monitoring the uptake of dye ions from the aqueous solutions and is regarded as “persuasive factor”. The change in solution pH affects the surface charge by protonation and deprotonation of the adsorbent material. In present investigations, the effect of solution pH on the sorption of methylene blue was studied over a pH range of 2.0–10.0 for initial dye concentration 1.5 × 10⁻⁴ M at 313 K. Prior to experimental analysis, each dye solution with different pH condition was analyzed spectrophotometrically to ensure that λmax remain unaltered. This observation implies that change in solution pH doesn't change the chemical structure of dye molecules, therefore the sorption results solely due to adsorption process. The experimental results obtained from the investigations were displayed in Fig. 3. It can be observed that maximum dye uptake of 1.27 × 10⁻⁵ mol g−1 (or removal of 81.2%) was achieved at higher pH value of 10.0, while minimum dye uptake of 5.7 × 10⁻⁵ mol g−1 (or removal of 36.3%) have been noticed at lowest pH value of 1.0. This behavior can be explained on the basis of protonation and deprotonation of surface functional groups of the both adsorbate as well as adsorbent. The pKa value of methylene blue is 0.04,25 therefore above this value the dye molecules get completely dissociated into ionic form. Hence, in alkaline environment the positively charged dye ions are attracted strongly towards negatively charged sites of the adsorbent and therefore experienced enhanced uptake. On contrary meager removal has been observed in acidic conditions due to increase in interionic repulsion between cationic dye species and the adsorbent. The influence of pH on the dye removal can also be demonstrated on the basis of isoelectric point of the adsorbent surface. The isoelectric point of alumina nanoparticles was found to be 7.1, which indicates that at this particular pH, adsorbent no longer contributes to the pH of the solution. When the pH of the solution is less than pHZPC, the surface of the adsorbent gets protonated and repulsive forces act between H+ and dye ions resulting in poor removal of the dye. At a pH above pHZPC, the adsorbent surface becomes negatively charged that result in increasing electrostatic attraction between cationic dye and alumina surface and that lead to increase adsorption of dye ions. Therefore, pH 10 was taken as the optimum pH for which adsorbent efficiency for dye uptake is 82.1% in comparison with other pH values. Our results are supported by other workers Ai and Jiang26 and Kannan et al.27 | ||
| Fig. 3 Effect of pH on the adsorption of methylene blue on alumina nanoparticles (dye concentration 1.5 × 10⁻⁴ M; temperature 313 K; dose 10 g L−1). | ||
3.3 Effect of ionic strength of the solution on adsorption
The wastewater in general is a concoction of various chemicals which probably alter the adsorption efficiency of the adsorbent material. Therefore, in present study, experiments were conducted in order to determine the uptake capacity of the adsorbent for dye in the presence of electrolyte and ionic surfactants. Fig. 4 displays the dependency of dye sorption process on various concentrations of KCl, cationic surfactant cetyltrimethylammonium bromide (CTAB) and anionic surfactant, sodium dodecyl sulfate (SDS). | ||
| Fig. 4 Effect of dye uptake in presence of coexisting ions (dye concentration 1.5 × 10⁻⁴ M; temperature 313 K; dose 10 g L−1, pH 10.0). | ||
The effect of ionic strength on the adsorption of methylene blue was studied at 0–1.0 M KCl concentration at 323 K and pH 10. From Fig. 4 (inset), it is clear that the dye removal capacity of alumina nanoparticles got steeply enhanced at low electrolyte concentration, but as the electrolyte concentration increases beyond 0.1 M, reduction in dye adsorption has been reported. This can be explained as at low electrolyte concentration, various interaction forces such as: van der Waals forces; ion–dipole; and dipole–dipole get activated between dye molecules in the solution which are supposed to be responsible for the dimerization of dye molecules resulting in increased sorption efficiency.28 However, at higher electrolyte concentration, the K+ ions start competing with cationic dye ions for the active sites and due to the small size of K+ ions, it drifted rapidly towards the negatively charged sites of the adsorbent and thus resulted in availability of fewer active sites for dye ions sorption.29
The effect of dye sorption process in presence of ionic surfactants was also investigated by varying surfactant concentration range from 0 to 0.1 M. Fig. 4 illustrated that a significant reduction in sorption of methylene blue can be observed in presence of CTAB. This pronounced effect on dye sorption process can be there due to the effective capturing of the oppositely charged active sites of the alumina nanoparticles by the CTAB ions at high concentrations. However, in presence of anionic surfactant, SDS, appreciable increase in dye sorption has been observed but this enhanced sorption has been limited up to low SDS concentration of below 0.01 M, but beyond this concentration, a decreased adsorption of the dye was observed. The enhancement of dye sorption at low SDS concentration is attributed to the modification of the surface active sites by anionic surfactant species which boosted dye uptake capacity. At higher SDS concentration, well ordered micelles are formed in the solution and the dye molecules get encapsulated by the aggregates which refrain dye molecules from being bound with the active sites of the adsorbent.30
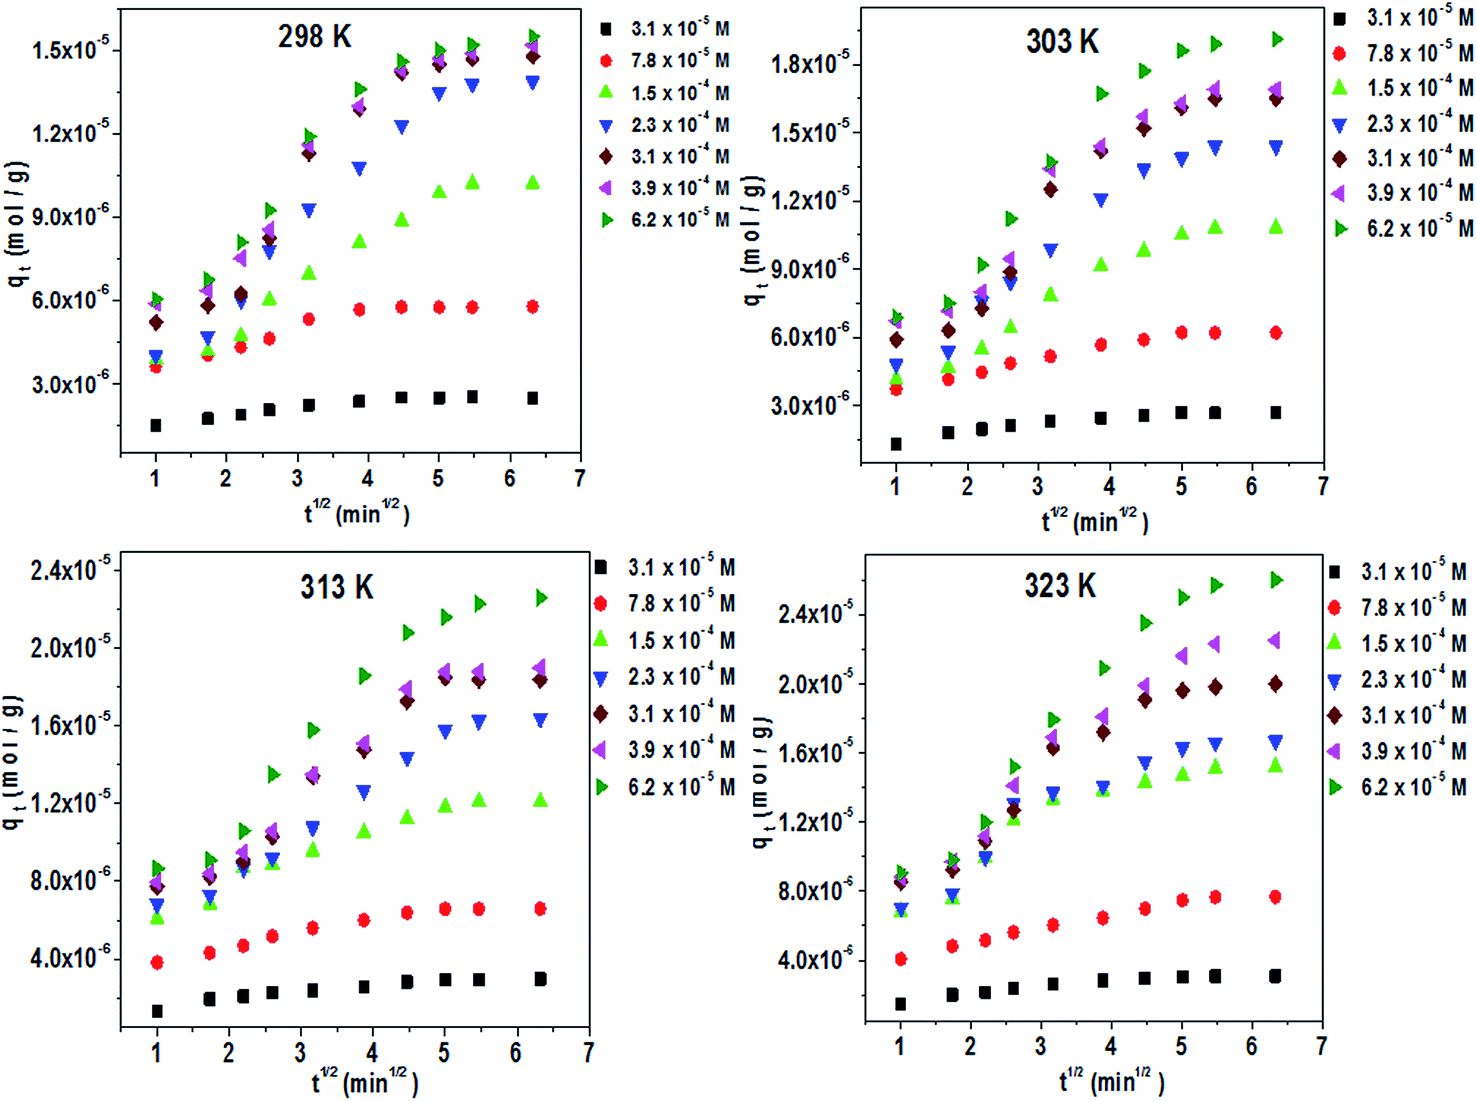
3.4 Effect of contact time on the adsorption and the kinetic studies
It is the most important part of adsorption study that encompasses the investigation of adsorption mechanism by analyzing the rate expression through various kinetic models. The study of sorption kinetics was carried out by investigating the effect of contact time on methylene blue adsorption. Fig. 5 displays the effect of contact time on the adsorption of methylene blue for different initial dye concentrations (3.1 × 10⁻⁵ M to 6.2 × 10⁻⁴ M) at 323 K. It can be observed that the adsorption of the dye rises rapidly at initial period of contact time; afterwards the process gradually slows down until equilibrium is achieved. The maximum adsorption for all initial dye concentrations takes place within first 15 min of contact time and then finally reached equilibrium after 25, 30 and 40 min for initial dye concentrations of 3.1 × 10⁻⁵ to 7.8 × 10⁻⁵ M, 1.5 × 10⁻⁴ to 3.9 × 10⁻⁴ M and 6.2 × 10⁻⁵ M respectively. In order to examine whether adsorption continues even after equilibrium conditions were achieved, the experiments for various initial dye concentration were conducted for longer time period, up to 480 min. The adsorption results for longer time period indicate that beyond equilibrium, no significant adsorption has been found. Rapid adsorption at initial phase may be associated with the availability of larger number of vacant active sites on adsorbent surface over which dye molecules get attached, either physically or chemically. However, after certain time, only few sites are available to accommodate the dye molecules and due to the ‘gathered’ mass of adsorbate molecules on the adsorbent surface, a repulsive force between solute molecules over the solid surface and in bulk phase comes into play which ultimately delays the saturation process.31 | ||
| Fig. 5 Effect of contact time for methylene blue adsorption on alumina nanoparticles for different initial dye concentrations (pH 10.0, adsorbent dose 10 g L−1, temperature 313 K). | ||
In order to determine the kinetic parameters, the sorption kinetic data were analyzed using three different kinetic models namely Lagergren's first order, pseudo-second order and intra particle diffusion models.
The Lagergren first-order model32 was given by the equation as below:
| log(qe − qt) = log qe − (k1/2.303) × t | (5) |
Therefore, the pseudo-second order kinetic model33 was used to analyze the data using equation:
| t/qt = 1/k2qe2 + t/qe | (6) |
 | ||
| Fig. 6 Pseudo second order plots for initial dye concentrations (3.1 × 10⁻⁵ to 3.1 × 10⁻⁴ M) at four different temperatures (insets: Pseudo second order plots for initial dye concentrations of 3.9 × 10⁻⁴ M to 6.2 × 10⁻⁴ M) (pH 10.0; adsorbent dose 10g L−1). | ||
| Pseudo second order kinetics | ||||||||
|---|---|---|---|---|---|---|---|---|
| Dye concentration | Temperature 298 K | Temperature 303 K | ||||||
| k2 (g mol−1 min) | qe (cal) mol g−1 | qe (exp) mol g−1 | R2 | k2 (g mol−1 min) | qe (cal) mol g−1 | qe (exp) mol g−1 | R2 | |
| 3.1 × 10⁻⁵ M | 2.29 × 10⁻⁶ | 2.53 × 10⁻⁶ | 2.52 × 10⁻⁶ | 0.999 | 2.33 × 10⁻⁶ | 2.68 × 10⁻⁶ | 2.94 × 10⁻⁶ | 0.999 |
| 7.8 × 10⁻⁵ M | 3.52 × 10⁻⁶ | 5.77 × 10⁻⁶ | 5.76 × 10⁻⁶ | 0.999 | 3.53 × 10⁻⁶ | 6.35 × 10⁻⁶ | 6.57 × 10⁻⁶ | 0.999 |
| 1.5 × 10⁻⁴ M | 3.89 × 10⁻⁶ | 1.02 × 10⁻⁵ | 1.02 × 10⁻⁵ | 0.999 | 3.97 × 10⁻⁶ | 1.08 × 10⁻⁵ | 1.21 × 10⁻⁵ | 0.999 |
| 2.3 × 10⁻⁴ M | 3.96 × 10⁻⁶ | 1.40 × 10⁻⁵ | 1.38 × 10⁻⁵ | 0.999 | 5.07 × 10⁻⁶ | 1.45 × 10⁻⁵ | 1.62 × 10⁻⁵ | 0.999 |
| 3.1 × 10⁻⁴ M | 5.68 × 10⁻⁶ | 1.48 × 10⁻⁵ | 1.47 × 10⁻⁵ | 0.999 | 5.72 × 10⁻⁶ | 1.67 × 10⁻⁵ | 1.85 × 10⁻⁵ | 0.999 |
| 3.9 × 10⁻⁴ M | 6.37 × 10⁻⁶ | 1.50 × 10⁻⁵ | 1.49 × 10⁻⁵ | 0.999 | 6.96 × 10⁻⁶ | 1.71 × 10⁻⁵ | 1.89 × 10⁻⁵ | 0.999 |
| 6.2 × 10⁻⁴ M | 7.26 × 10⁻⁶ | 1.54 × 10⁻⁶ | 1.53 × 10⁻⁵ | 0.999 | 7.66 × 10⁻⁶ | 1.92 × 10⁻⁵ | 2.23 × 10⁻⁵ | 0.999 |
| Dye concentration | Temperature 313 K | Temperature 323 K | ||||||
|---|---|---|---|---|---|---|---|---|
| k2 (g mol−1 min) | qe (cal) mol g−1 | qe (exp) mol g−1 | R2 | k2 (g mol−1 min) | qe (cal) mol g−1 | qe (exp) mol g−1 | R2 | |
| 3.1 × 10⁻⁵ M | 3.01 × 10⁻⁶ | 2.95 × 10⁻⁶ | 2.84 × 10⁻⁶ | 0.999 | 3.81 × 10⁻⁶ | 3.05 × 10⁻⁶ | 2.52 × 10⁻⁶ | 0.999 |
| 7.8 × 10⁻⁵ M | 4.56 × 10⁻⁶ | 6.56 × 10⁻⁶ | 6.21 × 10⁻⁶ | 0.999 | 4.96 × 10⁻⁶ | 7.66 × 10⁻⁶ | 5.76 × 10⁻⁶ | 0.999 |
| 1.5 × 10⁻⁴ M | 5.17 × 10⁻⁶ | 1.21 × 10⁻⁵ | 1.08 × 10⁻⁵ | 0.999 | 5.47 × 10⁻⁶ | 1.52 × 10⁻⁵ | 1.02 × 10⁻⁵ | 0.999 |
| 2.3 × 10⁻⁴ M | 5.77 × 10⁻⁶ | 1.64 × 10⁻⁵ | 1.44 × 10⁻⁵ | 0.999 | 7.32 × 10⁻⁶ | 1.62 × 10⁻⁵ | 1.38 × 10⁻⁵ | 0.999 |
| 3.1 × 10⁻⁴ M | 6.05 × 10⁻⁶ | 1.87 × 10⁻⁵ | 1.65 × 10⁻⁵ | 0.999 | 8.73 × 10⁻⁶ | 1.79 × 10⁻⁵ | 1.47 × 10⁻⁵ | 0.999 |
| 3.9 × 10⁻⁴ M | 7.11 × 10⁻⁶ | 1.89 × 10⁻⁵ | 1.67 × 10⁻⁵ | 0.999 | 8.78 × 10⁻⁶ | 1.86 × 10⁻⁵ | 1.49 × 10⁻⁵ | 0.999 |
| 6.2 × 10⁻⁴ M | 8.01 × 10⁻⁶ | 2.23 × 10⁻⁵ | 1.89 × 10⁻⁵ | 0.999 | 8.93 × 10⁻⁶ | 1.98 × 10⁻⁵ | 1.53 × 10⁻⁵ | 0.999 |
3.5 Mechanism of the process of removal
Adsorption process is a complex phenomenon which comprises of following four independent possible steps:34(i) Transport of dye ions from the bulk solution to the external surface of adsorbent.
(ii) Film diffusion of dye ions through the boundary around the adsorbent surface.
(iii) Migration of dye ions within the internal pores of the adsorbent or intraparticle diffusion.
(iv) Chemical interaction between dye ions and active sites of the adsorbent.
Out of these, (ii) and (iii) processes are slowest and thus can be used for determining the rate step.
It has been observed that during transportation of dye ions from the bulk liquid phase through the surface boundary layer onto the external surface of adsorbent, the dye ions experience mass transfer resistance. The mass transfer resistance can be determined using following mass transfer model:35
| ln[(Ct/C0) − 1/(1 + mk)] = ln[mk/(1 + mk) − (1 + mk)/mk]βLSst | (7) |
| Ss = 6m/dpρ(1 − εP) | (8) |
 | ||
| Fig. 7 Mass transfer plots for adsorption of methylene blue investigated at a dye concentration of 3.1 × 10⁻⁵ M at four different temperatures (pH 10.0; adsorbent dose 10g L−1). | ||
| External mass transfer model | |||||
|---|---|---|---|---|---|
| Dye concentration | Parameters | 298 K | 303 K | 313 K | 323 K |
| 3.1 × 10⁻⁵ M | βL (cm2 s−1) | 4.4 × 10⁻⁸ | 6.2 × 10⁻⁸ | 1.04 × 10⁻⁷ | 1.34 × 10⁻⁷ |
| R2 | 0.984 | 0.993 | 0.978 | 0.995 | |
| 7.8 × 10⁻⁵ M | βL (cm2 s−1) | 3.8 × 10⁻⁸ | 5.3 × 10⁻⁸ | 9.0 × 10⁻⁸ | 1.3 × 10⁻⁷ |
| R2 | 0.988 | 0.982 | 0.976 | 0.991 | |
| 1.5 × 10⁻⁴ M | βL (cm2 s−1) | 4.1 × 10⁻⁸ | 5.7 × 10⁻⁸ | 9.5 × 10⁻⁸ | 1.25 × 10⁻⁷ |
| R2 | 0.974 | 0.982 | 0.979 | 0.986 | |
| 2.3 × 10⁻⁴ M | βL (cm2 s−1) | 2.8 × 10⁻⁸ | 4.9 × 10⁻⁸ | 8.1 × 10⁻⁸ | 1.22 × 10⁻⁷ |
| R2 | 0.972 | 0.979 | 0.986 | 0.983 | |
| 3.1 × 10⁻⁴ M | βL (cm2 s−1) | 1.6 × 10⁻⁸ | 3.4 × 10⁻⁸ | 6.5 × 10⁻⁸ | 1.18 × 10⁻⁷ |
| R2 | 0.964 | 0.971 | 0.978 | 0.967 | |
| 3.9 × 10⁻⁴ M | βL (cm2 s−1) | 1.05 × 10⁻⁸ | 2.5 × 10⁻⁸ | 4.9 × 10⁻⁸ | 1.04 × 10⁻⁷ |
| R2 | 0.969 | 0.974 | 0.966 | 0.954 | |
| 6.2 × 10⁻⁴ M | βL (cm2 s−1) | 4.14 × 10⁻⁹ | 4.67 × 10⁻⁹ | 8.02 × 10⁻⁹ | 1.08 × 10⁻⁸ |
| R2 | 0.958 | 0.934 | 0.928 | 0.937 | |
Therefore, in order to make proper assessment about rate limiting step and time dependent diffusion mechanism, the kinetic results were further analyzed by fitting them into intra-particle diffusion model suggested by Weber and Morris.38 The model provides an information about the mechanism of adsorption process which may be controlled by film or pore diffusion through intraparticle diffusion plots. The intraparticle diffusion rate of the dye ion into the particle, kid can be calculated from the following equation:38
| qt = kidt1/2 + C | (9) |
 | ||
| Fig. 8 Intra particle diffusion plot for various initial dye concentrations at four different temperatures (pH 10.0; adsorbent dose 10g L−1). | ||
| Dye concentration | Intraparticle diffusion model | |||||||
|---|---|---|---|---|---|---|---|---|
| Temperature 298 K | Temperature 303 K | |||||||
| kid,1 (mol g−1 min−0.5) | C1 | kid,2 (mol g−1 min−0.5) | C2 | kid,1 (mol g−1.min0.5) | C1 | kid,2 (mol g−1 min−0.5) | C2 | |
| 3.1 × 10⁻⁵ M | 2.42 × 10⁻⁷ | 1.38 × 10⁻⁶ | 1.02 × 10⁻⁹ | 2.47 × 10⁻⁶ | 2.62 × 10⁻⁷ | 1.41 × 10⁻⁶ | 1.12 × 10⁻⁹ | 2.41 × 10⁻⁶ |
| 7.8 × 10⁻⁵ M | 5.75 × 10⁻⁷ | 3.17 × 10⁻⁶ | 1.82 × 10⁻⁹ | 5.76 × 10⁻⁶ | 6.27 × 10⁻⁷ | 3.12 × 10⁻⁶ | 1.44 × 10⁻⁹ | 2.68 × 10⁻⁶ |
| 1.5 × 10⁻⁴ M | 1.74 × 10⁻⁶ | 3.26 × 10⁻⁶ | 5.92 × 10⁻⁹ | 1.01 × 10⁻⁵ | 1.87 × 10⁻⁶ | 3.18 × 10⁻⁶ | 4.42 × 10⁻⁹ | 6.22 × 10⁻⁶ |
| 2.3 × 10⁻⁴ M | 4.45 × 10⁻⁶ | 4.45 × 10⁻⁶ | 1.17 × 10⁻⁸ | 1.37 × 10⁻⁵ | 2.68 × 10⁻⁶ | 3.22 × 10⁻⁶ | 7.22 × 10⁻⁹ | 1.38 × 10⁻⁵ |
| 3.1 × 10⁻⁴ M | 2.69 × 10⁻⁶ | 4.68 × 10⁻⁶ | 1.21 × 10⁻⁸ | 1.47 × 10⁻⁵ | 3.21 × 10⁻⁶ | 3.28 × 10⁻⁶ | 2.54 × 10⁻⁸ | 1.41 × 10⁻⁵ |
| 3.9 × 10⁻⁴ M | 2.74 × 10⁻⁶ | 4.71 × 10⁻⁶ | 1.57 × 10⁻⁸ | 1.48 × 10⁻⁵ | 3.23 × 10⁻⁶ | 3.31 × 10⁻⁶ | 2.86 × 10⁻⁸ | 1.62 × 10⁻⁵ |
| 6.2 × 10⁻⁴ M | 2.87 × 10⁻⁶ | 4.74 × 10⁻⁶ | 2.49 × 10⁻⁸ | 1.51 × 10⁻⁵ | 3.55 × 10⁻⁶ | 3.42 × 10⁻⁶ | 2.96 × 10⁻⁸ | 1.65 × 10⁻⁵ |
| Dye concentration | Temperature 313 K | Temperature 323 K | ||||||
|---|---|---|---|---|---|---|---|---|
| kid,1 (mol g−1 min−0.5) | C1 | kid,2 (mol g−1 min−0.5) | C2 | kid,1 (mol g−1 min−0.5) | C1 | kid,2 (mol g−1 min−0.5) | C2 | |
| 3.1 × 10⁻⁵ M | 3.11 × 10⁻⁷ | 1.36 × 10⁻⁶ | 1.57 × 10⁻⁹ | 2.32 × 10⁻⁶ | 3.31 × 10⁻⁷ | 1.32 × 10⁻⁶ | 1.66 × 10⁻⁹ | 2.29 × 10⁻⁶ |
| 7.8 × 10⁻⁵ M | 6.99 × 10⁻⁷ | 3.01 × 10⁻⁶ | 1.71 × 10⁻⁹ | 2.62 × 10⁻⁶ | 7.94 × 10⁻⁷ | 2.94 × 10⁻⁶ | 1.77 × 10⁻⁹ | 3.22 × 10⁻⁶ |
| 1.5 × 10⁻⁴ M | 1.91 × 10⁻⁶ | 3.14 × 10⁻⁶ | 2.52 × 10⁻⁸ | 3.44 × 10⁻⁶ | 1.94 × 10⁻⁷ | 3.08 × 10⁻⁶ | 2.78 × 10⁻⁸ | 3.37 × 10⁻⁶ |
| 2.3 × 10⁻⁴ M | 2.74 × 10⁻⁶ | 3.19 × 10⁻⁶ | 2.67 × 10⁻⁸ | 1.22 × 10⁻⁵ | 2.77 × 10⁻⁶ | 3.14 × 10⁻⁶ | 3.32 × 10⁻⁸ | 1.17 × 10⁻⁵ |
| 3.1 × 10⁻⁴ M | 3.38 × 10⁻⁶ | 3.22 × 10⁻⁶ | 4.72 × 10⁻⁸ | 1.31 × 10⁻⁵ | 3.46 × 10⁻⁶ | 3.18 × 10⁻⁶ | 5.41 × 10⁻⁸ | 1.23 × 10⁻⁵ |
| 3.9 × 10⁻⁴ M | 3.46 × 10⁻⁶ | 3.25 × 10⁻⁶ | 4.77 × 10⁻⁸ | 1.56 × 10⁻⁵ | 3.57 × 10⁻⁶ | 3.21 × 10⁻⁶ | 5.53 × 10⁻⁸ | 1.44 × 10⁻⁵ |
| 6.2 × 10⁻⁴ M | 4.01 × 10⁻⁶ | 3.31 × 10⁻⁶ | 4.91 × 10⁻⁸ | 1.61 × 10⁻⁵ | 4.72 × 10⁻⁶ | 3.26 × 10⁻⁶ | 5.59 × 10⁻⁸ | 1.57 × 10⁻⁵ |
Therefore, in order to explore and identify the probable mechanism that governs the overall sorption rate, the kinetic data were further expressed by a mathematical model:40
 | (10) |
| F = qt/q∞ | (11) |
Thus, the values of Bt can be calculated for each value of F from Richenberg's table.41 The calculated Bt values were plotted against time. The resultant plot considered to be helpful in distinguishing film diffusion from pore diffusion process. If a plot is linear and does not pass through origin, film diffusion is the rate limiting process but if a linear plot passes through the origin, adsorption is controlled by particle diffusion. Fig. 9 furnished that the plots at all temperature are nearly linear but fail to pass through the origin which implies that film diffusion mechanism actually governed the sorption process and can be considered as rate limiting. The slope of the Boyd plot was used to evaluate B values for the determination of effective diffusion coefficient, Di (cm2 s−1) using the relation:40
| B = π2Di/r2 | (12) |
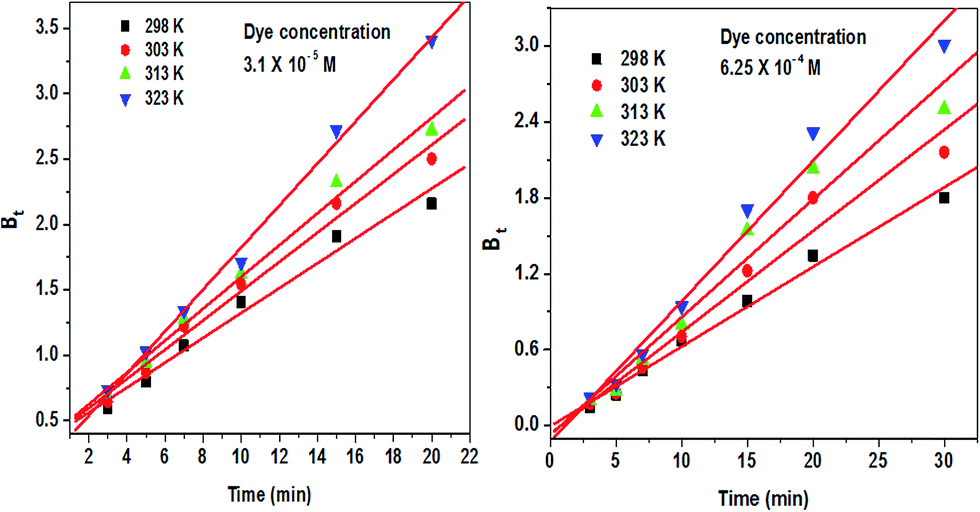 | ||
| Fig. 9 Boyd kinetic plot for the adsorption of methylene blue at lower and higher dye concentrations at different temperatures (pH 10.0; adsorbent dose 10g L−1). | ||
| Boyd kinetic model | |||||
|---|---|---|---|---|---|
| Dye concentration | Parameters | 298 K | 303 K | 313 K | 323 K |
| 3.1 × 10⁻⁵ M | B (s−1) | 0.095 | 0.112 | 0.121 | 0.160 |
| Di × 10−14 (cm2 s−1) | 1.17 | 1.36 | 1.48 | 1.94 | |
| 7.8 × 10⁻⁵ M | B (s−1) | 0.11 | 0.148 | 0.177 | 0.242 |
| Di × 10−14 (cm2 s−1) | 1.34 | 1.81 | 2.15 | 2.94 | |
| 1.5 × 10⁻⁴ M | B (s−1) | 0.127 | 0.136 | 0.179 | 0.256 |
| Di × 10−14 (cm2 s−1) | 1.55 | 1.65 | 2.18 | 3.11 | |
| 2.3 × 10⁻⁴ M | B (s−1) | 0.149 | 0.292 | 0.344 | 0.463 |
| Di × 10−14 (cm2 s−1) | 1.81 | 3.55 | 4.19 | 5.64 | |
| 3.1 × 10⁻⁴ M | B (s−1) | 0.262 | 0.321 | 0.397 | 0.561 |
| Di × 10−14 (cm2 s−1) | 3.19 | 3.91 | 4.83 | 6.84 | |
| 3.9 × 10⁻⁴ M | B (s−1) | 0.301 | 0.448 | 0.511 | 0.677 |
| Di × 10−14 (cm2 s−1) | 3.66 | 5.45 | 6.22 | 8.24 | |
| 6.2 × 10⁻⁴ M | B (s−1) | 0.462 | 0.669 | 0.734 | 0.908 |
| Di × 10−14 (cm2 s−1) | 5.77 | 8.15 | 8.92 | 11.13 | |
Sharma and Das42 and Ai et al.43 support our findings where they investigated adsorption of methyl green and methylene blue using graphene oxide nanosheets and magnetic beads respectively.
3.6 Adsorption isotherm study
The adsorbent–adsorbate interaction can be easily predicted by fitting the adsorption data into equilibrium isotherm models and the model helps in ascertaining the designing of single batch adsorption system. Fig. 10 illustrates the adsorption isotherms of methylene blue on alumina nanoparticles at different temperatures (298 K and 323 K). The figure revealed that adsorption capacity curve rises rapidly with the increase of initial dye concentration and then exhibited nearly flattening trend both at 298 K and 323 K. This trend indicated that all the active sites of alumina nanoparticles possibly get equilibrated by methylene blue at higher initial dye concentration of 6.2 × 10⁻⁴ M. The adsorption capacity found to be increased from 3.08 × 10⁻⁶ to 2.52 × 10⁻⁵ mol g−1 by increasing the initial dye concentrations from 3.1 × 10⁻⁵ to 6.2 × 10⁻⁴ mol L−1. This is because at higher adsorbate concentration, greater driving force offered by the large number of dye molecules present in the solution overcomes mass transfer resistance thus results in enhanced uptake.44 The curves obtained for adsorption isotherm as demonstrated in Fig. 10 reveal some interesting information related to the nature of interaction between adsorbate and adsorbent. According to Giles,45 isotherm plot on the basis of nature of slope can be classified into four classes includes S-curves, L-curves, H-curves and C-curves. The isotherm plots of the present investigation matches L-2 isotherm behavior. The L-2 curve also designated as Langmuir isotherm where the adsorption of adsorbate proceeds until monolayer is established and there is no possibility of formation of more than one adsorption layer due to electrostatic repulsion. The isotherm curve also suggests that the adsorbate molecules adsorbed flat on the adsorbent surface with high degree of affinity between the molecules of adsorbate and adsorbent.45 This strong intermolecular attraction leads the isotherm to reach a maximum sorption capacity at higher concentration and finally gets saturated as indicated by the plateau of the sorption data. Therefore, the isotherm plots represent a favorable and beneficial adsorption. | ||
| Fig. 10 Isotherm plots of methylene blue adsorption on alumina nanoparticles at different temperatures (insets: effect of initial concentrations on the adsorption of methylene blue on alumina nanoparticles at 298 and 323 K). | ||
The study of adsorption isotherm was carried out by fitting the experimental data into two parametric (Langmuir and Freundlich model) and three parametric (Redlich–Peterson model) isotherm expressions respectively. The linearized form of Langmuir, Freundlich and R–P adsorption isotherms were represented by the following expressions.
Langmuir adsorption isotherm equation:46
| 1/qe = 1/Q0 + 1/bQ0Ce | (13) |
A dimensionless constant separation factor (RL) of Langmuir adsorption isotherm was used to determine the favorability of the adsorption process. The values of RL indicate the type of isotherm in case of irreversible RL = 0, favorable 0 < RL < 1, linear RL = 1 or unfavorable RL > 1. The value of RL can be calculated using equation
| RL = 1/1 + bC0 | (14) |
Freundlich adsorption isotherm equation:47
|
logqe = logKF + 1/n(logCe)
| (15) |
Redlich–Peterson (R–P) isotherm equation:48
|
ln(KRCe/qe − 1) = lnaR + βlnCe
| (16) |
In usual practice, the parameters of the isotherm are calculated from the linear plots using non linear equations and this transformation tends to introduce certain degree of inaccuracy in the resultant parameters. However, handful of literature is available in which coefficient of determination (R2) were used to predict the appropriateness of the adsorption isotherm model by measuring the difference between experimental and theoretical data obtained in form of linear plots but its limitation is that it fails to predict the error in the isotherm curve.49 Therefore, in order to minimize error distribution of the data and degree of inaccuracy in isotherm parameter approximation, error functions of non-linear regression were employed which help in predicting the isotherm suitability and provide reliable estimates of the parameters. In the present study, Marquardt's percent standard deviation (MPSD) error function50 was employed to find out the most appropriate isotherm model that proficiently represents the experimental data. This error function resembles to some extent with geometric mean error distribution and has been ameliorated by introducing the number of degree of freedom. This error function is represented by the equation:
 | (17) |
The isotherm parameters for Langmuir, Freundlich and R–P isotherm at different temperatures along with their corresponding correlation coefficient (R2) values are listed in Table 5.
| Methylene Blue | Isotherm Model | 298 K | 303 K | 313 K | 323 K |
|---|---|---|---|---|---|
| Langmuir | Q0 × 10−5 (mol g−1) | 1.65 | 1.71 | 1.79 | 1.88 |
| b × 104 (L mol−1) | 3.04 | 4.33 | 5.14 | 8.88 | |
| RL | 0.053 | 0.037 | 0.031 | 0.021 | |
| R2 | 0.997 | 0.996 | 0.989 | 0.994 | |
| MPSD | 1.86 | 2.09 | 0.54 | 1.94 | |
| Freundlich | KF (mol g−1) | 5.71 × 10⁻⁸ | 1.52 × 10⁻⁷ | 2.34 × 10⁻⁷ | 5.01 × 10⁻⁷ |
| N | 2.17 | 3.04 | 3.61 | 4.18 | |
| R2 | 0.947 | 0.971 | 0.981 | 0.958 | |
| MPSD | 14.5 | 15.7 | 17.4 | 15.3 | |
| Redlich–Peterson | KR (L g−1) | 9.62 | 11.87 | 21.44 | 27.7 |
| aR × 106 (L mol−1) | 1.03 | 7.58 | 6.62 | 4.21 | |
| β | 0.503 | 0.754 | 0.465 | 0.716 | |
| R2 | 0.972 | 0.978 | 0.988 | 0.995 | |
| MPSD | 10.2 | 14.7 | 10.6 | 13.3 |
The Langmuir model assumes that adsorption takes place at specific homogenous sites within the adsorbent, adsorbent molecules do not interact with each other and have finite adsorption capacity for the adsorbate. However, once adsorbate occupies a site, further adsorption at that site is not possible which indicated about the monolayer adsorption process.51 The Langmuir parameters, Q0 and b were evaluated from the intercept and slope of the straight line plot of 1/qe vs. 1/Ce at 298, 303, 313 and 323 K respectively. The values of monolayer saturation, Q0 increase with the rise of temperature confirming endothermic nature of the sorption process. The other parameter, b indicates the affinity for the binding of methylene blue and high value of b represents higher affinity. The higher correlation coefficient, R2 values (>0.98) and lower MPSD error function values recommend that the sorption data is suitably represented by Langmuir model. The favorability of dye adsorption is also determined by a dimensionless separation factor; RL estimated using eqn (9) and is depicted in Table 5. All the RL values lie in the range of 0 < RL < 1 suggested that the dye ions are favorably adsorbed on alumina nanoparticles.
The experimental data were also analyzed by the linearized form of Freundlich isotherm model. The model suggested presence of heterogeneous sites within the adsorbent surface, where only adsorption takes place, thus indicated multilayer nature of sorption process. The plots of ‘logqe vs. logCe’ were plotted at 298, 303, 313 and 323 K and Freundlich constants KF and n were determined from the slopes and intercepts of the plots. All the values of n > 1 signifies that adsorption of dye on alumina nanoparticles was favorable. The correlation coefficient values obtained for the isotherm are nearly comparable to that of Langmuir model but high values of MPSD error equation indicate its inappropriateness for representing experimental sorption data.
The isotherm constants for the three parametric isotherms, Redlich–Peterson were also evaluated at various temperatures. R–P isotherm is a hybrid form that exhibited characteristic features of both Langmuir and Freundlich isotherms, thus makes the isotherm model highly versatile and can be applied to both homogeneous and heterogeneous systems.52 R–P isotherm parameters were obtained according to the intercept and slope from the plots between ‘ln(KRCe/qe − 1) vs. lnCe’. Since the Redlich–Peterson isotherm equation contains three unknown parameters KR, aR and β, therefore, minimization procedure is adopted by minimizing the distance along with maximizing the correlation coefficient between the experimental data points and the theoretical model predictions using “Solver” add-in function of the Microsoft Excel program. As R–P equation is applicable to homogeneous and heterogeneous systems, in the limit, as the exponent β tends to 1, the equation becomes more homogeneous or, Langmuir, and as the exponent β tends to 0, the equation approaches the heterogeneous Freundlich condition.53 In the present study, all values of the exponent β close to unity, indicate that the dye adsorption is homogenous in nature. The KR/aR values approximated Langmuir's adsorption capacity Q0. The lower values of MPSD error function and high correlation coefficient also suggested the applicability of R–P isotherm in describing the sorption data.
Therefore, on the basis of MPSD error function (predicting the difference between the values obtained through linearization model and nonlinear regression model) the best fitted adsorption isotherm follows the order: Langmuir > Redlich–Peterson > Freundlich.
3.7 Effect of temperature on adsorption
The dependence of adsorption capacity of the removal of methylene blue has been investigated at different temperatures (298, 303, 313 and 323) K. The results (Fig. 11) reflect that on increasing the temperature, the adsorption capacity of the adsorbent gets augmented. This characteristic may be attributed to the decrease in viscosity of the solution at higher temperature that caused rapid diffusion of the dye molecules from the liquid phase to the external boundary layer and surface cavities of the adsorbent particles. Moreover, change in temperature alters the saturation capacity of the adsorbent for a particular adsorbate.54 The rise in temperature induces greater extent of mobility within the dye molecules, thus facilitating the formation of monolayer over the surface active sites of the adsorbent.55 The enhanced sorption of the dye at increased temperature suggested endothermic nature of the adsorption process. | ||
| Fig. 11 Effect of temperature on the adsorption capacity of methylene blue (pH 10.0, adsorbent dose 10 g L−1). | ||
The thermodynamic parameters such as changes in the free energy (ΔG0), enthalpy (ΔH0) and entropy (ΔS0) have been evaluated (Table 6) using distribution coefficients at different temperature using following equations:56
|
lnb = ΔS0/R − ΔH0/RT
| (18) |
| ΔG0 = ΔH0 − TΔS0 | (19) |
b vs. 1/T’ exhibited straight line from which the values of ΔH0 and ΔS0 can be determined from the slope and intercept of the plot. The free energy changes (ΔG0) are negative, indicating that adsorption process is feasible and spontaneous. The decrease in free energy values with the increase of temperature suggested that higher temperature favors adsorption of methylene blue onto alumina nanoparticles. In addition, the magnitude of thermodynamic parameters reflects the nature of the adsorption process. The values of ΔG0 between −20 to 0 kJ mol−1 represent involvement of physisorption process for the removal of methylene blue by nanoadsorbent, while values in the −80 to −400 kJ mol−1 range represent involvement of chemical sorption process57 in the system. The value of ΔS0 were found to be positive due to the increased randomness at solute–solvent interface because of the release of water molecules from the adsorbent surface as the former gets displaced by the dye molecules.58 The activation energy (Ea) of methylene blue adsorption on alumina nanoparticles can be determined using the Arrhenius equation:44|
lnk2 = lnA − Ea/RT
| (20) |
k2 vs. 1/T’ (Fig. 12) represents activation energy (Ea). The value of activation energy also indicates the adsorption behavior. Activation energies of low magnitude (5–40 kJ mol−1) correspond to physical adsorption while a higher value (40–800 kJ mol−1) signifies chemisorption process.59 The activation energy for adsorption is evaluated as 5.64 kJ mol−1 indicating adsorption process is dominated by physisorption mechanism.
| Temp. (T) (K) | Standard Gibbs free energy change ΔG0 (kJ mol−1) | Standard enthalpy change ΔH0 (kJ mol−1) | Standard entropy change ΔS0 (J mol−1 K−1) |
|---|---|---|---|
| 298 | −25 | 29 | 184 |
| 303 | −26 | ||
| 313 | −28 | ||
| 323 | −30 |
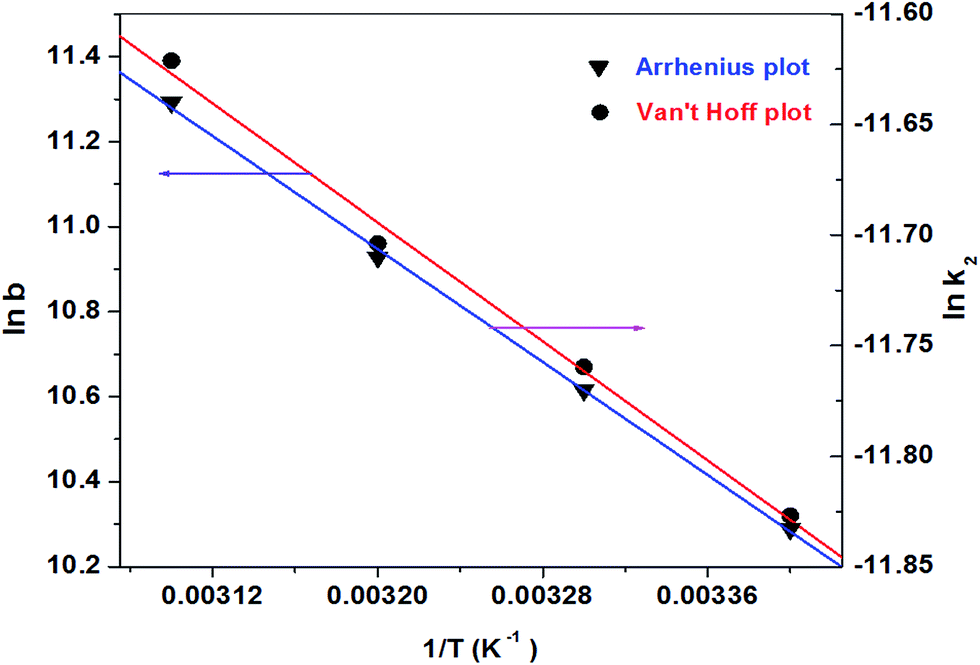 | ||
| Fig. 12 Plot of the thermodynamic equilibrium constant (lnb) vs. temperature (1/T) and the kinetic constant (lnk2) vs. temperature (1/T). | ||
3.8 Desorption study
Easy recovery and long term reusability of the adsorbent is important aspect for any practical industrial application as it reduces the cost of wastewater treatment and will minimize the disposal problem of the exhausted material.60 In usual practice, desorption experiments were carried out using desorption solvents including acids, alkali, alcohols, complexing agent, oxidant, etc.61–65 However, after the recovery of the desired materials, the fate of desorption solvents bearing chemicals were probably uncertain. Therefore, in a view to overcome the problem, chemical free method was adopted in this study. Accordingly, desorption experiments were conducted using ultrasonic energy, as mechanical vibrations cause detachment of dye ions from the binding sites. Dye desorption was almost completed within 50 min which is rapid. Rapid desorption indicates about the physical nature of adsorption process. The desorption efficiency of dye calculated as 90.11% at pH 7.0 which indicates about the reusability of the alumina nanoparticles. The reusability of the adsorbent was tested by performing adsorption–desorption experiments several times. The results indicated that adsorbent capacity of alumina nanoparticles subsequently decreases after each adsorption–desorption cycles. The removal % of adsorbent up to three cycles was more than 80% which suggests that similar adsorbent can be effectively used for three consecutive times.4. Conclusion
On the basis of present studies the following conclusions may be drawn:(i) The nano adsorbent, alumina nanoparticles can be easily synthesized by co-precipitation in laboratory with an yield of 89%.
(ii) The resultant size of the as-prepared adsorbent was found to be in range of 60–70 nm. The BET analysis suggested that adsorbent is mesoporous in nature and exhibited surface area of 76 m2 g−1.
(iii) The result of FTIR and XRD substantiated the formation of amorphous gamma (γ) alumina nanoparticles.
(iv) Solution pH contributes significant role in dye removal process and a maximum removal of ∼81.2% for initial dye concentration of 1.5 × 10⁻⁴ M at 313 K was reported at 10.0 pH.
(v) The process of removal was governed by pseudo-second order kinetics. The mechanistic pathway of sorption process interpreted through intraparticle diffusion model, Boyd model and mass transfer model. Film diffusion controls adsorption of dye.
(vi) Equilibrium data were described through Langmuir, Freundlich and Redlich–Peterson model and results were in good agreement with the Langmuir model. The maximum adsorption capacity obtained as 1.88 × 10⁻⁵ mol g−1 at 323 K.
(vii) Thermodynamic study reveals about spontaneous nature of sorption process and positive values of change in enthalpy imply that higher temperature augmented dye removal process.
(viii) The value of activation energy indicated that dye removal is governed by physisorption.
(ix) Regeneration study was carried out by performing adsorption–desorption cycle several times. The adsorbent can be efficiently used for three consecutive times and in the third cycle a removal of 85 was achieved.
The studies indicated that alumina nanoparticles make a suitable adsorbent for a rapid and deep removal of colored contaminants from aqueous solutions.
Acknowledgements
The authors like to acknowledge Instrumentation centre, IIT-Roorkee for SEM and TG/DTA analysis, Department of Chemistry, IIT-BHU for XRD and FTIR records and Department of Chemical Engineering IIT-BHU for BET analysis of the sample. Thanks are also due to CSIR, New Delhi for the award of Junior Research Fellowship (JRF) to SB and anonymous reviewers for their valuable comments and suggestions.References
- J. Gong, T. Liu, X. Wang, X. Hu and L. Zhang, Environ. Sci. Technol., 2011, 45, 6181 CrossRef CAS PubMed.
- A. D. Bokare, R. C. Chikate, C. V. Rode and K. M. Paknikar, Environ. Sci. Technol., 2007, 41, 7437–7443 CrossRef CAS.
- J. Yang, Q. Zeng, L. Peng, M. Lei, H. Song, B. Tie and J. Gu, J. Environ. Sci., 2013, 25, 413 CrossRef CAS.
- K. Y. Kumar, H. B. Muralidhara, Y. A. Nayaka, J. Balasubramanyam and H. Hanumanthappa, Powder Technol., 2013, 246, 125 CrossRef CAS PubMed.
- X. Zhao, W. Wang, Y. Zhang, S. Wu, F. Li and J. P. Liu, Chem. Eng. J., 2014, 250, 164 CrossRef CAS PubMed.
- C. H. Shek, J. K. L. Lai, T. S. Gu and G. M. Lin, Nanostruct. Mater., 1997, 8, 605 CrossRef CAS.
- A. I. Y. Tok, F. Y. C. Boey and X. L. Zhao, J. Mater. Process. Technol., 2006, 178, 270 CrossRef CAS PubMed.
- A. Rahmani, H. Zavvar Mousavi and M. Fazli, Desalination, 2010, 253, 94 CrossRef CAS PubMed.
- K. Sohlberg, S. J. Pennycook and S. T. Pantelides, J. Am. Chem. Soc., 1999, 121, 7493 CrossRef CAS.
- Y. C. Sharma, V. Srivastava, S. N. Upadhyay and C. H. Weng, Ind. Eng. Chem. Res., 2008, 47, 8095 CrossRef CAS.
- V. Srivastava, C. H. Weng, V. K. Singh and Y. C. Sharma, J. Chem. Eng. Data, 2011, 56, 1414 CrossRef CAS.
- A. Bhatnagara, E. Kumar and M. Sillanpää, Chem. Eng. J., 2010, 163, 317 CrossRef PubMed.
- N. K. Renuka, A. V. Shijina and A. K. Praveen, Mater. Lett., 2012, 82, 42 CrossRef CAS PubMed.
- M. Ghaedi, S. Heidarpour, S. N. Kokhdan, R. Sahraie, A. Daneshfar and B. Brazesh, Powder Technol., 2012, 228, 18 CrossRef CAS PubMed.
- K. M. Parida, A. C. Pradhan, J. Das and N. Sahu, Mater. Chem. Phys., 2009, 113, 244 CrossRef CAS PubMed.
- S. Banerjee, G. C. Sharma, M. C. Chattopadhyaya and Y. C. Sharma, J. Environ. Chem. Eng., 2014, 2, 1870 CrossRef CAS PubMed.
- C. L. Lu, J. G. Lv, L. Xu, X. F. Guo, W. H. Hou, Y. Hu and H. Huang, Nanotechnology, 2009, 20, 215604 CrossRef CAS PubMed.
- H. Li, L. Zhang, H. Dai and H. He, Inorg. Chem., 2009, 48, 4421 CrossRef CAS PubMed.
- S. Shen, W. K. Ng, L. S. O. Chia, Y. C. Dong and R. B. H. Tan, Cryst. Growth Des., 2012, 12, 4987 CAS.
- X. Krokidis, P. Raybaud, A. E. Gobichon, B. Rebours, P. Euzen and H. Toulhoat, J. Phys. Chem. B, 2001, 105, 5121 CrossRef CAS.
- V. Tomar, S. Prasad and D. Kumar, Microchem. J., 2013, 111, 116 CrossRef CAS PubMed.
- M. Thommes, Chem. Ing. Tech., 2010, 82, 1058 Search PubMed.
- W. Cai, J. Yu and M. Jaroniec, J. Mater. Chem., 2010, 20, 4587 RSC.
- A. Öztürk and E. Malkoc, Appl. Surf. Sci., 2014, 299, 105 CrossRef PubMed.
- S. Chowdhury and P. D. Saha, Appl. Water Sci., 2012, 2, 209 CrossRef CAS PubMed.
- L. Ai and J. Jiang, Chem. Eng. J., 2012, 192, 156 CrossRef CAS PubMed.
- C. Kannan, K. Muthuraja and M. R. Devi, J. Hazard. Mater., 2013, 244–245, 10 CrossRef CAS PubMed.
- G. Alberghina, R. Bianchini, M. Fichera and S. Fisichella, Dyes Pigm., 2000, 46, 129 CrossRef CAS.
- N. M. Mahmoodi, S. Khorramfar and F. Najafi, Desalination, 2011, 272, 187 CrossRef CAS PubMed.
- P. Janoš and V. Šmídová, J. Colloid Interface Sci., 2005, 291, 19 CrossRef PubMed.
- M. A. Ahmad and N. K. Rahman, Chem. Eng. J., 2011, 170, 154 CrossRef CAS PubMed.
- S. Lagergren, K. Sven. Vetenskapsakad. Handl., 1898, 244, 1 Search PubMed.
- Y. S. Ho, Adsorption, 2004, 10, 151 CrossRef CAS.
- G. Crini and P. M. Badot, Prog. Polym. Sci., 2008, 33, 399 CrossRef CAS PubMed.
- G. McKay, S. J. Allen, I. F. McConvey and M. S. Otterburn, J. Colloid Interface Sci., 1981, 80, 323 CrossRef CAS.
- S. J. Allen, Q. Gan, R. Matthews and P. A. Johnson, Ind. Eng. Chem. Res., 2005, 44, 1942 CrossRef CAS.
- A. Mittal, J. Mittal, A. Malviya, D. Kaur and V. K. Gupta, J. Colloid Interface Sci., 2010, 342, 518 CrossRef CAS PubMed.
- W. J. Weber and J. C. Morris, J. Sanit. Eng. Div., Am. Soc. Civ. Eng., 1963, 89, 31 Search PubMed.
- J. Saikia, Y. Sikdar, B. Saha and G. Das, J. Environ. Chem. Eng., 2013, 1, 1166 CrossRef CAS PubMed.
- G. E. Boyd, A. W. Adamson and L. S. Meyers, J. Am. Chem. Soc., 1947, 69, 2836 CrossRef CAS.
- D. Reichenberg, J. Am. Chem. Soc., 1953, 75, 589 CrossRef CAS.
- P. Sharma and M. R. Das, J. Chem. Eng. Data, 2013, 58, 151 CrossRef CAS.
- L. Ai, M. Li and L. Li, J. Chem. Eng. Data, 2011, 56, 3475 CrossRef CAS.
- S. Banerjee and M. C. Chattopadhyaya, Arabian J. Chem., 2013 DOI:10.1016/j.arabjc.2013.06.005.
- C. H. Giles, T. H. MacEwan, S. N. Nakhwa and D. Smith, J. Chem. Soc., 1960, 3973 RSC.
- I. Langmuir, J. Am. Chem. Soc., 1916, 38, 2221 CrossRef CAS.
- H. M. F. Freundlich, J. Phys. Chem., 1906, 57, 385 CAS.
- O. J. Redlich and D. L. Peterson, Useful adsorption isotherm, J. Phys. Chem., 1959, 63, 1024 CrossRef CAS.
- J. C. Y. Ng, W. H. Cheung and G. McKay, J. Colloid Interface Sci., 2002, 255, 64 CrossRef CAS.
- D. W. Marquardt, J. Soc. Ind. Appl. Math., 1963, 11, 431 CrossRef.
- M. R. Fathi, A. Asfaram, A. Hadipour and M. Roosta, J. Environ. Sci. Health, Part A: Toxic/Hazard. Subst. Environ. Eng., 2014, 12, 62 Search PubMed.
- K. Y. Foo and B. H. Hameed, Chem. Eng. J., 2010, 156, 2 CrossRef CAS PubMed.
- V. S. Mane, I. D. Mall and V. C. Srivastava, J. Environ. Manage., 2007, 84, 390 CrossRef CAS PubMed.
- M. Dogan, Y. Ozdemir and M. Alkan, Dyes Pigm., 2007, 75, 701 CrossRef CAS PubMed.
- G. Kiani, M. Dostali, A. Rostami and A. R. Khataee, Appl. Clay Sci., 2011, 54, 34 CAS.
- C. A. P. Almeida, N. A. Debacher, A. J. Downs, L. Cottet and C. A. D. Mello, J. Colloid Interface Sci., 2009, 332, 46 CrossRef CAS PubMed.
- M. A. Abdel Salam, M. A. Gabal and A. Y. Obaid, Synth. Met., 2012, 161, 2651 CrossRef PubMed.
- Z. Dong, T. Ye, Y. Zhao, J. Yu, F. Wang, L. Zhang, X. Wang and S. Guo, J. Mater. Chem., 2011, 21, 5978 RSC.
- T. S. Anirudhan and P. G. Radhakrishnan, J. Chem. Thermodyn., 2008, 40, 702 CrossRef CAS PubMed.
- T. Xing, H. Kai and G. Chen, Color. Technol., 2012, 128, 295 CAS.
- A. Mahapatra, B. G. Mishra and G. Hota, J. Hazard. Mater., 2013, 258– 259, 116 CrossRef PubMed.
- Z. Dong, T. Ye, Y. Zhao, J. Yu, F. Wang, L. Zhang, X. Wang and S. Guo, J. Mater. Chem., 2011, 21, 5978 RSC.
- C. Wang, C. Feng, Y. Gao, X. Ma, Q. Wu and Z. Wang, Chem. Eng. J., 2011, 173, 92 CrossRef CAS PubMed.
- C. Chen, P. Gunawan and R. Xu, J. Mater. Chem., 2011, 21, 1218 RSC.
- K. Vijayaraghavan and Y. S. Yun, Dyes Pigm., 2008, 76, 726 CrossRef CAS PubMed.
| This journal is © The Royal Society of Chemistry 2015 |