Luminescent CdTe quantum dots incarcerated in a columnar matrix of discotic liquid crystals for optoelectronic applications

Manish Kumar and Sandeep Kumar*
Raman Research Institute, C.V. Raman Avenue, Sadashivanagar, Bangalore – 560 080, India. E-mail: skumar@rri.res.in; Fax: +91 80 23610492; Tel: +91 80 23610122

Received 23rd October 2014 , Accepted 27th November 2014

First published on 27th November 2014


Abstract

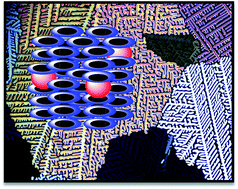
Here in we demonstrate, for the first time, the effects of highly luminescent alkylamine-capped semiconductor cadmium telluride quantum dot (CdTe QD) dispersion on the optical, electrical, and thermal properties and supramolecular order of a discotic liquid crystal (DLC). The insertion and properties of CdTe quantum dots in the columnar mesophase were studied by UV-vis spectroscopy, photoluminescence spectroscopy, polarized optical microscopy, differential scanning calorimetry, X-ray diffraction and DC conductivity. Results indicate uniform dispersion of CdTe QDs in a columnar matrix without disrupting the mesophase but enhancing the conductivity of the system significantly.

1. Introduction

The columnar mesophases formed due to the self-assembly of functionalized disc-shaped molecules are of great scientific importance because of their extraordinary unidirectional charge and energy migration properties. Because of their fundamental and technological importance, significant research work is going on around the world which has been reviewed in several articles, e.g., see ref. 1–19. A majority of discotic liquid crystals are derived from polycyclic aromatic cores such as, triphenylene, hexabenzocoronene, phthalocyanine, etc., which possess strong π–π interactions favouring columnar stacking of the molecules. In the columnar mesophase of DLCs, aromatic cores are oriented in columns separated by molten aliphatic hydrocarbon chains. The intra-columnar (core–core) separation in a columnar mesophase is usually of the order of 3–4 Å while the intercolumnar (neighbouring columns) separation is generally in the range of 20–40 Å, depending on the length of lateral flexible chains. Therefore, interactions between neighbouring molecules within the same column would be much stronger than interactions between neighbouring columns. Due to the columnar arrangement of aromatic cores, electrons or holes migrate efficiently along the columns in quasi one dimension. The Conductivity along the columns in columnar mesophases has been reported to be several orders of magnitude greater than in the perpendicular direction.20,21 Due to this extraordinary property of DLCs, their use in many devices such as, sensors, photovoltaic solar cells, thin film transistors, etc., has been sought.

Semiconductor nanoparticles or quantum dots (QDs) have recently received much interest of researchers due to their fundamental and novel size dependent properties, photo stability and emission tunability.22 Since most II–VI semiconductors have a direct band gap, they form a new and promising class of luminescent materials that can be used in photovoltaic and light emitting diodes fabrication. Among various QDs, CdTe QDs have gained much importance because of their application in life science,23 biological imaging,24 biosensors,25 and optoelectronics.26,27 These QDs can be prepared via different methodologies.28–32 Recently a room temperature synthesis for CdTe QDs has been reported using aqueous solutions and thiol capping molecules.33 Previously we have reported hybrid nanocomposites of different monomeric and polymeric DLCs doped with various metallic, semiconducting and carbon NPs like, gold nanoparticles,34,35 CdSe quantum dots,36 carbon nanotubes,37,38 and graphene.39 Recently such supramolecular structures of liquid crystals nanoparticle systems have been extensively studied.40–43 Here in this work, we synthesized highly luminescent small size (3.58 nm) CdTe QDs stabilized by octadecylamine (ODA) ligands and discussed the effects of the dispersion of these alkylamine-capped highly luminescent CdTe quantum dots on optical, electrical, thermal properties and supramolecular order of a triphenylene-based discotic liquid crystal. Such quantum dots have previously been used in organic–inorganic solar cells as an electron acceptors44–50 and, therefore, DLC–CdTe QDs composites may find application in organic photovoltaics.

2. Experimental

2.1. Materials

Cadmium acetate (Cd (CH3COO)2·2H2O), tellurium powder (Te), octadecylamine (ODA), trioctylphosphine (TOP), chloroform and methanol used for the synthesis of QDs were purchased from Sigma Aldrich Co. in analytical grade form. All the experiments were carried out using DI water for synthesis.

2.2. Synthesis of octadecylamine (ODA) stabilized CdTe quantum dots

ODA capped CdTe QDs were synthesized by previously reported synthesis procedure by Wuister et al.33 with slight modification. Briefly, octadecylamine (5 g) and trioctylphosphine (3 mL) were taken into a two-necked, round bottom flask and heated at 80 °C for 30 min to bring the mixture to a liquid state in inert atmosphere. In the meantime, a separate solution was prepared in a two necked round-bottom flask bottle containing of (Cd (CH3COO)2·2H2O) (0.41 g) and Te powder (0.16 g) in TOP (4 mL), so the molecular ratio of Cd[thin space (1/6-em)]:[thin space (1/6-em)]Te will be 2.5 to 1. The mixture was sonicated for 2 h to obtain an almost clear solution. This solution was then quickly injected with the help of syringe into a RB flask containing ODA and TOP mixture. The reaction was carried out at elevated temperature for several minutes so that the desired size of the CdTe core is reached. Because the luminescence of the QD depends on its size, the growth of the particle was monitored by its absorbance at regular intervals of the reaction time by taking the UV-vis absorbance spectroscopy (Fig. S1). It was observed that the size of QDs reaches to 3.58 nm when the reaction was carried out at 165 °C for 20 min. After the reaction, the solution containing CdTe QDs was cooled to 70 °C and toluene (20 mL) was injected to the solution to stop the reaction and crush out quantum dots and prevent the mixture to solidification. After completion of the reaction, excess starting materials like octadecylamine, Te, were removed by washing the CdTe QDs with methanol and ethanol in different ratio followed by repeated precipitation and centrifugation for 45 min at 4000 rpm. Then the QDs were dissolved in nonpolar solvent CHCl3 and are used for characterization and doping purpose (Fig. 1).
image file: c4ra12211a-f1.tif
Fig. 1 Structure of the octadecylamine capped CdTe quantum dot.

2.3. Preparation of composites

Discotic liquid crystals (DLC) namely hexakis(butyloxy)triphenylene (HAT4) was synthesized as reported by us earlier.19,51 Nanocomposites having weight percentage of 1% and 5% of CdTe QDs in HAT4 were prepared by mixing two components in chloroform. For 1% CdTe/HAT4 composite, CdTe quantum dots (1 mg) were taken in chloroform (5 mL) and sonicated for 2 h. To this solution, triphenylene derivative HAT4 (99 mg) was added and the mixture was further sonicated for 2 h to ensure homogenous composites. After that the solvent was removed by evaporation under N2 flow. Similarly 5% CdTe/HAT4 composite was prepared by adding CdTe QD (5 mg) in HAT4 DLC (95 mg).

3. Sample characterization

X-Ray powder diffraction (XRD) patterns were obtained on DY 1042-Empyrean XRD with Pixel 3D detector at Cu-Kα radiation. Absorption and fluorescence spectra were recorded on a Perkin Elmer UV-Vis-lambda 35 double beam-spectrophotometer and Perkin Elmer Fluormax spectrophotometer, respectively. Optical textures of mesophases were observed using Olympus-POM-018 polarized optical microscope. DSC of liquid crystals and composites were taken at the temperature range of 5 °C to 150 °C using Parkin-Elmer Pyris-1 DSC.

4. Results and discussion

4.1. Structural characterization

The crystal structure formation of CdTe quantum dots is characterized by X-ray investigation. Fig. 2 shows that as prepared octadecylamine capped CdTe quantum dots consists of the characteristics cubic Zinc blende CdTe pattern with diffractive peaks at 24.09°, 39° and 46.71° which is also the dominant crystal phase of bulk CdTe. All the three broad peaks correspond to (111), (220), and (311) planes matched quiet well with the reported CdTe peaks (JCPDS card no. 15-0770). The particle size from the width of the (111) reflection can be calculated by using the Scherrer's equation, we can calculate the mean size of the quantum dots from the full width at half maximum and that is 3.35 nm with lattice strain of 0.0517. By using the Bragg equation we can roughly calculate the distance between two neighbour quantum dots and that is 3.70 nm slightly higher to Scherrer's equation, this revels that the longer chain of octadecylamine forms a shell around the quantum dot and separate them from each other.
image file: c4ra12211a-f2.tif
Fig. 2 Powder X-ray diffraction data of ODA capped CdTe QDs.

4.2. Optical characterization of ODA-capped CdTe QDs: UV-Vis and fluorescence spectroscopy

From absorption spectra of CdTe quantum dots (Fig. 3a), we can see that obtained CdTe QDs possesses a well resolved maximum absorption of the first electron excitation process of transition and which also indicating narrow size distribution of the quantum dots at λmax 580 nm. According to the previously reported work the particle size can also be calculated from the first absorption maximum by using of the following equation.52
D = (9.817 × 10⁻⁷)λ3 − (1.7147 × 10⁻³)λ2 + (1.0064)λ − 194.84

image file: c4ra12211a-f3.tif
Fig. 3 (a) UV-vis and (b) PL spectra of ODA capped CdTe quantum dots of 3.58 nm size in chloroform. These QDs were obtained by performing the reaction at 165 °C for 20 min.

Upon calculation the result shows that the mean diameter of the CdTe quantum dots is 3.58 nm which corresponds to the maximum first absorption of λmax 580 nm and that is in good agreement with Bragg size of 3.70 nm and Scherrer's size of 3.35 nm.

Photoluminescence (PL) spectra was obtained by excitation wavelength of λex = 350 nm, the emission peak position centered about 520 nm. The PL spectrum is very sharp and the FWHM (full width half maximum) is less than 40 nm indicates that the particle size distribution is very narrow. As the reaction time and temperature increases the growth of QD become rapid and this can be seen in absorption spectrum. Both absorption and emission spectra are red shifted and this is the result of the growth of CdTe QDs. After 5 min, 10 min, 15 min and 20 min of the reaction time the size of quantum dot is 1.076, 1.31 nm, 3.46 nm and 3.58 nm respectively. The absorption spectra of these sample is available in ESI.

4.3. Polarized optical microscopy

The mesomorphic and thermal behaviour of nanocomposites formed by dispersing 1% and 5% CdTe QDs in hexakis(butyloxy)triphenylene (HAT4) was investigated by polarizing optical microscopy (POM) and differential scanning calorimetry (DSC). Fig. 4a and b shows the typical polarizing optical micrographic textures for the composites 1% CdTe QDs/HAT4 and 5% CdTe QDs/HAT4. It was similar to the POM textures of pure HAT4. POM studies of 1% CdTe/HAT4 composite clearly indicated the homogeneous dispersion of semiconductor quantum dots in DLC without any phase segregation. They show the texture of hexagonal columnar mesophase upon cooling from the isotropic phase. In 5% CdTe QDs/HAT4 composite little aggregation of QDs can be seen in POM (Fig. 4b) indicating that only a small amount of QDs (<5%) can be homogenously dispersed in DLCs. When the doping concentration of CdTe QD is increased to 7%, the aggregation is increased which can be seen in POM (ESI, Fig. S2).
image file: c4ra12211a-f4.tif
Fig. 4 Polarizing optical microscope image of the columnar phase of (a) 1% CdTe QDs/HAT4 and (b) 5% CdTe QDs/HAT4 at 120 °C (crossed polarizers).

4.4. Differential scanning calorimetry (DSC) studies

Fig. 5 shows the DSC plots for the HAT4, 1% CdTe QDs/HAT4 and 5% CdTe QDs/HAT5 composites recorded at a rate of 10 °C min−1. As can be seen that the dispersion of QDs does not impart much effect on melting transition but the mesophase to isotropic phase transition becomes broad and shifts to lower values. The enthalpy of the crystal to mesophase phase transition in 1% CdTe/HAT4 is decreases from 36.07 J g−1 to 26.858 J g−1 and from 32.639 J g−1 to 7.69 J g−1 for mesophase to isotropic phase. Similar trend was observed in the other composite (Table 1). As this transition (mesophase to isotropic phase) is associated with the packing of aromatic cores, the dispersion of spherical QDs disturbs the order in the columnar phase which was also confirmed from XRD results.
image file: c4ra12211a-f5.tif
Fig. 5 DSC curve of undoped HAT4 (black), 1% CdTe QDs/HAT4 (red) and 5% CdTe QDs/HAT4 (blue).
Table 1 Phase transition temperature in °C and associated enthalpy changes (J g−1, in parentheses) of undoped DLC and QDs doped composites. Cr = crystal, Colhp = columnar hexagonal plastic mesophase, I = isotropic
Thermal transition (°C)
Composites Heating scan/enthalpy (J g−1)
HAT4 Cr 91.69 (36.07) Colhp 147.19 I (32.64)
1% CdTe QDs/HAT4 Cr 91.35 (26.86) Colhp 130.54 I (7.69)
5% CdTe QDs/HAT4 Cr 90.70 (26.12) Colhp 132.06 I (7.91)


4.5. Small angle X-ray scattering (SAXS)

The small angle X-ray diffraction patterns were recorded for pure HAT4, 1% CdTe QDs/HAT4 and 5% CdTe QDs/HAT4 composites under the same conditions at 110 °C to further study of liquid crystalline phase. One dimensional intensity vs. 2θ for composites are shown in Fig. 6. In the small angle region the diffraction peaks in both nanocomposites follow the typical Bragg diffractions of hexabutyloxytriphenylene DLC which correspond to columnar hexagonal plastic phase (Colhp phase). This confirms that the columnar hexagonal plastic order is retained after the addition of CdTe QDs. The core–core separation of HAT4 is 3.46 Å and in composites we found that, due to insertion of octadecylamine capped CdTe quantum dots, the core–core separation is slightly increased and is about 3.50 Å and 3.51 Å for 1% CdTe QDs/HAT4 and 5% CdTe QDs/HAT5 respectively. Similar results were recently reported by us in the study of CdSe quantum dots in LC matrix.36 The results clearly indicates that the hexagonal columnar plastic lattice of HAT4 discotic is unaffected by the insertion of semiconductor quantum dots, albeit the core–core separation increases slightly by the insertion of quantum dots at both concentrations.
image file: c4ra12211a-f6.tif
Fig. 6 Intensity vs. 2θ plots for (a) HAT4 and 1% CdTe QDs/HAT4 and (b) HAT4 and 5% CdTe QDs/HAT4 at 110 °C.

4.6. DC conductivity studies

Measurements of the DC conductivity was carried out using a DC voltage source (0.5 V), Keithley Picometer (modal 480) along with a temperature controller. The samples were placed into an ITO conductivity cell through capillary action. The cell thickness was 7 μm adjusted by a Mylar foil. The resistance values are based on the current value with effect of temperature.

The temperature dependant DC conductivity measurements of the pure compound and nanocomposites were measured by a four-point probe to examine effect of CdTe quantum dots on the electrical properties of DLC. Generally the conductivity of pure HAT4 compound is very low and in the order of 10−8 to 10−10 S m−1. The conductivity plots shown in Fig. 7 show the variation in the conductivity of nanocomposites of DLCs with temperature. The doped nanocomposites show enhancement in the conductivity to the order of two to four. It is observed that the electrical conductivity of 1% CdTe/HAT4 and 5% CdTe/HAT4 at columnar plastic phase is 2.18 × 10⁻⁶ S m−1 and 2.34 × 10⁻⁴ S m−1, respectively. The enhancement in the conductivity can be ascribed due to the formation of electron donor–acceptor interaction between electron rich triphenylene and the semiconductor quantum dots that will effectively translocate the π electrons from discotic to quantum dot to discotic. Spherical QDs get dispersed randomly in between discs due to donor–acceptor type of interaction (Fig. 8). These results are in accordance to our previously published results on gold NPs and CdSe QDs doped DLCs.34–36


image file: c4ra12211a-f7.tif
Fig. 7 The DC conductivity values as a function of temperature for the undoped HAT4 (blue), 1% CdTe QDs/HAT4 (red) and 5% CdTe QDs/HAT4 (black) nanocomposites.

image file: c4ra12211a-f8.tif
Fig. 8 Schematic illustration of self-assembly of ODA capped CdTe QDs in a columnar matrix of discotic mesogens.

5. Conclusion

In conclusion, we have observed that the dispersion of CdTe quantum dots in DLCs show higher conductivity compared to the pure compound. The POM, DSC and SAXS studies reveals that the doping of CdTe quantum dots into discotic liquid crystals does not disturb the nature of mesophase with different concentration variations but minor shift in the transition temperature is observed. The core–core separation also increases slightly due to the insertion of spherical QDs. Hybrid composites of these liquid crystals possess high conductivity compared to pure DLC. The enhanced conductivity makes CdTe doped HAT4 DLC a potential candidate for thin film transistors, LED's, and organic solar cell applications.

Acknowledgements

We thank Mrs K. N. Vasudha for her technical support in the characterization of the samples.

References

  1. S. Kumar, Isr. J. Chem., 2012, 52, 820 CrossRef CAS.
  2. S. Chen and S. H. Eichhorn, Isr. J. Chem., 2012, 52, 830 CrossRef CAS.
  3. S. K. Pal, S. Setia, B. S. Avinash and S. Kumar, Liq. Cryst., 2013, 40, 1769 CrossRef CAS.
  4. H. K. Bisoyi and S. Kumar, Liq. Cryst., 2011, 38, 1427 CrossRef CAS.
  5. R. J. Bushby and K. Kawata, Liq. Cryst., 2011, 38, 1415 CrossRef CAS.
  6. B. R. Kaafarani, Chem. Mater., 2011, 23, 378 CrossRef CAS.
  7. W. Pisula, X. Feng and K. Mullen, Chem. Mater., 2011, 23, 554 CrossRef CAS.
  8. H. K. Bisoyi and S. Kumar, Chem. Soc. Rev., 2010, 39, 264 RSC.
  9. S. Kumar, Liq. Cryst., 2009, 36, 607 CrossRef CAS.
  10. S. Kumar, Liq. Cryst. Today, 2009, 18, 2 CrossRef CAS.
  11. J. W. Goodby, I. M. Saez, S. J. Cowling, V. Gortz, M. Draper, A. W. Hall, S. Sia, G. Cosquer, S. E. Lee and E. P. Raynes, Angew. Chem., Int. Ed., 2008, 47, 2754 CrossRef CAS PubMed.
  12. S. Kumar, Phase Transitions, 2008, 81, 113 CrossRef CAS.
  13. S. Sergeyev, W. Pisula and Y. H. Geerts, Chem. Soc. Rev., 2007, 36, 1902 RSC.
  14. J. Wu, W. Pisula and K. Mullen, Chem. Rev., 2007, 107, 718 CrossRef CAS PubMed.
  15. S. Laschat, A. Baro, N. Steinke, F. Giesselmann, C. Hagele, G. Scalia, R. Judele, E. Kapatsina, S. Sauer, A. Schreivogel and M. Tosoni, Angew. Chem., Int. Ed., 2007, 46, 4832 CrossRef CAS PubMed.
  16. T. Kato, N. Mizoshita and K. Kishimoto, Angew. Chem., Int. Ed., 2006, 45, 38 CrossRef CAS PubMed.
  17. S. Kumar, Chem. Soc. Rev., 2006, 35, 83 RSC.
  18. S. Kumar, Liq. Cryst., 2005, 32, 1089 CrossRef CAS.
  19. S. Kumar, Liq. Cryst., 2004, 31, 1037 CrossRef CAS.
  20. N. Boden, R. J. Bushby, A. N. Cammidge, J. Clements and R. Luo, Mol. Cryst. Liq. Cryst., 1995, 261, 251 CrossRef CAS.
  21. M. A. Hines and P. Guyot-Sionnest, J. Phys. Chem. B, 1998, 102, 3655 CrossRef CAS.
  22. U. T. D. Thuy, P. S. Toan, T. T. K. Chi, D. D. Khang and N. Q. Liem, Adv. Nat. Sci.: Nanosci. Nanotechnol., 2010, 1, 045009 CrossRef.
  23. W. C. W. Chen and S. Nie, Science, 1998, 281, 2016 CrossRef.
  24. T. H. Nguyen, T. D. T. Ung, T. H. Vu, T. K. C. Tran, V. Q. Dong, D. K. Dinh and Q. L. Nguyen, Adv. Nat. Sci.: Nanosci. Nanotechnol., 2012, 3, 035014 CrossRef.
  25. S. V. Kershaw, M. Harrison, A. L. Rogach and A. Kornowski, IEEE J. Sel. Top. Quantum Electron., 2000, 6, 534 CrossRef CAS.
  26. D. V. Talapin, A. L. Rogach, E. V. Shevchenko, A. Kornowski, M. Haase and H. Weller, J. Am. Chem. Soc., 2002, 124, 5782 CrossRef CAS PubMed.
  27. C. B. Murray, D. J. Norris and M. G. Bawendi, J. Am. Chem. Soc., 1993, 115, 8706 CrossRef CAS.
  28. Y. Xia and C. Zhu, Analyst, 2008, 133, 928 RSC.
  29. S. F. Wuister, C. de mello Donega and A. Meijerink, J. Am. Chem. Soc., 2004, 126, 10397 CrossRef CAS PubMed.
  30. J. M. Tsay, M. Pflughoefft, L. A. Bentolila and S. Weiss, J. Am. Chem. Soc., 2004, 126, 1926 CrossRef CAS PubMed.
  31. D. V. Talapin, S. Haubold, A. L. Rogach, A. Kornowski, M. Haase and H. Weller, J. Phys. Chem. B, 2001, 105, 2260 CrossRef CAS.
  32. N. Gaponik, D. V. Talapin, A. L. Rogach, K. Hoppe, E. V. Shevchenko, A. Kornowski, A. Eychmuller and H. Weller, J. Phys. Chem. B, 2002, 106, 7177 CrossRef CAS.
  33. S. F. Wuister, I. Swart, F. V. Driel, S. G. Hickey and C. D. M. Donega, Nano Lett., 2003, 3, 503 CrossRef CAS.
  34. S. Kumar and V. Lakshminarayanan, Chem. Commun., 2004, 1600 RSC.
  35. S. Kumar, S. Pal, P. S. Kumar and V. Lakshminarayanan, Soft Matter, 2007, 3, 896 RSC.
  36. S. Kumar and L. Sagar, Chem. Commun., 2011, 47, 12182 RSC.
  37. S. Kumar and H. K. Bisoyi, Angew. Chem., Int. Ed., 2007, 46, 1501 CrossRef CAS PubMed.
  38. H. K. Bisoyi and S. Kumar, J. Mater. Chem., 2008, 18, 3032 RSC.
  39. A. B. Shivanandareddy, S. Krishnamurthy, V. Lakshminarayanan and S. Kumar, Chem. Commun., 2014, 50, 710 RSC.
  40. C. Xue, K. G. -Cuevas, M. Gao, A. Urbas and Q. Li, J. Phys. Chem. C, 2013, 117, 21603 CAS.
  41. L. Wang, H. Dong, Y. Li, C. Xue, L. D. Sun, C. H. Yan and Q. Li, J. Am. Chem. Soc., 2014, 136, 4480 CrossRef CAS PubMed.
  42. H. K. Bisoyi and Q. Li, Acc. Chem. Res., 2014, 47, 3184 CrossRef CAS PubMed.
  43. Nanoscience with Liquid Crystals: From Self-organized Nanostructures to Applications, ed. Q. Li, Springer, 2014 Search PubMed.
  44. X. Lan, S. Masala and E. H. Sargent, Nat. Mater., 2014, 13, 233 CrossRef CAS PubMed.
  45. F. Tan, S. Qu, F. Li, Q. Jiang, C. Chen, W. Zhang and Z. Wang, Nanoscale Res. Lett., 2013, 8, 434 CrossRef PubMed.
  46. L. Etgar, Materials, 2013, 6, 445 CrossRef CAS PubMed.
  47. I. S. Ren, L. Y. Chang, S. K. Lim, J. Zhao, M. Smith, N. Zhao, V. Bulovi, M. Bawendi and S. Gradecak, Nano Lett., 2011, 11, 3998 CrossRef PubMed.
  48. J. H. Bang and P. V. Kamat, ACS Nano, 2009, 3, 1467 CrossRef CAS PubMed.
  49. A. Badawi, N. Al-Hosiny, S. Abdallah, S. Negm and H. Talaat, Sol. Energy, 2013, 88, 137 CrossRef CAS PubMed.
  50. X. Y. Yu, B. X. Lei, D. B. Kuang and C. Y. Sua, Chem. Sci., 2011, 2, 1396 RSC.
  51. S. Kumar and M. Manickam, J. Chem. Soc., Chem. Commun., 1997, 17, 1615 RSC.
  52. Y. S. Xia and C. Cao, J. Lumin., 2008, 128, 166 CrossRef CAS PubMed.

Footnote

Electronic supplementary information (ESI) available. See DOI: 10.1039/c4ra12211a

This journal is © The Royal Society of Chemistry 2015
Click here to see how this site uses Cookies. View our privacy policy here.