
Unraveling the nature of Turkevich gold nanoparticles: the unexpected role of the dicarboxyketone species†
Daniel Grasseschi,
Rômulo A. Ando,
Henrique E. Toma and
Vitor M. Zamarion*
Instituto de Química, Universidade de São Paulo, Caixa Postal 26077, CEP 05513-970, São Paulo, SP, Brazil. E-mail: zamarion@iq.usp.br
First published on 15th December 2014
Abstract
By monitoring the synthesis of the Turkevich gold nanoparticles, under appropriate conditions, it was possible to probe the formation of the dicarboxyketone intermediate species, revealing their unexpected strong interaction with the gold nanoparticles. The dicarboxyketone species exhibited a contrasting spectral and kinetics behaviour in relation to citrate stabilized products, explaining several existing controversial points, such as the lack of reproducibility and variable SERS response. In these species, because of the covalent interaction, the chemical mechanisms involved in SERS predominate over the electromagnetic contribution observed for the citrate stabilized gold nanoparticles. New interesting aspects were found, such as a greater stabilization and strong SERS response observed even for the non-aggregated nanoparticles.
Introduction
From the several methods available in the literature for the synthesis of gold nanoparticles, such as that developed by Brust et al.1 in organic media, and those involving anisotropic systems,2–8 the method of Turkevich et al.9,10 with some slight modifications by Frens,11 remains yet the most preferred one for preparation of spherical gold nanoparticles in aqueous solution. As a matter of fact, Turkevich et al.9,10 were the first ones to demonstrate the possibility of changing the particles size, by controlling the concentration of the reducing agent and the temperature of the reaction.9 Since then, their method has been extensively employed, and preferred for involving simple reagents and procedures; however, the products prepared by different laboratories can exhibit distinct spectral and kinetics behaviour, complicating their use as SERS probes. Many authors have been concerned with this problem12–35 but at the present time, there are still questions to be answered, requiring further investigation on the mechanisms involved.12–35In the literature, citrate is reported to play three different key roles, as: reducing agent, surface stabilizing agent and pH mediator.21 Accordingly, it has been possible to control the size and shape of AuNP by changing the citrate/gold salt concentration ratio, temperature and stirring rates. For example, S. Biggs et al.12 investigated how the anionic species can influence the surface properties during the AuNPs formation, by using atomic force microscopy (AFM). These authors have monitored the gold–gold forces during the nucleation process and found out a preferential and more attractive force between gold-citrate, instead of gold-chloride. The work of Xiaohui et al.21 showed that by controlling the proportion between citrate and gold salt reagents, the shape of the particles can involve not only spheres, but also wires. The same authors observed that citrate can modify the pH of the system, and hence, the gold complex precursor for the synthesis. In addition, the theoretical work of Ojea-Jiménez et al.35 has shown that pH is another important factor influencing the reaction pathways.
Systematic studies concerning reproducibility aspects have been carried out, including the evaluation of the proper addition of reagents,33 the use of specific glassware34 and calibration curves.36 Pei et al.17 and Liu et al.27 observed the formation of chains of gold atoms, instead of spheres, as predicted by Turkevich9 in one of the steps of the nanoparticles nucleation and growth. This led to Boon-Kin Pong et al.23 to realize that the nucleation and growth mechanism proposed by LaMer37 does not explain how the gold nanoparticles are formed, during the several stages of synthesis and staining. They were able to isolate the steps comprising every change of colour during the particles formation, however, with no guess on the actual mechanism involved.
Based on the kinetic studies encompassing the ion [AuCl4]− in redox processes,24 Ojea-Jiménez et al.38 reported a mechanism where the citrate anion replaces chloride in a fast step, forming the corresponding [AuCl3(C6H5O7)]− complex. After successive rearrangements, a dicarboxyketone intermediary can be formed as the major oxidation product from the citrate ion. The authors also proposed the formation of a complex between the resulting Au(I) species and the dicarboxyketone molecules present in solution. Such species are expected to play an important role in the disproportionation of the aurous species and the formation of Au(0) atoms. In addition, Kumar et al.39 proposed a kinetic model of nucleation and growth, associated with the dicarboxyketone degradation.
As a matter of fact, in all the studies, dicarboxyketone has been considered an unstable molecule, hard to isolate and detect, particularly at the high temperatures employed in the synthesis. Its decomposition leads to acetone and acetoacetate.13,26,39
In this work, we have focused on the SERS response of the Turkevich nanoparticles generated at a low citrate/gold ratio, aiming the elucidation of the role of the dicarboxyketone species in the synthesis. To our surprise, the dicarboxyketone product generated from the oxidation of the citrate ion, interacted very strongly with the gold nanoparticles, which became greatly stabilized, exhibiting enhanced Raman signals, even in the absence of aggregation. This contrasting behaviour in relation to the citrate stabilized gold nanoparticles, is a completely new aspect, capable of explaining some of the irreproducibility problems associated with the slower ligand exchange kinetics promoted by the strong binding of the dicarboxyketone species. This discovery also raised another important question: How relevant is the chemical mechanism, i.e., how significant should be the interaction between the surface and the molecule to account for large SERS enhancement factors?
Experimental section
Synthesis
All glassware were previously cleaned with aqua regia (3HCl![[thin space (1/6-em)]](https://www.rsc.org/images/entities/char_2009.gif) :1HNO3), in order to prevent any possible influence of contaminants in the gold reduction process. Two stock solutions have been prepared: a sodium citrate solution (0.038 mol L−1) and a HAuCl4 solution (5.08 × 10⁻⁴ mol L−1). The syntheses were performed, by starting with 50 mL of gold solution in a 125 mL round bottom flask, and refluxing, using a computer controlled system, for keeping the temperature (±1 °C) and stirring rates constants. The conditions employed for the synthesis were carefully planned, in order to generate nanoparticles of similar sizes (as detailed in the Discussion section). In the case of the synthesis of citrate stabilized gold nanoparticles (cit-AuNP), 1.7 mL of the citrate solution was added at a rate of 100 μL s−1 (2.5:1 mol ratio), while the mechanical stirring and temperature were kept constant, at 900 rpm and 100 °C, respectively. In the synthesis of the dicarboxyketone coated nanoparticles, (ket-AuNP), 0.9 mL of citrate ions (1.3:1 mol ratio) was added at 1000 μL s−1, and the stirring rates and temperature were kept at 1150 rpm, and 95 °C, respectively. After 30 min, the solutions were cooled to room temperature, and kept in the refrigerator.
:1HNO3), in order to prevent any possible influence of contaminants in the gold reduction process. Two stock solutions have been prepared: a sodium citrate solution (0.038 mol L−1) and a HAuCl4 solution (5.08 × 10⁻⁴ mol L−1). The syntheses were performed, by starting with 50 mL of gold solution in a 125 mL round bottom flask, and refluxing, using a computer controlled system, for keeping the temperature (±1 °C) and stirring rates constants. The conditions employed for the synthesis were carefully planned, in order to generate nanoparticles of similar sizes (as detailed in the Discussion section). In the case of the synthesis of citrate stabilized gold nanoparticles (cit-AuNP), 1.7 mL of the citrate solution was added at a rate of 100 μL s−1 (2.5:1 mol ratio), while the mechanical stirring and temperature were kept constant, at 900 rpm and 100 °C, respectively. In the synthesis of the dicarboxyketone coated nanoparticles, (ket-AuNP), 0.9 mL of citrate ions (1.3:1 mol ratio) was added at 1000 μL s−1, and the stirring rates and temperature were kept at 1150 rpm, and 95 °C, respectively. After 30 min, the solutions were cooled to room temperature, and kept in the refrigerator.
Instrumentation
The electronic spectra were recorded on a Hewllet Packard 8453A diode-array spectrophotometer. Raman and SERS spectra were recorded on an InPhotonics portable instrument, equipped with a diode laser emitting at 785 nm, covering the range of 350–2060 cm−1. A WITec Confocal Raman Microscope, equipped with Ar, Nd:YAG and He–Ne lasers, was used to record the Raman spectra, at 488, 532 and 633 nm respectively. The mass spectra were obtained using a Bruker Daltonics MicroTOF mass spectrometer.Calculations
Molecular modeling calculations were performed using the Gaussian 09W software. The ground state geometries and the vibrational spectra were carried out employing density functional theory (DFT)40,41 with B3LYP hybrid functional42 (Becke's gradient-corrected exchange correlation43 in conjunction with the Lee–Yang–Parr correlation functional with three parameters44). The basis set was 6-311G++(d,p) (scale factor of 0.964 according to the literature45,46). Molecular modeling, vibrational spectra and time-dependent density functional theory (TD-DFT) calculations involving the Au20 cluster47–49 was performed using the keyword gen employing the BP86 functional with a 6-311G++(d,p) basis set for C, N and H atoms and LANL2DZ for the gold atom, with their relativistic pseudopotential for the inner shell electrons. In the TD-DFT calculations only the singlet excited states were considered. The assignment of the vibrational spectra was carried out using Gaussview 05 and Gabedit 2.4.0 softwares.Results and discussion
Cit-AuNP and ket-AuNP characterization
Considering that the Turkevich method is strongly dependent on the concentration, temperature and stirring rates, a microprocessed system has been specially constructed and programmed (see ESI†), in order to allow a precise control of such variables, and to generate nanoparticles of comparable sizes, in a reproducible way. In this way, the use of slower stirring rates and dropwise addition (100 μL s−1) of citrate were compensated by increasing the amount of this reagent. Conversely, a faster stirring rate was combined with a single addition (1000 μL s−1) of more diluted citrate ions.In order to evaluate this point, we first investigated the composition of the adsorbed species at the nanoparticles surface by adding 4-mercaptopyridine (mpy, 1 × 10⁻⁴ mol L−1) to the gold nanoparticles, at room temperature. This organic thiol exhibits a great affinity for gold, and is capable of replacing most of the species usually adsorbed at the gold nanoparticles, such as the citrate ion and its derivatives. After centrifugation, the supernatants were analysed by mass spectrometry, as shown in Fig. 1. From the synthesis carried out under nearly stoichiometric proportions, in addition to the mass peak at 190.9 ascribed to citrate ions (Fig. 1a), there was a mass peak at 144.9, which can be unequivocally ascribed to the dicarboxyketone species. In the alternative experiment, using citrate ions in excess, there was no evidence of dicarboxyketone in the mass spectra (Fig. 1b). The particles were then, named as cit-AuNPs and ket-AuNPs, with citrate and ketone, respectively, on the surface.
 | ||
| Fig. 1 Mass spectrum of the supernatant of: ket-AuNP (A) and cit-AuNP (B) suspensions, after the surface exchange with 4-Mpy. The mass in 190.9 corresponds to citrate, while the mass in 144.9 corresponds to dicarboxyketone. The mass peak at 111 can be a citrate fragment or some unbound 4-Mpy, which has the same mass (see ESI†). | ||
The presence of dicarboxyketone on the surface of AuNPs was really surprising, because, to the best of our knowledge, the SERS response of dicarboxyketone has never been observed before in the classical Turkevich synthesis. Since this species does not survive in the free form at the boiling temperatures employed for the synthesis, its detection implies a stabilizing effect from the gold nanoparticles. Presumably, by carrying out a single addition of the citrate ions, the rapid formation of the gold nanoparticles can provide the necessary support for anchoring the in situ generated dicarboxyketone species, leading to the corresponding stabilized particles. In the alternative experiment, by carrying out a drop wise addition of citrate ions, the formation of the gold nanoparticles is retarded in such a way, that most of the freshly generated dicarboxyketone species undergo thermal decomposition before they can bind to the gold nanoparticles.
By working under nearly stoichiometric conditions, the formation of the dicarboxyketone product was expected to be maximized, once all the citrate consumed in the redox reaction would be converted into product. However, the detection of the free form could be complicated by its intrinsic instability, particularly at the high temperatures employed in the synthesis. Surprisingly, after mixing (at once) the reagents, the resulting nanoparticles, exhibiting the characteristic surface plasmon band at 534 nm (Fig. 2C), was proven very stable, while exhibiting strong SERS signals.
 | ||
| Fig. 2 SEM images of (A) ket-AuNP and (B) cit-AuNP, and (C) their corresponding extinction spectra. | ||
SERS studies
SERS is the most preferred strategy to characterize the surface of plasmonic nanoparticles. A better understanding of how the molecular properties can increase the SERS enhancement factors is of great relevance, particularly for developing more specific molecular probes.The SERS effect is normally discussed in terms of the electromagnetic (EM), resonance Raman (RR) and charge-transfer (CT) mechanisms. The first one is based on the intensification of the local electric field as a consequence of the coupling between the oscillating electric fields of the incident photons and the surface plasmons. It is usually associated with the presence of the so-called “hot spots” or special regions of enhanced electromagnetic fields in nanostructured surfaces or aggregated nanoparticles. The intensification by the RR mechanism, also referred as SERRS, is related to the enhanced polarizability attained by molecular species as a consequence of the excitation of allowed molecular electronic transitions, under the influence of the electromagnetic radiation and the plasmon field. In the CT mechanism, the covalence degree and charge delocalization on the nanoparticle/molecule system have a direct influence on the SERS effect.
When the molecule–nanoparticle bonding is essentially non-covalent, the metal cluster can only disturb the electronic structure of the adsorbed molecules by means of electrostatic interactions, causing a slight change of polarizability. In contrast, in highly covalent systems, such as those involving thiol–gold bonds, the occurrence of charge-transfer (CT) interactions can become very effective, increasing the SERS effect.
When the three mechanisms (EM, RR, and CT) are involved, the observed SERS effects can be treated as an unified phenomenon and described by an unified theory, as recently proposed by Lombardi and Birke.50,51 In the unified formalism, the polarizability transition moment is given by eqn (1), where the terms in the denominator account for each one of associated mechanisms.
 | (1) |
The first one, corresponding to the EM mechanism, includes the dielectric functions of the metallic nanoparticle [ε1(ω) and ε2] and surrounding chemical environment (εm), and is minimized (i.e., the effect is maximized) at the plasmon resonance band. The second term involves the charge-transfer interactions between the nanoparticle Fermi level (F) and the electronic states (K) of the molecules attached to the surface. The third term accounts for the resonance Raman effect of the adsorbed molecules, and this contribution is maximized when the excitation laser is in resonance with a totally allowed electronic transition involving the ground (I) and an excited (K) molecular state.
The numerator is the product of the transition moments for the adsorbed molecules (μki), the nanoparticle–molecule charge-transfer (μFK), the Herzberg–Teller term hIF = 〈I|∂H/∂Q|F〉 and the vibrational integral 〈i|Qk|f〉, thus defining the selections rules. As pointed out by Lombardi and Birke, these are quite stringent for intensification of a given Raman vibrational mode by SERS effect since implies that all four terms must be nonzero. Furthermore, the oscillating electric field of isolated nanoparticles shows an r−3 dependence, where r is distance from the nanosphere centre, so that the effect is essentially confined to the nanoparticle surface. Therefore, only the vibrational modes of molecules located very close to the nanoparticles surface can be significantly coupled with the exciting radiation, and be enhanced.31,43
It should be mentioned that recent theoretical studies are pointing a new, non resonant chemical mechanism (CHEM) for SERS, involving the electronic delocalization and enhanced polarizability in the nanoparticle–ligand system.48,52,53 This mechanism arises from relaxation of the molecular electronic structure due to the ground state interactions among the ligand, the metallic surface and the local chemical environment around the molecule.
The SERS spectra of non-aggregated ket-AuNP, recorded at several excitation wavelengths, can be seen in Fig. 3. In general, for spherical nanoparticles, the SERS effect has been associated with the influence of “hot spots”, which are located at the confluence region of the nanoparticles plasmon fields in the aggregated systems. Such influence has a dramatic role in the electromagnetic mechanism of SERS and requires a resonance between the exciting radiation and the plasmon resonance band. However, the strong SERS signals observed for the non-aggregated ket-AuNPs departed from this expectation, because of the lack of such local “hot spots”. In contrast, under similar conditions, no evidence of SERS effect has been detected for the corresponding cit-AuNPs.
 | ||
| Fig. 3 SERS spectra of non-aggregated ket-AuNPs using different excitation lasers. (A) 785 nm; (B) 633 nm; (C) 532 nm. Integration time of 120 seconds and laser power of 50 mW. | ||
The wavelength dependence of the SERS effect in Fig. 3 shows some contrasting aspects, which cannot be interpreted in terms of a general electromagnetic mechanism. Since the dicarboxyketone species alone are not expected to exhibit electronic bands in the visible region, the contribution of the RR mechanism can promptly be discarded. Therefore, the strong SERS spectra observed at 633 and 785 nm, can only be interpreted in terms of the charge-transfer mechanism, involving excitations in the ket-AuNP system (CT mechanism), or by assuming a non-resonant chemical mechanism, based on the enhanced polarizability expected from ground state interactions between the ligand and the metallic nanoparticles.
As a matter of fact, the dicarboxyketone molecule exhibits HOMO and LUMO levels capable of interacting with the nanoparticles atoms (Fig. S5†), and promoting charge-transfer excitations at the Fermi level. The existence of a keto-enol equilibrium for dicarboxyketone can become particularly relevant in the discussion of the interaction modes with the metal atoms, as indicated in Fig. 4, and on the possible contribution of a chemical mechanism to the SERS effect.
 | ||
| Fig. 4 Keto-enolic equilibrium for the dicarboxyketone molecule. | ||
The enol form is expected to coordinate more strongly, because of its delocalized electronic structure and the availability of carbon donor atoms capable of interacting with transition metal ions. Molecular orbital calculations carried out in this work for the dicarboxyenol species, showed that the HOMO level is mainly localized at the carbon atoms from the double bond, while the LUMO is concentrated on the C–O bonds (Fig. S5†).
Therefore, the interaction with the gold atoms may be governed by the frontier orbital involving the C![[double bond, length as m-dash]](https://www.rsc.org/images/entities/char_e001.gif) C bond of the enol form. In fact, theoretical calculations of the Au20–enol structure confirmed the Au–C bond formation via the molecular orbital localized on the enol CC bond (HOMO). However, as a consequence of this interaction, a higher polarizability is also predicted for Au20–enol system, compared with the free molecule (Table 1).
C bond of the enol form. In fact, theoretical calculations of the Au20–enol structure confirmed the Au–C bond formation via the molecular orbital localized on the enol CC bond (HOMO). However, as a consequence of this interaction, a higher polarizability is also predicted for Au20–enol system, compared with the free molecule (Table 1).
| αxx | αxy | αyy | αxz | αyz | αzz | HOMO–LUMO gap | |
|---|---|---|---|---|---|---|---|
| Au20–enol | 831.402 | 3.80 | 793.458 | 24.932 | 30.475 | 903.733 | 0.06809 |
| Free enol | 113.685 | 3.960 | 79.266 | 2.145 | 1.119 | 52.592 | 0.20473 |
Ground state interactions between the ligand and the metal cluster are rather plausible and occur independently of any excitation in the system. This enhanced polarizability can lead to an enhancement of the Raman scattering by a non resonant chemical mechanism. The enhancement factor can be estimated by the fourth power of the ratio between the HOMO–LUMO gap in the free molecule and in the Au20–enol system.53 An approximated enhancement factor of 80 was calculated, and this could be one of the reasons for the high intensity of the Raman scattering measured experimentally. Systems considering pyridine derivatives, N2, CO, CS and NH3 as ligand and Ag20 cluster show an enhancement factor for the CHEM mechanism typically less than 50, depending of the substituent in the “para” position of the pyridine ring and the capacity of back-bound formation.53
The relative high value found for the Au20–enol system indicates a delocalized electronic density due to the presence of the π system in the enol form, contributing to a stronger Au–C bond and leading to an enhanced polarizability. However, in spite of the large number of theoretical attempts to explain the interactions between the adsorbate or ligand, and the metallic clusters47–49,53–55 their characteristics are yet not clear, and one cannot easily account for their real contribution to the transition polarizability moment.
On the other hand, the CT mechanism depends on the existence of optical excitations between the AuNP and the ligand. According to TD-DFT calculations carried out for this system there is a CT transition in the range of 500 to 800 nm, from the HOMO level, exhibiting significant contribution of the enol CC double bond, to a triple degenerated LUMO orbital localized in the gold cluster, (Fig. 5 and S9†).
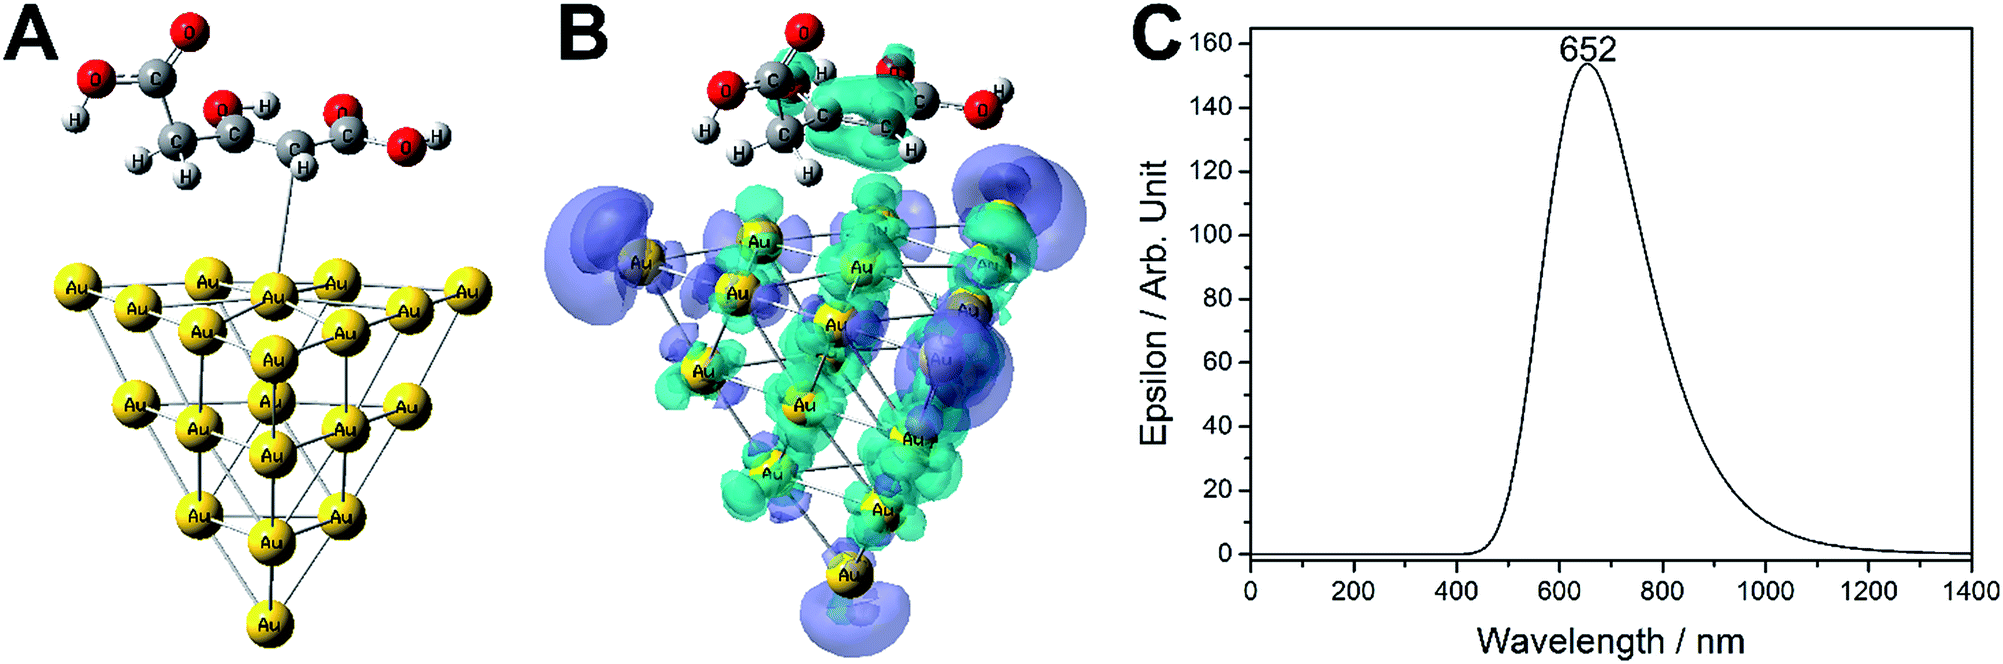 | ||
| Fig. 5 (A) Optimized structure (B) representation charge transfer state for the Au20–enol system. The blue surfaces represents where the electrons are coming from and the purple surface represents where they are going. (C) Electronic spectrum calculated by TD-DFT considering only the first three singlet states. | ||
Using the electron density difference method56 to highlight the differences in the charge distribution between the ground state and the excited electronic states, one can visualize the electronic changes accompanying the transition. Considering the first three excited states involved in the transition, the charge transfer state shows the electrons moving from the enol π system to the metallic clusters, and a charge reorganization due the intracluster transition.56,57
The charge for the excited states is localized at the cluster tips; for large nanoparticles this phenomena is known as the lighting rod effect and have been proved by discrete dipole approximation (DDA).58
In contrast, for the Au20–citrate species, the calculated electronic transitions showed more pronounced charge reorganization involving an intracluster transition, rather than a charge transfer excitation (Fig. S12†). The smaller ligand contribution for the excited state, explains the observed results, explaining the lack of SERS response in the non-aggregated form.
On the other hand, for the ket-AuNPs the theoretical and experimental evidence confirm that the interaction between the enol and the gold surface is governed by the frontier orbital localized at the enol CC bound, giving rise to a charge-transfer transition. This leads to a more pronounced enhancement of the SERS signal due the maximization of the CT term in the eqn (1), when the excitation wavelength is 633 or 785 nm.
At 633 nm, although the excitation is in a pre-resonance condition with the AuNP plasmon band, it is in full resonance with the charge-transfer transition, contributing to a large enhancement of the SERS signals (Fig. 5). Therefore, at this wavelength, the simultaneous contribution of the EM, CT and CHEM mechanism is rather plausible. Comparatively, at 785 nm, the SERS signals are not so strong as at 633 nm, since the excitation wavelength departs even more from the AuNP plasmon band, in spite of being in pre-resonance with the expected charge-transfer transition.
At 532 nm, the laser is in resonance with the surface plasmon absorption of the isolated particles but it is far from resonance with the charge-transfer band. In this case, no SERS spectrum has been observed for the ket-AuNP system, indicating that the electromagnetic mechanism is not being effective, due the lack of resonance with the charge transfer transition and high value of the gold imaginary dielectric constant at this wavelength. Therefore, in this work we are showing a unique case of colloidal system, in which the charge transfer contribution is manifesting independently from the EM contribution.
SERS spectra of the aggregated systems
Since the isolated cit-AuNPs do not exhibit significant SERS signals, in order to compare with the ket-AuNP system, it is necessary to promote the nanoparticles aggregation, e.g. by changing the ionic strength. In Fig. 6 one can see the SERS spectra of cit-AuNP and ket-AuNP acquired after aggregating with 1.0 and 1.2 mmol L−1 NaCl. (The extinction spectra were supplied in Fig. S13†.) | ||
| Fig. 6 Comparison between SERS spectra of aggregated cit-AuNP (up) and ket-AuNP (down). The ionic strength of both suspensions were increased with the addition of 100 μL NaCl 1 mol L−1 λexc = 785 nm. | ||
For cit-AuNP the interaction between the citrate molecules and the gold surface atoms is predominantly electrostatic, and one cannot expect any observable, low energy molecular or charge-transfer transition. The SERS spectra in this case, can only be observed by inducing the nanoparticles aggregation, in order to generate hot spots and a plasmon-coupling band above 700 nm. However, the SERS spectra of the cit-AuNP aggregated nanoparticles are already well known in the literature13 and will not be discussed here.
The EM mechanism becomes relevant in aggregated systems, and generally leads to an enhancement of the spectra as a whole. Therefore, it is not surprising that at 785 nm, the spectral profile (Fig. 6) observed for ket-AuNP was similar to that obtained without aggregation (Fig. 3).
As expected, in the aggregated system, however, the observed intensity was larger than for the isolated nanoparticles, due to the simultaneous contribution of EM, CT and CHEM mechanisms for the SERS effect. For the isolated nanoparticles only the CT and CHEM mechanisms were relevant.
Table 2 shows a comparison between SERS spectrum of ket-AuNPs and theoretical Raman spectrum of dicarboxyenol distorted in one of the carboxylates, Fig. 5. The other forms calculated, including the theoretical Raman spectrum of ketone form and a detailed vibrational analysis, can be found in ESI.†
| ket-AuNP SERS | Distorted enol | Assignment |
|---|---|---|
| a ν = streching, δ = bending, ip = in plane, op = out-of-plane, iph = in-phase, oph = out-of-phase, sym = symmetric, as = asymmetric. | ||
| νC1O13 + δC1O12H13ip |
||
| νC8O15 (vs) + δO14H10ip |
||
| 1579 | 1592 | νO10C1O11ass |
| δO11H12ip + νC5C6(w) |
||
| 1557 | νC5C6 + 2(δO11,14H12,10)ip |
|
| 1492 | νC5C6 + νC8–O13 + δC6H7 |
|
| 1469 | νC8–O13 + νC5C6 + CH2sci(w) |
|
| 1442 | νC8O15 (vw) + δO14H10 |
|
| CH2sci + νC6–C8 + δC5C6H7 + νC5–C9 | ||
| 1392 | CH2sci | |
| 1369 | 1345 | δC5C6H7 + CH2twist |
| 1271 | 1291 | δO11C1O10 + νC1–C2 |
| CH2wagg + δC8C6H7 (vw) | ||
| 1231 | 2(νC1,8–O11,14) + 2(νC1,6–C2,8) + 2CH2wagg + δO14,11H10,12 | |
| 1206 | CH2wagg + νC6–C8 + νC8–O10 | |
| 1145 | CH2twist | |
| 1124 | 1122 | νC8O11 + νC5–O9 + νC6–C8 + CH2twist |
| δC8C6H7 + CH2twist | ||
| δO11H12op | ||
| 1004 | νC2–C5 + 2(νC5,8–O9,14) + CH2rock(vw) | |
| 944 | νC2–C5 + νC6–C8 + CH2rock | |
| 928 | 2νC5,8–O9,14 + CH2rock (s) | |
| CH2rock + νC8–O14 + δC2C5C6 | ||
| 855 | νC1–C2 + νC8–O14 + νC1–O11 + δO13C1O11 | |
| 808 | 844 | νC1–C2 + δO11C1O10 + δC2C5C6op |
| 768 | δlong chain oph,op | |
| δlong chain ip + δO11H12ip + δO14H10op | ||
| 744 | δlong chain iph,op | |
| 718 | δC6H7op + δ ring | |
| 680 | δC6H7op | |
| 662 | δlong chainip + δO12C8O13ip | |
| δO14C8O15ip + δO13C1O11ip + δO6C5C2ip |
||
| 600 | δlong chainop + CH2twist | |
| 2(δO14,11C8,1O15,13)oph | ||
| 584 | CH2rock + δO9C5Cop + δO10C1O11op | |
| 546 | δO12C8O13ip + δO10C1O11op(w) | |
| 521 | δC6C5C2C1(op) |
|
| 508 | CH2rock + δC6C5C2 |
|
| δO15C8C6 + δO9C5C6 |
||
| 435 | δO13C8C6ip + δO9C5C6ip + CH2rock(vw) |
|
| δO13C1C2 + δO9C5–C2 | ||
| 380 | 375 | CH2rock + δC6C5C2 (w) + δC5C6C8 (vw) |
Ligand exchange kinetics for ket-AuNP and cit-AuNP
Another contrasting aspect between ket-AuNP and cit-AuNP is their kinetics behaviour. As a matter of fact, the chemistry of the metal nanoparticles is essentially controlled by the surface atoms, which exhibit external orbitals available for binding donor–acceptor ligands. Then, in many aspects, there is a similarity between the metal nanoparticles and their metal complexes, allowing to extend the Pearson's hard-soft acid–base principles59–61 and the thermodynamic concepts from the frontier molecular orbitals developed by Klopman.62,63Therefore, the interaction between the citrate ions and gold surface atoms should be governed by electrostatic interactions, since citrate has a hard-base nature. On the other hand, the coordination of dicarboxyketone should exhibit a greater covalent character. Then, the ligand exchange reaction in aqueous media is expected to be slower in the case of ket-AuNPs than for the cit-AuNPs.
In order to probe the differences in the binding characteristics of the citrate and dicarboxyketone ligands, 4-mercaptopyridine (4-mpy) was employed in the substitution kinetics, because of its strong affinity to gold atoms. As a matter of fact, the addition of an aqueous solution of 4-mpy (pH 6.5) to the gold nanoparticles led to the replacement of the cit and ket ligands, followed by the agglomeration of the products, giving rise to a plasmon coupling band above 700 nm (Fig. 7).
 | ||
| Fig. 7 Exchange ligand experiment showing the replacement of (A) dicarboxyketone and (B) citrate by the 4-mercaptopyridine (4-mpy) ligand. (C) Kinetic curves, monitored by following the plasmon coupling bands during the ligand exchange reaction. | ||
The substitution kinetics for ket-AuNPs was slower than for cit-AuNPs, reflecting a stronger interaction between dicarboxyketone and the gold surface. The plasmon coupling band positions were also quite different in the two cases, e.g. 790 nm for the ket-AuNP and 696 nm for the cit-AuNP, suggesting that the aggregation process is proceeding by distinct pathways.
Conclusions
By controlling the amount and addition rates of citrate ions to the HACl4 solutions, one can generate distinct AuNPs stabilized with citrate or dicarboxyketone species, exhibiting contrasting SERS response and substitution kinetics.A stronger interaction of dicarboxyketone with the gold surface resulted from the higher electronic delocalization and polarizability in the AuNP–enol complex, enabling a charge-transfer transition between the HOMO (localized in the enol group) and the LUMO (localized at the gold cluster). This contributed to the observed increase in the SERS response for ket-AuNP, in relation to cit-AuNP.
The SERS spectra of ket-AuNP could be obtained even in the absence of aggregation and far from the resonance condition with the plasmon band (e.g. at 785 nm), illustrating an unusual case of enhancement promoted essentially by the CT and the non-resonant Chemical Mechanism.
Acknowledgements
The financial support from FAPESP, CNPq, NAP-NN and PETROBRAS is gratefully acknowledged. We thank Dr Meloni, G. N. for his help in building the microprocessed system, which provided a fine temperature control, making the particles synthesis extremely reproducible.Notes and references
- M. Brust, M. Walker, D. Bethell, D. J. Schiffrin and R. Whyman, J. Chem. Soc., Chem. Commun., 1994, 801 RSC.
- C. J. Murphy, T. K. Sau, A. M. Gole, C. J. Orendorff, J. Gao, L. Gou, S. E. Hunyadi and T. Li, J. Phys. Chem. B, 2005, 109, 13857–13870 CrossRef CAS PubMed.
- B. Nikoobakht and M. A. El-Sayed, Chem. Mater., 2003, 15, 1957–1962 CrossRef CAS.
- R. Jin, Y. Cao, C. A. Mirkin, K. L. Kelly, G. C. Schatz and J. G. Zheng, Science, 2001, 294, 1901–1903 CrossRef CAS PubMed.
- M. A. El-Sayed, Acc. Chem. Res., 2001, 34, 257–264 CrossRef CAS PubMed.
- S. E. Skrabalak, J. Chen, Y. Sun, X. Lu, L. Au, C. M. Cobley and Y. Xia, Acc. Chem. Res., 2008, 41, 1587–1595 CrossRef CAS PubMed.
- J. S. DuChene, W. Niu, J. M. Abendroth, Q. Sun, W. Zhao, F. Huo and W. D. Wei, Chem. Mater., 2013, 25, 1392–1399 CrossRef CAS.
- J. Pérez-Juste, I. Pastoriza-Santos, L. Liz-Marzán and P. Mulvaney, Coord. Chem. Rev., 2005, 249, 1870–1901 CrossRef PubMed.
- J. Turkevich, P. C. Stevenson and J. Hillier, Discuss. Faraday Soc., 1951, 11, 55–75 RSC.
- J. Turkevich, P. Stevenson and J. Hillier, J. Phys. Chem., 1953, 57, 670 CrossRef CAS.
- G. Frens, Nature Phys. Sci., 1973, 241, 20 CrossRef CAS.
- S. Biggs, P. Mulvaney, C. F. Zukoski and F. Grieser, J. Am. Chem. Soc., 1994, 116, 9150–9157 CrossRef CAS.
- C. H. Munro, W. E. Smith, M. Garner, J. Clarkson and P. C. White, Langmuir, 1995, 11, 3712–3720 CrossRef CAS.
- A. Henglein and M. Giersig, J. Phys. Chem. B, 1999, 103, 9533–9539 CrossRef CAS.
- C. D. Keating, M. D. Musick, M. H. Keefe and M. J. Natan, J. Chem. Educ., 1999, 76, 949 CrossRef CAS.
- K. R. Brown, D. G. Walter and M. J. Natan, Chem. Mater., 2000, 12, 306–313 CrossRef CAS.
- L. Pei, K. Mori and M. Adachi, Langmuir, 2004, 20, 7837 CrossRef CAS PubMed.
- R. A. Alvarez-Puebla, E. Arceo, P. J. G. Goulet, J. J. Garrido and R. F. Aroca, J. Phys. Chem. B, 2005, 109, 3787–3792 CrossRef CAS PubMed.
- J. Kimling, M. Maier, B. Okenve, V. Kotaidis, H. Ballot and A. Plech, J. Phys. Chem. B, 2006, 110, 15700–15707 CrossRef CAS PubMed.
- T. Wang, R. Zheng, X. Hu, L. Zhang and S. Dong, J. Phys. Chem. B, 2006, 110, 14179–14185 CrossRef CAS PubMed.
- X. Ji, X. Song, J. Li, Y. Bai, W. Yang and X. Peng, J. Am. Chem. Soc., 2007, 129, 13939–13948 CrossRef CAS PubMed.
- S. Kumar, K. S. Gandhi and R. Kumar, Ind. Eng. Chem. Res., 2007, 46, 3128–3136 CrossRef CAS.
- B.-K. Pong, H. I. Elim, J.-X. Chong, W. Ji, B. L. Trout and J.-Y. Lee, J. Phys. Chem. C, 2007, 111, 6281 CAS.
- V. Soni, R. S. Sindal and R. N. Mehrotra, Inorg. Chim. Acta, 2007, 360, 3141 CrossRef CAS PubMed.
- W. Patungwasa and J. H. Hodak, Mater. Chem. Phys., 2008, 108, 45–54 CrossRef CAS PubMed.
- X. Wu, P. L. Redmond, H. Liu, Y. Chen, M. Steigerwald and L. Brus, J. Am. Chem. Soc., 2008, 130, 9500 CrossRef CAS PubMed.
- Z. Liu, Y. Zu and S. Guo, Appl. Surf. Sci., 2009, 255, 5827 CrossRef CAS PubMed.
- J. Polte, T. T. Ahner, F. Delissen, S. Sokolov, F. Emmerling, A. F. Thünemann and R. Kraehnert, J. Am. Chem. Soc., 2010, 132, 1296–1301 CrossRef CAS PubMed.
- H. Xia, S. Bai, J. Hartmann and D. Wang, Langmuir, 2010, 26, 3585–3589 CrossRef CAS PubMed.
- N. G. Bastús, J. Comenge and V. Puntes, Langmuir, 2011, 27, 11098–11105 CrossRef PubMed.
- N. Durante, A. Fortunelli, M. Broyer and M. Stener, J. Phys. Chem. C, 2011, 6277–6282 CAS.
- C. Li, D. Li, G. Wan, J. Xu and W. Hou, Nanoscale Res. Lett., 2011, 6, 440 CrossRef PubMed.
- I. Ojea-Jim, N. G. Bast and V. Puntes, J. Phys. Chem. C, 2011, 2, 15752 Search PubMed.
- A. A. Volkert, V. Subramaniam and A. J. Haes, Chem. Commun., 2011, 47, 478 RSC.
- I. Ojea-Jiménez and J. M. Campanera, J. Phys. Chem. C, 2012, 116, 23682 Search PubMed.
- D. Ghosh, D. Sarkar, A. Girigoswami and N. Chattopadhyay, J. Nanosci. Nanotechnol., 2011, 11, 1141 CrossRef CAS PubMed.
- V. K. LaMer and R. H. Dinegar, J. Am. Chem. Soc., 1950, 72, 4847 CrossRef CAS.
- I. Ojea-Jime, F. M. Romero, N. G. Bastu and V. Puntes, J. Phys. Chem. C, 2010, 114, 1800 Search PubMed.
- S. Kumar, K. S. Gandhi and R. Kumar, Ind. Eng. Chem. Res., 2007, 46, 3128 CrossRef CAS.
- P. Hohenberg and W. Kohn, Phys. Rev. B: Solid State, 1964, 136, 864 Search PubMed.
- W. Kohn and L. J. Sham, Phys. Rev. B: Solid State, 1965, 140, A1133 Search PubMed.
- A. D. Becke, J. Chem. Phys., 1997, 107, 8554 CrossRef CAS PubMed.
- A. D. Becke, J. Chem. Phys., 1993, 98, 5648 CrossRef CAS PubMed.
- C. Lee, C. Hill and N. Carolina, Phys. Rev. B: Condens. Matter Mater. Phys., 1988, 37, 785 CrossRef CAS.
- M. P. Andersson and P. Uvdal, J. Phys. Chem. A, 2005, 2, 2937 CrossRef PubMed.
- M. K. Subramanian, P. M. Anbarasan and S. Manimegalai, Pramana, 2010, 74, 845 CrossRef CAS.
- X. Zhao and M. Chen, J. Raman Spectrosc., 2014, 45, 62–67 CrossRef CAS.
- L. Jensen, L. L. Zhao and G. C. Schatz, J. Phys. Chem. C, 2007, 111, 4756–4764 CAS.
- L. L. Zhao, L. Jensen and G. C. Schatz, J. Am. Chem. Soc., 2006, 128, 2911–2919 CrossRef CAS PubMed.
- J. R. Lombardi and R. L. Birke, J. Phys. Chem. C, 2008, 112, 5605–5617 CAS.
- J. R. Lombardi and R. L. Birke, Acc. Chem. Res., 2009, 42, 734–742 CrossRef CAS PubMed.
- L. Jensen, C. M. Aikens and G. C. Schatz, Chem. Soc. Rev., 2008, 37, 1061–1073 RSC.
- J. E. Moore, S. M. Morton and L. Jensen, J. Phys. Chem. Lett., 2012, 3, 2470–2475 CrossRef CAS.
- W.-X. Pan, Y.-C. Lai, R.-X. Wang, D.-J. Zhang and J.-H. Zhan, J. Raman Spectrosc., 2014, 45, 54–61 CrossRef CAS.
- L. L. Zhao, L. Jensen and G. C. Schatz, Nano Lett., 2006, 6, 1229–1234 CrossRef CAS PubMed.
- J. Luo, P. Wang and Y. Fang, Vib. Spectrosc., 2014, 70, 162–167 CrossRef CAS PubMed.
- R. W. Burgess and V. J. Keast, J. Phys. Chem. C, 2014, 118, 3194–3201 CAS.
- W. Hermoso, T. V. Alves, C. C. S. de Oliveira, E. G. Moriya, F. R. Ornellas and P. H. C. Camargo, Chem. Phys., 2013, 423, 142–150 CrossRef CAS PubMed.
- R. G. Pearson, J. Am. Chem. Soc., 1963, 85, 3533–3539 CrossRef CAS.
- R. G. Pearson, Proc. Natl. Acad. Sci. U. S. A., 1986, 83, 8440–8441 CrossRef CAS.
- R. G. Parr and R. G. Pearson, J. Am. Chem. Soc., 1983, 105, 7512–7516 CrossRef CAS.
- G. Klopman, Chem. Phys. Lett., 1967, 1, 200–202 CrossRef CAS.
- G. Klopman, J. Am. Chem. Soc., 1968, 90, 223–234 CrossRef CAS.
Footnote |
| † Electronic supplementary information (ESI) available. See DOI: 10.1039/c4ra12161a |
| This journal is © The Royal Society of Chemistry 2015 |