
 Open Access Article
 This Open Access Article is licensed under a Creative Commons Attribution-Non Commercial 3.0 Unported Licence
Understanding aggregation-based assays: nature of protein corona and number of epitopes on antigen matters†
Eugenia Li Ling
Yeo
a,
Anthony Jin Shun
Chua
bc,
Krupakar
Parthasarathy
bd,
Hui Yu
Yeo
b,
Mah Lee
Ng
bc and
James Chen Yong
Kah
*a
aNanomedicine & Nanorobotics Laboratory, Department of Biomedical Engineering, National University of Singapore, 9 Engineering Drive 1, EA-03-12, Singapore 117575. E-mail: biekahj@nus.edu.sg
bFlavivirology Laboratory, Department of Microbiology, Yong Loo Lin School of Medicine, National University Health System, National University of Singapore, 5 Science Drive 2, MD4 Level 3, Singapore 117545
cNUS Graduate School for Integrative Sciences and Engineering, National University of Singapore, Centre for Life Sciences (CeLS), 28 Medical Drive, #05-01, Singapore 117456
dCentre for Drug Discovery and Development, Sathyabama University, Jeppiaar Nagar, Rajiv Gandhi Road, Chennai-600 119, Tamilnadu, India
First published on 12th January 2015
Abstract
The development of assays that exploit aggregation of gold nanoparticles (NPs) has been widely studied for detection of biomolecules in diagnostics. These assays are often based on antibody–antigen interactions to mediate aggregation of NPs. However, the protein parameters underlying the performance of these assays are not well understood. In this study, we systematically examine how the nature of the protein corona on the NPs, formed from either antibody or antigen, and how the number of binding sites or epitopes on the antigen affect aggregation. We selected two small antigen proteins: 13 kDa recombinant dengue viral envelope domain III protein with a polyhistidine tag (DIII-His), and 19 kDa vascular endothelial growth factor A (VEGFA), to form protein corona around NPs and study the aggregation induced by their monoclonal and polyclonal antibodies. We then reciprocated the systems to form protein corona with the antibodies and compared the aggregation induced by the antigens. We showed that the nature of the protein corona matters, as the corona formed from antigens had lower limits of detection and elicited greater degrees of NP aggregation compared to the corona formed from antibodies. Furthermore, the number of epitopes on the antigen matters, as polyclonal antibodies, which target multiple epitopes on the antigen, were able to induce aggregation for both antigen- and antibody-corona systems. In contrast, monoclonal antibodies that target a single epitope on the antigens induced aggregation for the antigen-corona system only. Our results showed that an understanding of the antibody–antigen system is crucial for establishing guidelines for rational selection of proteins in the design of aggregation-based assays with NPs.
Introduction
Conventional protein analytical techniques used to detect and quantify specific proteins, such as enzyme-linked immunosorbent assays (ELISA) and immunoblotting, have found applications in the detection of disease markers and drug development. Despite their high sensitivities and accuracies, these assays are slow and laborious, requiring numerous washing steps and costly reagents.1 Thus, there has been interest in developing alternative methods for the rapid detection and quantification of proteins.In recent years, advances in nanotechnology have resulted in the development of colorimetric assays based on the aggregation of gold nanoparticles (NPs). Mirkin et al. first demonstrated the use of NPs conjugated to thiol-modified single-stranded DNA as a highly specific polynucleotide probe. The NP probes aggregated rapidly in the presence of target DNA to produce a color change.2 Other groups extended the technique further to detect a wide variety of biologically relevant molecules ranging from DNA3–8 and proteins,1,9–12 to other small biomolecules13–15 and aqueous metal ions.16,17 Aggregation-based colorimetric assays using NPs offer the advantages of convenience, specificity and speed, while employing relatively inexpensive reagents.1,6,10,18
NPs possess several characteristic optical properties arising from their surface plasmon resonance (SPR). These include a strong optical absorbance peak, typically at ∼520 nm, that is highly sensitive to changes in inter-particle separation.7,12,19,20 Upon NP aggregation, this absorbance peak red-shifts and broadens.8,20,21 Depending on the NP concentration and extent of aggregation, this change may be readily observed by the naked eye, as the color changes from red to dark blue or gray.8,12,21
NP aggregation is in turn affected by their surface chemistry. NPs are relatively unstable and aggregate rapidly in the presence of salt. This occurs at salt concentrations even lower than that of blood plasma and other biological fluids.22
Fortunately, NPs also possess a facile surface chemistry for biofunctionalization via covalent and non-covalent conjugation with a wide range of biomolecules. A common method for preparing biofunctionalized NPs is the one-step addition of proteins to NPs to spontaneously form a protein corona around the NPs.23,24 Binding between proteins and the NP surface occurs through a combination of passive adsorption due to electrostatic and hydrophobic interactions, or co-ordinate bonding between the NPs and thiol or amine groups in the proteins.9,25–29 Although the protein corona is frequently regarded as an impediment to other surface functions of NPs,30,31 it has been exploited to improve the colloidal stability of NPs,29,32,33 facilitate the loading and triggered release of drugs from NPs,34,35 and modulate cellular responses.33
Here, we exploit the protein corona on NPs to perform aggregation-based probing of target analytes. The protein corona can be formed from antibodies bound to the NP surface. In the presence of target antigens, antibody–antigen interactions cause the NPs to aggregate and elicit a measurable colorimetric response (Scheme 1A). Aggregation is also possible with an antigen corona formed around the NPs instead, to probe for the presence of its corresponding antibody (Scheme 1B). The versatility of such an aggregation-based probing assay is useful in some diseases such as dengue infection, where it is possible to detect either the viral protein antigen, or the antibody that is produced in biological fluids as a result of the infection.
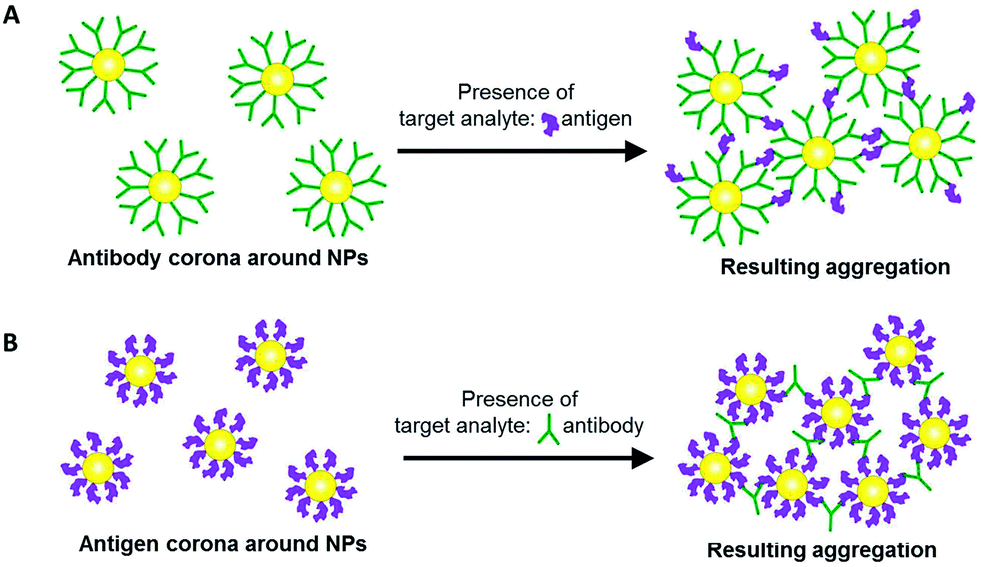 | ||
| Scheme 1 Two possible approaches in aggregation-based colorimetric probing of a target analyte based on (A) antigen-induced, and (B) antibody-induced aggregation of gold nanoparticles (NPs) with the protein corona formed from antibody and antigen, respectively. | ||
While this aggregation-based concept of detection is not new, the underlying mechanisms, knowledge of which will lead to effective design of the assay, are not thoroughly understood. Current detection limits of aggregation assays are poor (∼ng mL−1)27 compared to existing commercial assays (e.g. ELISA, ∼pg mL−1).36 Rational design and selection of proteins forming the corona as effectors of aggregation may potentially lead to an optimized assay with improved sensitivity.
Here, we study how the nature of the protein corona and the number of epitopes on the antigen affect NP aggregation. We used two small antigen molecules, 19 kDa vascular endothelial growth factor A (VEGFA) and 13 kDa recombinant dengue viral envelope domain III protein with a poly-histidine tag (DIII-His), to form an antigen corona around NPs i.e. NP-VEGFA and NP-DIII-His, respectively. DIII protein of dengue has been reported as a diagnostic molecule to capture dengue virus-specific antibodies generated from dengue infection,37 while VEGFA was reported to be a prognostic biomarker of potentially life-threatening dengue hemorrhagic fever (DHF) and dengue shock syndrome (DSS).38–40 In a dengue infection, both DIII (as part of the virus) and VEGFA as well as their respective antibodies are elevated in the serum of patients, thereby allowing us to detect either the antigen or the antibody. It is with this motivation that we have chosen DIII-His and VEGFA as our proteins-of-interest in this study. The aggregation of NPs was induced by adding corresponding antibodies (anti-DIII and anti-VEGFA). The reciprocal systems were also studied by forming an antibody corona around the NPs (NP-anti-DIII and NP-anti-VEGFA) and aggregation was induced with their respective antigens. The kinetics of the aggregation-based assays for each approach were characterized and compared.
Our results showed that the nature of the protein corona and the number of epitopes on the antigen affected both the functionality and sensitivity of the assay. For diseases such as dengue infection, our study provides evidence that the protein corona formed from antigens to detect antibodies provides lower limits of detection due to a higher degree of NP aggregation. This understanding of the antibody–antigen system is crucial to establish guidelines for rational selection of proteins to form the corona for NP aggregation, as well as the optimization of aggregation-based assays with NPs. This may eventually lead to a more effective assay design compared to the present “hit or miss” approach in the selection of appropriate NP surface biomolecules to induce aggregation.
Materials and methods
All reagents were purchased from Sigma Aldrich unless specified otherwise. Milli-Q water with a resistivity of 18.2 MΩ cm was used for all experiments.Synthesis and characterization of NPs
The NPs were synthesized using a previously established method.41 Briefly, 100 mL of 1 mM hydrochloroauric acid (HAuCl4) was heated to boiling. 15 mL of 38.8 mM trisodium citrate was added to the solution under vigorous stirring. Boiling was continued for 15 min and the solution was observed to turn from pale yellow to purple before finally forming a deep red NP colloid. The citrate-capped NP colloid was washed twice through centrifugation at 10![[thin space (1/6-em)]](https://www.rsc.org/images/entities/char_2009.gif) 000 rpm for 15 min and diluted 10× for subsequent experiments. The optical properties of the NPs were characterized by UV-Vis spectroscopy (UV-2450, Shimadzu, Japan). Their zeta potential and hydrodynamic diameter (DH) were measured at 25 °C using a Zetasizer (Nano ZS, Malvern, UK), and their morphology characterized using transmission electron microscopy (TEM) (JEM-1220, JEOL Ltd., Japan). The concentration of the NPs was determined by optical absorption. The synthesized NPs were kept at room temperature (25 °C) until further experiments.
000 rpm for 15 min and diluted 10× for subsequent experiments. The optical properties of the NPs were characterized by UV-Vis spectroscopy (UV-2450, Shimadzu, Japan). Their zeta potential and hydrodynamic diameter (DH) were measured at 25 °C using a Zetasizer (Nano ZS, Malvern, UK), and their morphology characterized using transmission electron microscopy (TEM) (JEM-1220, JEOL Ltd., Japan). The concentration of the NPs was determined by optical absorption. The synthesized NPs were kept at room temperature (25 °C) until further experiments.
Protein and pH titrations for optimum protein binding
Protein titration was performed on six proteins to determine the minimum protecting amount (MPA) of protein required to form a corona around the NPs that was sufficient to stabilize them from salt induced aggregation. These proteins include DIII-His and VEGFA antigens (Thermo Scientific), anti-His mouse monoclonal (ClonTech) and anti-VEGFA mouse monoclonal antibodies (mAb) (Thermo Scientific), and anti-DIII mouse polyclonal and anti-VEGFA rabbit polyclonal antibodies (pAb) (Thermo Scientific). The N-terminal hexa-histidine-tagged recombinant DIII protein from the envelope glycoprotein of dengue virus serotype 2 was expressed and purified as described previously42,43 (see ESI, Fig. S1†). The anti-DIII pAb was generated by mixing both anti-His mAb and 3H5 mAb (Millipore, binds to a different epitope on DIII) in a 1:1 ratio.
The amount of protein added to 500 μL of diluted NP colloid varied from 0 to 6 μg for DIII-His, 0 to 0.8 μg for VEGFA, 0 to 6 μg for anti-His mAb and 0 to 3 μg for the remaining antibodies. The mixtures were incubated at 37 °C for 15 min to allow the protein corona to form around the NPs spontaneously. A NaCl flocculation test was then performed by adding 100 μL of 1 M NaCl to induce aggregation of the NPs, and their colloidal stability was probed by absorption spectroscopy.
pH titration was performed to determine the optimum pH for binding of proteins to the NPs. 0.1 M hydrochloric acid and potassium hydroxide were used to vary the pH of 500 μL of NP colloid from pH 2 to 12 before the MPA of the protein (determined from protein titration) was added and the solution incubated at 37 °C for 15 min. 100 μL of 1 M NaCl was added to each sample to induce aggregation of the NPs before their UV-Vis extinction spectrum was acquired to determine their level of aggregation. For the antibodies, pH titration was performed for anti-His mAb and anti-VEGFA pAb. The same optimal pH was used for anti-DIII pAb and anti-VEGFA mAb in subsequent experiments.
Quantification of colloidal stability
To quantify the colloidal stability of the NPs and corona-coated NPs (NP-corona), an aggregation index (AI) was calculated from the ratio of NP absorbance at 585 nm to 525 nm44i.e.
The SPR absorbance peak of the isolated NPs varied slightly depending on whether they were corona-coated, and the protein used to form the corona. Typically, the intensity at ∼525 nm correlated to the concentration of NPs. Salt-induced NP aggregation would cause a red-shift in the peak absorbance accompanied by a broadening of the absorbance spectrum, thus making the NP’s absorbance at 585 nm sensitive to aggregation.45 Normalization to the absorbance at 525 nm allows us to quantify NP aggregation in a concentration-independent manner. A high AI value corresponds to a high degree of aggregation. The AI was examined as a function of protein concentration and pH in our titration studies.
Preparation of stable NPs with protein corona
The MPA of protein (DIII-His, VEGFA, monoclonal anti-His, polyclonal anti-DIII and monoclonal and polyclonal anti-VEGFA antibodies) was added to the NPs at the optimum pH determined, and incubated at 37 °C for 15 min to allow formation of their respective protein corona. Excess unbound proteins were removed by suspending 500 μL of NP-corona in water and centrifugation at 8000 rpm for 30 min.Kinetics of aggregation-based assay
Aggregation of NP-corona by target analytes was examined in separate wells of a 96-well microplate. Target analytes (either corresponding antigen or antibody target) were added at varying concentrations to 250 μL of NP-corona and incubated at 37 °C for 1 h to induce aggregation. Polyclonal mouse IgG antibody (0.4 mg mL−1, Santa Cruz) was used as a negative control target for NPs with antigen corona, while bovine serum albumin (BSA) (2 mg mL−1, Thermo Scientific) was used as a negative control target for NPs with antibody corona. Both control targets were added at the same concentrations as the target analytes. Longitudinal changes in UV-Vis absorption spectra were acquired at 10 min intervals for 2 h following incubation, and the AI was examined as a function of target analyte concentration and incubation time.Results and discussion
Synthesis and characterization of NPs
The synthesized NPs formed a red colloid with an absorbance peak at 519 nm in the UV-Vis absorbance spectrum (Fig. 1A). The stable isolated NPs had a much lower A585 than A525 and this resulted in a low aggregation index (AI). The isolated NPs also had a mean DH of 16.3 ± 0.5 nm as determined from dynamic light scattering (DLS) experiments (Fig. 1B). TEM images showed that the isolated NPs were highly uniform and monodisperse (Fig. 1C). The NP concentration was typically 0.77 nM after 10× dilution. In the absence of protein corona, the citrate-capped NPs aggregated instantaneously in 100 mM NaCl, causing the red colloid to turn dark blue (Fig. 1D). The absorbance peak was no longer observable at 519 nm, and a much higher A585 than A525 resulted in an increased AI, which indicated NP aggregation. The mean DH of these aggregates increased to 922.2 ± 45.5 nm (Fig. 1E) and individual NPs were no longer visually discernible under TEM (Fig. 1F).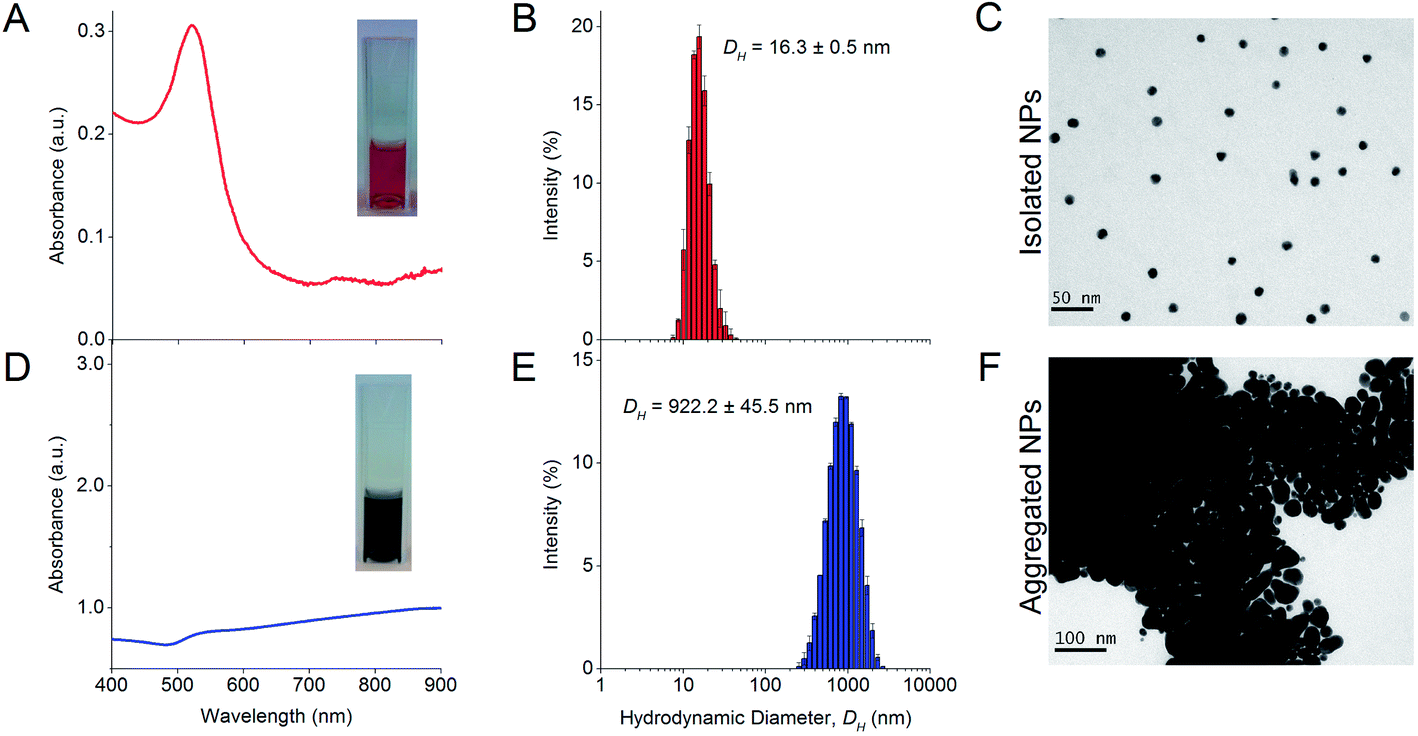 | ||
| Fig. 1 Characterization of isolated NPs showing the (A) UV-Vis absorption spectrum, (B) hydrodynamic diameter (DH) distribution measured by dynamic light scattering (DLS), and (C) TEM micrograph. The NPs are generally mono-dispersed and spherical (mean DH = 16.3 ± 0.5 nm), produce a sharp peak in the UV-Vis spectrum (λSPR = 519 nm) and form a red colloid. This is in contrast to the (D) UV-Vis absorption spectrum, (E) DH, and (F) TEM micrograph of aggregated NPs in the presence of 100 mM NaCl. Individual NPs can no longer be discerned visually from the TEM micrograph as the particles overlay one another to form 3-dimensional aggregates. The solution turns dark blue, and the absorbance peak decreases sharply and is red-shifted. The aggregates have a mean DH = 922.2 ± 45.5 nm as obtained from DLS. The colloidal solutions of isolated and aggregated NPs are shown as inserts in their respective UV-Vis spectra. | ||
Theoretical estimates of DIII-His, VEGFA, and antibody packing density on NPs
We first obtained theoretical estimates of the packing density (i.e. protein:NP molar ratio) of DIII-His, VEGFA, and the four antibodies (anti-His mAb, anti-DIII pAb, anti-VEGFA mAb and anti-VEGFA pAb) required to form a monolayer on the surface of individual NPs. A higher packing density means more antigens or antibodies are loaded onto each NP. This translates into more binding sites for the target analyte, and higher sensitivities in aggregation-based assays.
The size and structure of the proteins used in this study were scaled in comparison to the NPs (Fig. 2). Dimensions of DIII-His and VEGFA were predicted using moleman2,46–48 a program for manipulation and analysis of Protein Data Bank (PDB) files. Moleman2 gives details on the dimensions of proteins, distance distribution, average temperature factor statistics and other plots such as the Ramachandran plot, distance plot, and temperature factor plot. At 13 kDa, DIII-His was the smallest protein molecule in our study (Fig. 2A). We estimated the packing density of DIII-His on the NP surface during spontaneous corona formation by modeling DIII-His as a cylinder (diameter ∼3.25 nm) and assuming that it self-assembles on the NP radially to form a monolayer with maximum packing density (Fig. 2E). These assumptions gave DIII-His a footprint of 8.3 nm2, and a maximum packing density of ∼101 DIII-His/NP. VEGFA is only slightly larger at 22 kDa, but it forms a homodimer resulting in a larger diameter of ∼6.6 nm (Fig. 2B), and should therefore possess a larger footprint (34.2 nm2) and lower packing density (∼24 VEGFA/NP).
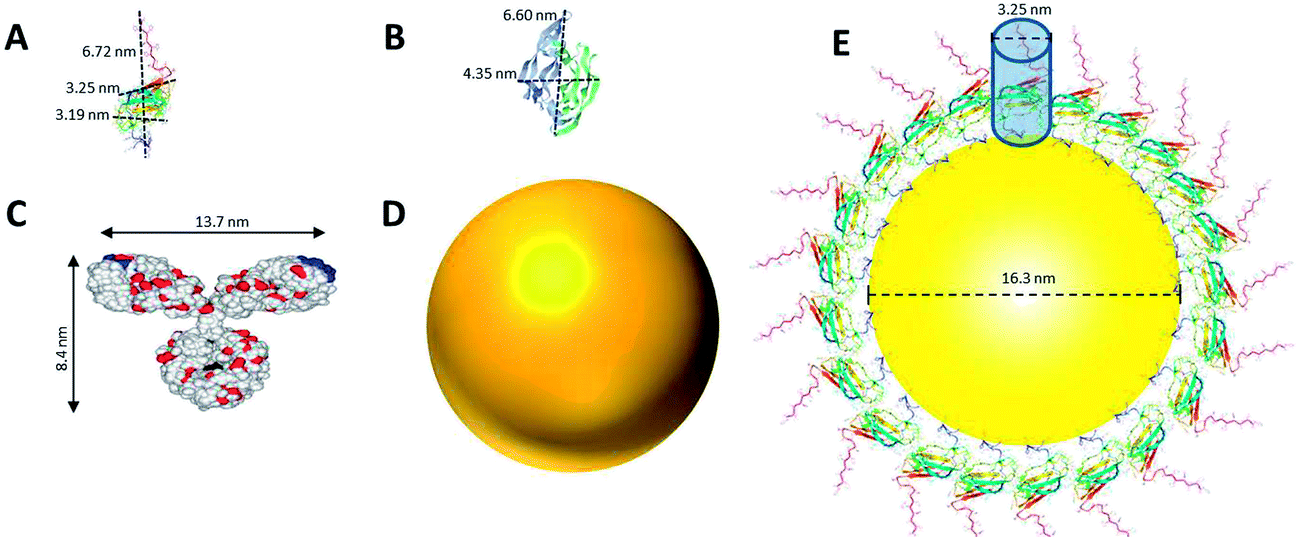 | ||
| Fig. 2 Comparison of the structure and size of (A) DIII-His, (B) VEGFA, and (C) IgG (which represents anti-His mAb, anti-DIII pAb, and anti-VEGFA mAb and pAb), to that of (D) a NP synthesized in this study. The size of all three proteins and a NP are drawn in proportion to one another. (E) An estimate of the packing of DIII-His on a NP’s surface by modeling DIII-His as a cylinder and assuming that it self-assembles on the NP radially to form a monolayer to achieve maximum packing density. (B) and (C) are adapted with permission from published references.49,50 | ||
The structure of a typical IgG antibody (Fig. 2C) was used to represent all the antibodies used in this study. If we model the 150 kDa IgG as a cylinder (diameter ∼ 8.4 nm), it would have a footprint (55.4 nm2) more than 6 times larger than DIII-His and consequently a lower packing density (∼15 IgG/NP). These differences in size, structure and packing density have important implications in the performance of aggregation-based assays employing different proteins to form protein corona.
While these calculations provided approximations of the number of protein molecules that could bind to the NPs to form monolayers, binding of the proteins onto the NP surface would be less ordered and more stochastic in reality. It would involve non-specific electrostatic attractions and other non-covalent interactions, and could occur in different orientations to form the corona. It is therefore expected that the actual average footprints and monolayer packing densities would deviate from the calculated estimates above.
Protein titration
The amount of protein on the NPs is an important parameter for proper functionality of the aggregation assay. Aggregation of NPs occurs in the presence of electrolytes if too little protein is adsorbed onto the NP surface. We therefore performed protein titration to determine the minimum protecting amount (MPA) of protein, which is the amount of protein required to maintain colloidal stability of the NPs in the presence of electrolytes. This would minimize adding an unnecessary excess amount of protein, and reduce the amount of excess unbound protein after washing, thus increasing the assay sensitivity as free protein that compete with the NP-corona for binding to target analytes would be reduced to the minimum.51,52 The MPA determined empirically was subsequently used to form the NP-corona for the aggregation assay.The AI of the NPs after salt-induced aggregation was plotted as a function of the amount of protein added to the NPs. Sigmoidal protein titration curves were obtained for all six proteins in this study (Fig. 3). When a small amount of protein was added, the adsorbed protein was unable to provide the NPs with sufficient steric stabilization against salt-induced aggregation. This resulted in a high AI of ≥1 for all six proteins. As the amount of protein added increased, more protein was adsorbed onto the NPs to stabilize them. The AI continued to decrease until it eventually reached a minimum of ∼0.5. Here, the proteins reached the MPA needed to form the corona and provide steric stabilization to the NPs in the presence of electrolytes.
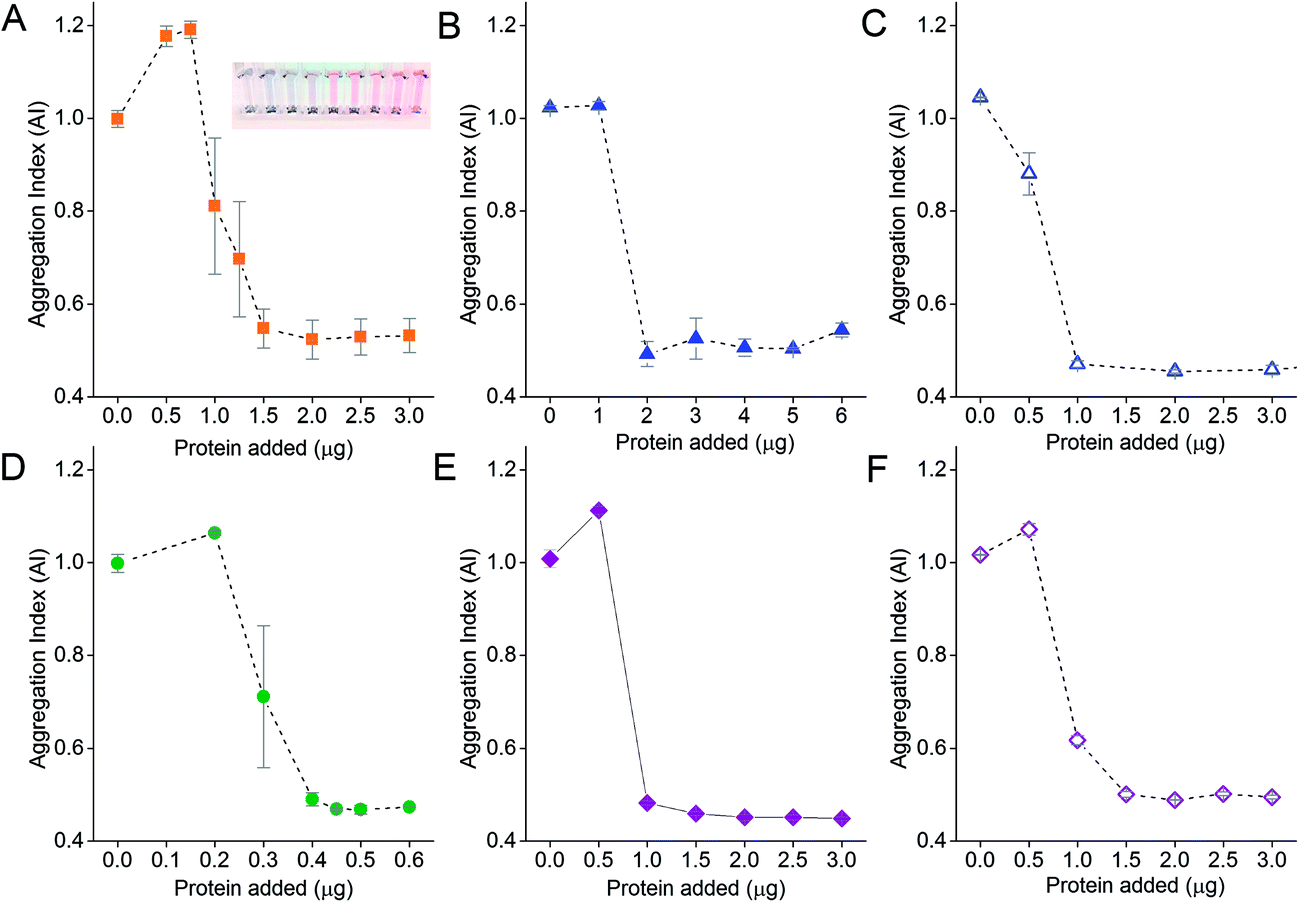 | ||
| Fig. 3 Protein titration curves used to determine the minimum protecting amounts (MPA) of (A) DIII-His, (B) anti-His mAb, (C) anti-DIII pAb, (D) VEGFA, (E) anti-VEGFA mAb, and (F) anti-VEGFA pAb on 0.77 nM of NPs to stabilize them from salt-induced aggregation. The inset in (A) shows the color change in NP colloid as the amount of DIII-His added was increased from left to right. | ||
No further improvement in colloidal stability was observed when protein was added beyond the MPA. Excess protein remained unbound in solution and did not contribute to steric stabilization. However, the free excess protein could still bind to the target analyte without contributing to NP aggregation. Therefore, we formed our NP-corona at the empirically determined MPA for subsequent aggregation assay studies, in addition to thorough centrifugal washings, to minimize reduction in assay sensitivity.
The MPA varied from 0.4 μg (VEGFA) to 2.0 μg (anti-His mAb) for 0.77 nM of NPs. We determined the MPA per NP, and the molar ratio (MPA/NP) for all six proteins. For the smaller DIII-His and VEGFA, an MPA/NP of 355 and 81 was required to form a stable antigen corona on the NPs, respectively (Fig. 4). The larger anti-His mAb, anti-DIII pAb, anti-VEGFA mAb and anti-VEGFA pAb had a lower MPA/NP of 41, 21, 21 and 31, respectively. The differences in MPA/NP between DIII-His, VEGFA and the antibodies could be attributed to differences in size and structure of the proteins. This was expected as smaller proteins possessed smaller footprints on the NP surface, leading to higher MPA/NP and vice versa. The differences in MPA/NP between the antibodies were small and most likely due to the slight differences in MPA as observed in Fig. 3.
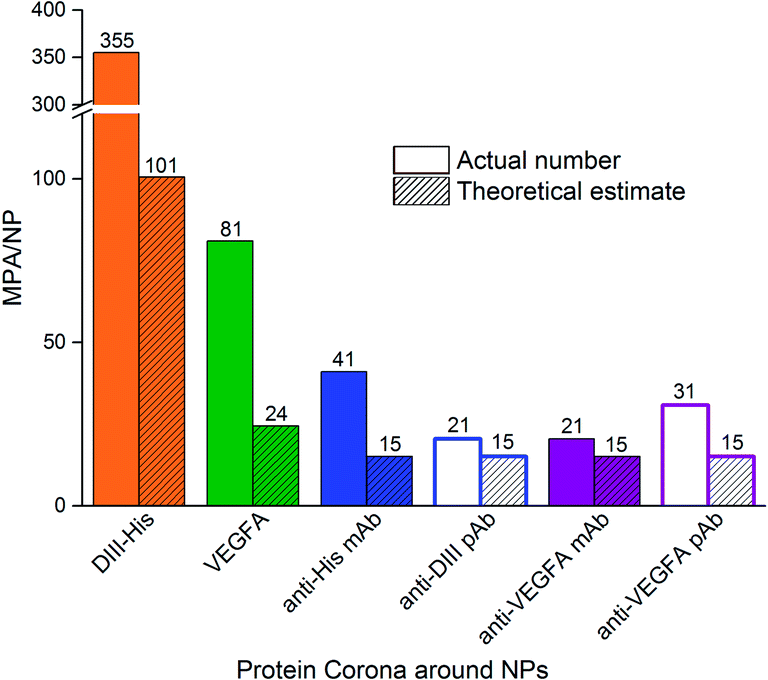 | ||
| Fig. 4 The minimum protecting amount of proteins per NP (MPA/NP) molar ratio needed to confer colloidal stability to NPs as compared to the theoretical estimate of protein packing density on NPs. The former is based on the MPA estimated empirically from protein titration in Fig. 3. | ||
In general, the MPA/NP obtained empirically was higher than our theoretical estimates of packing densities to form a monolayer. This was true for all six proteins. The higher empirical values suggested that additional protein molecules were recruited for steric stabilization of the NPs although they were not directly involved in the formation of the protein monolayer in the corona. Other factors such as protein–protein interactions, orientation of protein binding and protein unfolding on the NP surface53,54 might also affect the actual minimum number of proteins needed to stabilize the NPs.
pH titration
As the formation of the protein corona involves electrostatic attraction between charged species, pH also affects the colloidal stability of the NP-corona. Adsorption of proteins onto the NPs is optimal when the pH is slightly higher than the isoelectric point (pI) of the proteins.55 We performed pH titration to determine the optimum pH for protein adsorption. The AI of the NPs after salt-induced aggregation was plotted as a function of pH, from which we derived the pH range in which the NPs were stable.Similar to protein titration, sigmoidal pH titration curves were obtained (Fig. 5). At pH below their pI, proteins carry net positive charges due to protonation of their basic residues. Introduction of positively charged proteins will thus screen the negative charge between the citrate-capped NPs, weaken electrostatic repulsion, promote NP aggregation, and result in a high AI. As pH increases, more residues become deprotonated. This decreases their positive charge, and reduces the charge screening and destabilizing effects of the proteins on the NPs, leading to a decrease in AI.
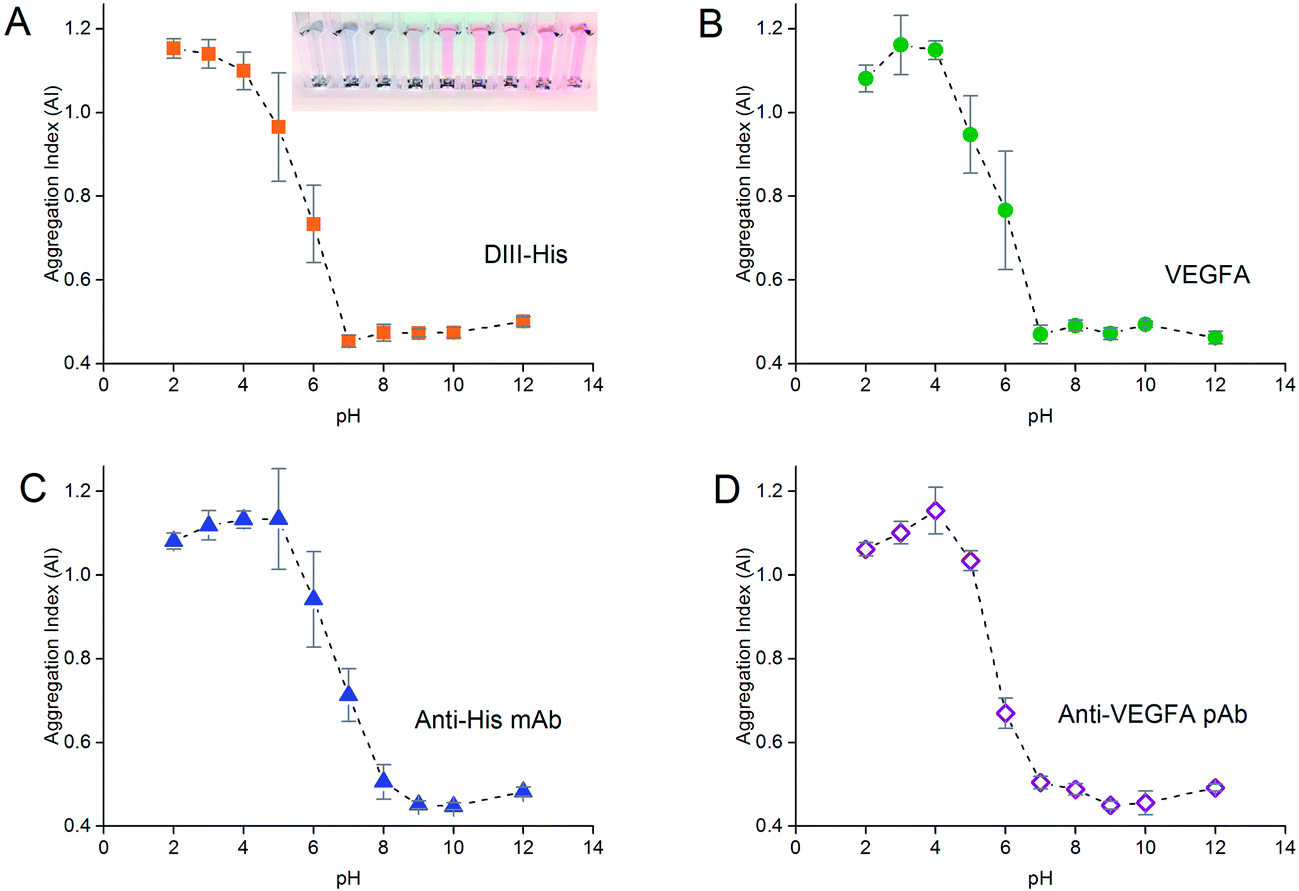 | ||
| Fig. 5 pH titration curves to determine the optimum pH for adsorption of (A) DIII-His, (B) VEGFA, (C) anti-His mAb and (D) anti-VEGFA pAb required to form a corona around 0.77 nM of NPs, and stabilize them from salt-induced aggregation. The insert in (A) shows the color change of the NPs as the pH increased from left to right. | ||
As pH approached the pI of the proteins (pI of DIII-His = 6.93, pI of VEGFA = 9.19, pI of antibody = 6.1, values for DIII-His and VEGFA calculated using the “Compute pI/MW” program in ExPASy),56 the proteins carried no net charge and were able to passively adsorb onto the NPs through non-electrostatic interactions. This resulted in minimum aggregation. Here, the AI reached a minimum, and any further increase in pH did not change the colloidal stability of the NP-corona. We used this minimum pH at which the AI reached the lowest value to form the protein corona in subsequent experiments to avoid protein denaturation and loss of biological activity at extreme alkalinity.
Characterization of protein corona formation around NPs
The formation of protein corona around NPs resulted in protein-dependent changes to their physical properties. In general, the protein corona caused a slight redshift in the peak absorbance wavelength (Fig. 6A). The redshift was the least for DIII-His (from 519 nm to 524 nm, Δλ = 5 nm). Formation of a VEGFA antigen corona resulted in a redshift to 527 nm (Δλ = 8 nm). Redshifts were also observed for the antibody corona formed from anti-His mAb (Δλ = 8 nm), anti-DIII pAb (Δλ = 4 nm), anti-VEGFA mAb (Δλ = 5 nm) and anti-VEGFA pAb (Δλ = 9 nm). In general, a redshift of ∼6 to 7 nm in peak absorbance is typical of protein binding on NPs and has been previously reported.57,58 They arise from dipole interactions between the bound proteins and the surface plasmon of the NPs, which in turn change the dielectric environment around the NPs.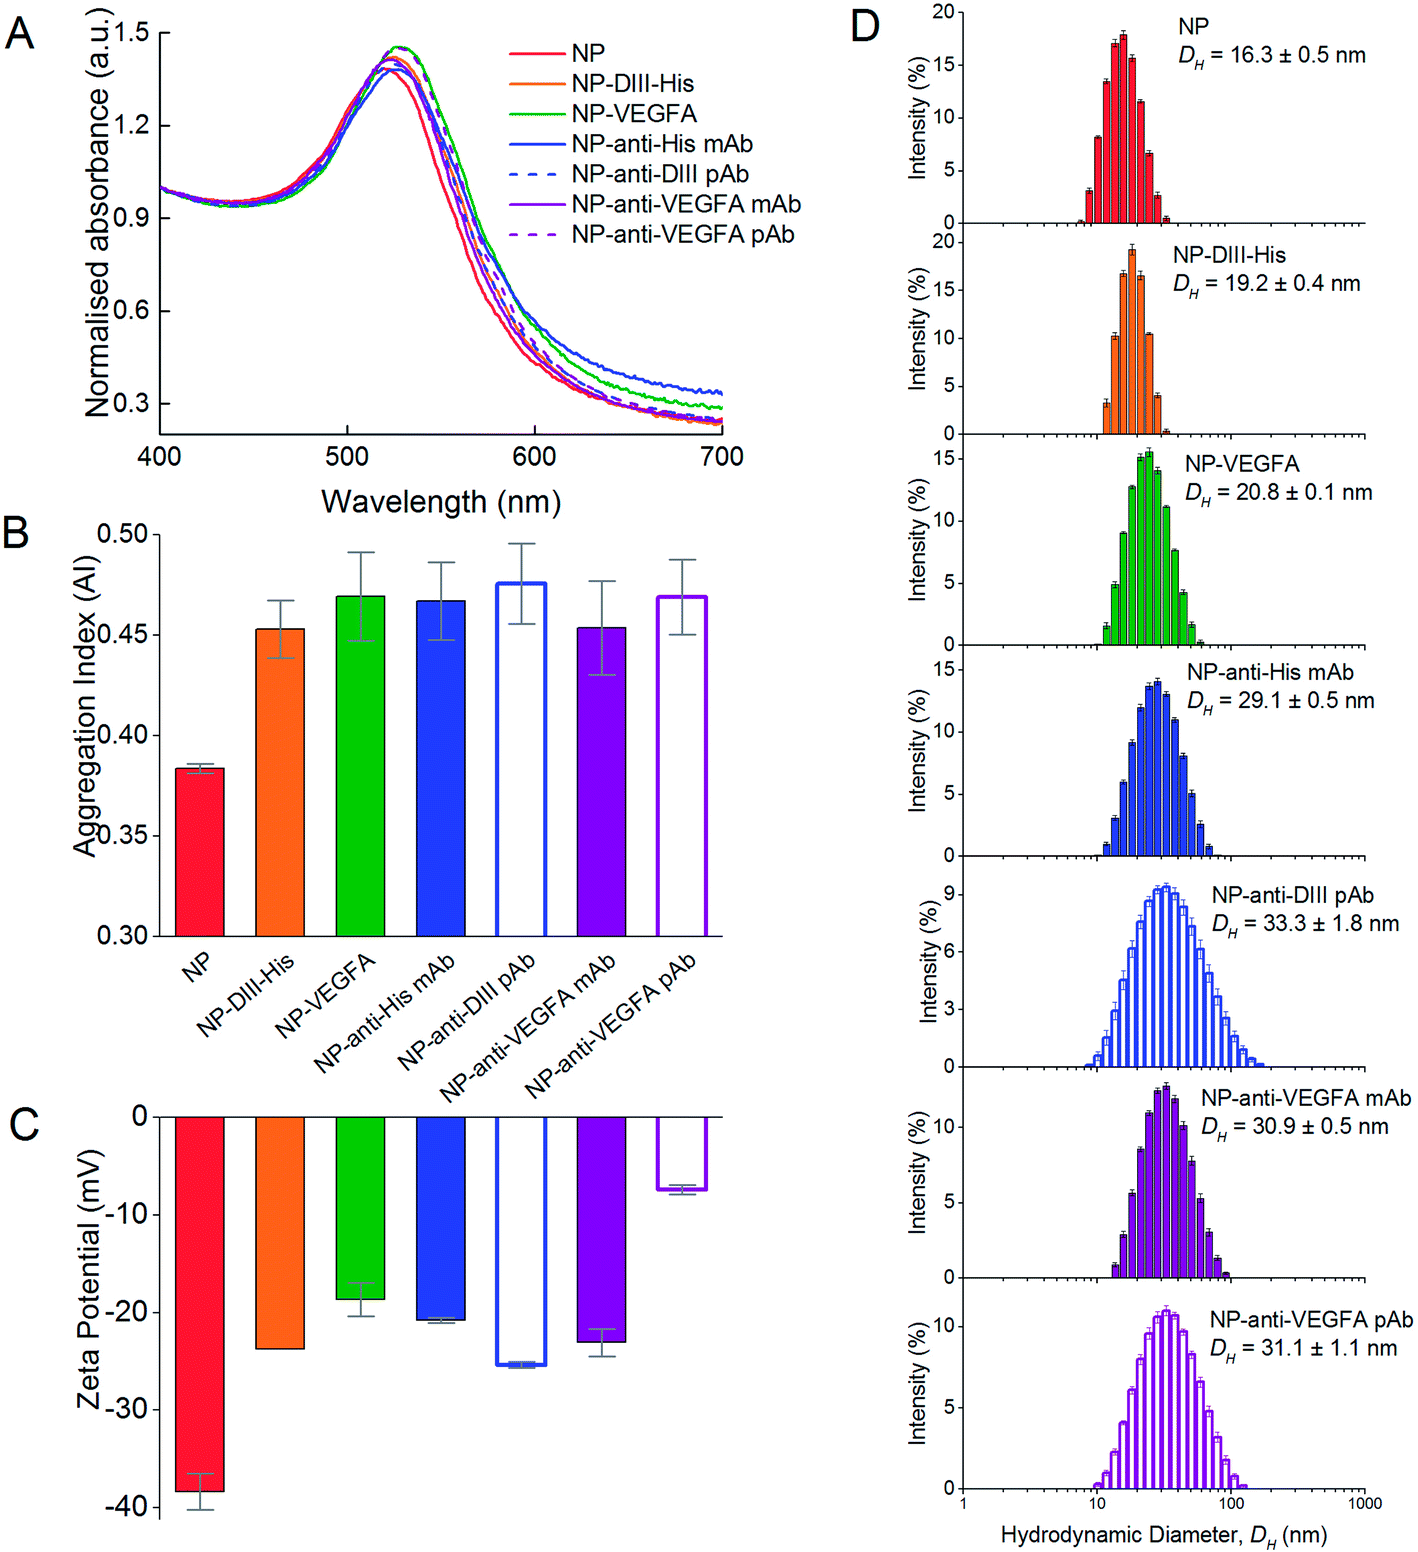 | ||
| Fig. 6 Formation of antigen (DIII-His and VEGFA) and antibody (anti-His mAb, anti-DIII pAb, anti-VEGFA mAb and anti-VEGFA pAb) corona around the NPs, showing changes in (A) UV-Vis absorption spectra, (B) aggregation indices (AI), (C) zeta potential and (D) hydrodynamic diameter (DH) of the NPs from DLS. | ||
Apart from the redshift in peak absorbance, binding of proteins to form the corona did not induce significant colloidal instability to the NPs. The AI of the as-synthesized citrate-capped NPs was 0.384 ± 0.002. Binding of the six proteins saw the AI of the NP–antigen and NP–antibody increase only slightly (AINP-DIII-His = 0.453 ± 0.014, AINP-VEGFA = 0.469 ± 0.022, AINP-anti-His mAb = 0.467 ± 0.019, AINP-anti-DIII pAb = 0.476 ± 0.020, AINP-anti-VEGFA mAb = 0.454 ± 0.023 and AINP-anti-VEGFA pAb = 0.469 ± 0.019) (Fig. 6B). This was unlike gold nanorods (NRs) where formation of a protein corona induces clustering of NRs, facilitated by the presence of excess free cetyltrimethylammonium bromide (CTAB) ligands from NR synthesis.34,59 These free ligands were not present in the NPs to induce NP clustering. The colloidal stability of NPs is crucial for proper functionality of aggregation-based assays.
The colloidal stabilities of NPs with an antigen and antibody corona were also confirmed by their zeta potential (Fig. 6C). The synthesized citrate-capped NPs had a zeta potential of ζNP = −38.4 ± 1.9 mV. While formation of a protein corona resulted in a less negative zeta potential of the NPs (ζNP-DIII-His = −23.7 ± 0.5, ζNP-VEGFA = −18.7 ± 1.7, ζNP-anti-His mAb = −20.8 ± 0.3, ζNP-anti-DIII pAb = −25.4 ± 0.3, ζNP-anti-VEGFA mAb = −23.1 ± 1.4 and ζNP-anti-VEGFA pAb = −7.4 ± 0.5 mV), the surface charge remained sufficiently negative to maintain colloidal stability. This decrease in negative charge was expected as proteins within the corona possessed a small net charge at a pH near their pI. This made the citrate-capped NPs less negative when the proteins formed the corona around them.
Formation of both an antigen and antibody corona also increased the hydrodynamic diameter (DH) of the citrate-capped NPs, and the increase correlated to the size of the protein forming the corona. Binding of the smaller DIII-His and VEGFA antigens caused the DH of the NPs to increase from 16.3 ± 0.5 nm to 19.2 ± 0.4 nm and 20.8 ± 0.1 nm, respectively (Fig. 6D). The increase in DH was of the same size range as the proteins (Fig. 2A and B), suggesting the formation of a protein monolayer. On the other hand, formation of anti-His mAb, anti-DIII pAb and anti-VEGFA mAb and pAb corona on the NPs resulted in larger DH of 29.1 ± 0.5, 33.3 ± 1.8, 30.9 ± 0.5 and 31.1 ± 1.1 nm respectively, as antibodies are larger (∼150 kDa). The increase in DH for the four antibodies was also of a similar size as the antibodies (Fig. 2C), which again suggested the formation of a protein monolayer.
Functionality of aggregation assay – number of epitopes on target analyte
We first demonstrated the functionality of the aggregation assay using NP–antibody as the detecting agent for the antigen target analyte. Addition of DIII-His target analyte to NP-anti-His mAb in the DIII-His:anti-His mAb molar ratio of 5:1 did not result in any aggregation within 1 h. There was no change to the absorbance spectrum (Fig. 7A) and the AI remained constant (∼0.57) over time (Fig. 7B, solid line). Even when the DIII-His:anti-His mAb molar ratio was increased further to 20:1, the AI remained relatively unchanged (Fig. 7C, solid line). Hence, DIII-His was unable to induce any aggregation of NP-anti-His mAb.
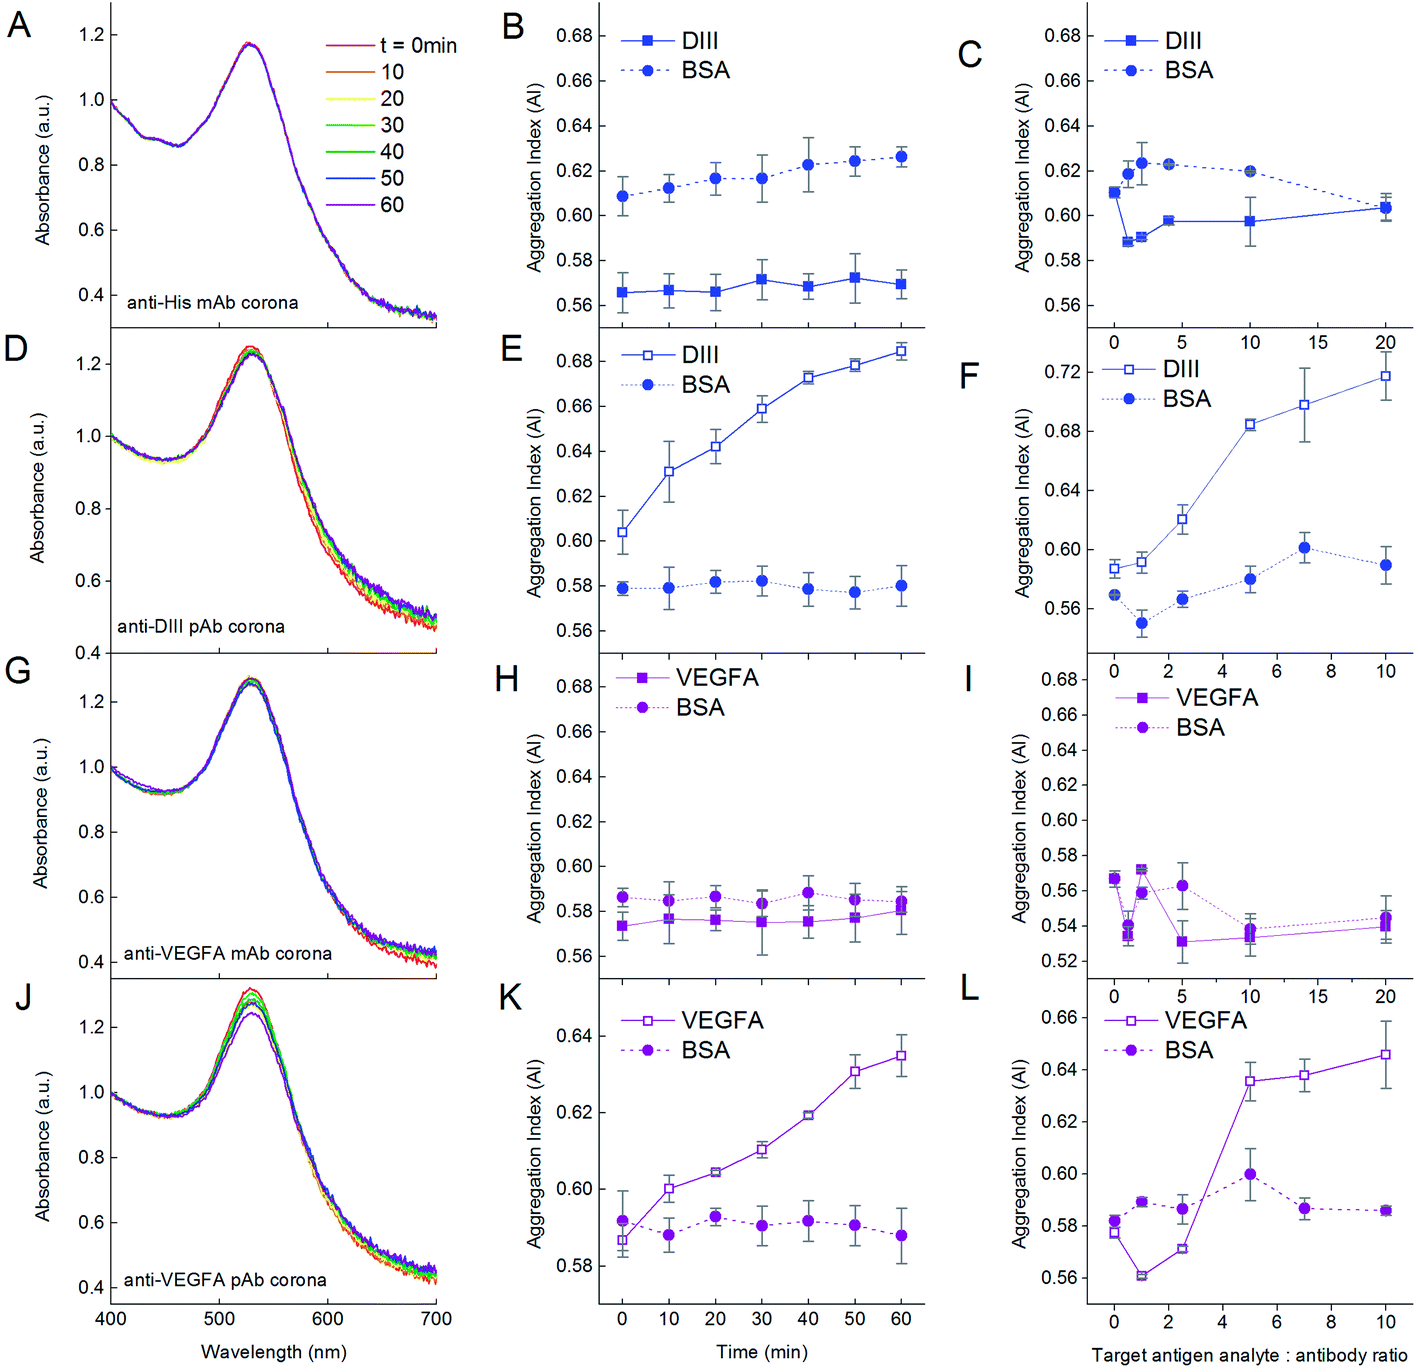 | ||
| Fig. 7 Influence of the number of epitopes on the antigen target analyte on the functionality of the aggregation assay. Addition of DIII-His with a single epitope to NP-anti-His mAb in the ratio of DIII-His:anti-His mAb = 5:1 results in no change in the (A) UV-Vis absorption spectrum and (B) AI of the NPs over time. (C) The AI is also not dependent on the DIII-His:anti-His mAb molar ratio. On the other hand, addition of DIII-His with more than one epitope to NP-anti-DIII pAb in the same ratio results in (D) changes to the UV-Vis absorption spectrum and (E) an increase in AI of the NPs over time. (F) AI is dependent on the DIII-His:anti-DIII pAb molar ratio. The same observations were made for the addition of VEGFA with a single epitope to NP-anti-VEGFA mAb (G–I) and with multiple epitopes to NP-anti-VEGFA pAb (J–L). In all cases, the negative control BSA target did not elicit any aggregation, regardless of incubation time or ratio, thus showing the specificity of the aggregation assay. | ||
In contrast, addition of DIII-His target analyte to NP-anti-DIII pAb in a molar ratio of 5:1 resulted in gradual aggregation over 1 h. We observed a broadening of the UV-Vis absorbance spectrum coupled with a corresponding decrease in the peak absorbance within 1 h (Fig. 7D). This change was translated to an increment in AI over time from 0.604 to 0.685 (Fig. 7E, solid line). This change in AI exhibited non-linear dependence on the DIII-His:anti-DIII pAb molar ratio (Fig. 7F, solid line). Therefore, unlike NP-anti-His mAb, DIII-His was able to induce aggregation of NP-anti-DIII pAb. We noted that minimal changes in the AI were observed both as a function of time and antigen target analyte:antibody ratio when BSA was added as the negative control analyte to both NP-anti-His mAb and NP-anti-DIII pAb (Fig. 7, dashed lines). This proved that the aggregation-based assay was able to specifically detect the antigen-of-interest, with no non-specifically induced aggregation.
It was thus apparent that while NP-anti-DIII pAb could be used to detect the presence of DIII-His in an unknown sample, this was not the case for NP-anti-His mAb. This could be attributed to the fact that each DIII-His molecule had only one hexa-histidine tag.42 It therefore had only one epitope for anti-His mAb. In order to induce aggregation of NP–antibody, the target antigen must have a minimum of two epitopes. This way, the antibody on one NP could then bind to one epitope, while the antibody on another NP could bind to another epitope (Scheme 1A) to allow “cross-linking” and aggregation of the NPs.
On the other hand, DIII-His possessed two epitopes for binding by anti-DIII pAb where the components of the polyclonal mix include anti-His mAb that binds to the hexa-histidine tag and 3H5 mAb that binds to residues 383–386 on DIII-His.60 This allowed anti-His mAb and 3H5 mAb from different NPs to bind to the same DIII-His molecule to induce aggregation.
The same was also observed for VEGFA. When the VEGFA target analyte was added, aggregation was absent for NP-anti-VEGFA mAb (Fig. 7G–I), but was present in NP-anti-VEGFA pAb (Fig. 7J–L). This is, again, attributed to the fact that VEGFA has only one epitope for anti-VEGFA mAb, but multiple epitopes for anti-VEGFA pAb.
The aggregation obtained from the UV-Vis spectrum correlated well with changes in DH obtained from dynamic light scattering. For anti-His and anti-VEGFA mAb, a slight increase in ΔDH (11.2 and 16.7 nm, respectively) was detected after addition of the antigen to the respective NP–antibodies corona at an antigen:antibody molar ratio of 5:1 for 1 h (see ESI, Fig. S2†). This could be attributed to antigens binding to NP–antibodies without inducing aggregation. Hence, the AI showed no increase. In contrast, a much larger ΔDH was detected for anti-DIII and anti-VEGFA pAb (37.4 nm and 31.7 nm, respectively), and this could be attributed to “crosslinking”-induced NP aggregation effected by the polyclonal antibodies.
The agreement in results between the two different antigen–antibody systems (DIII-His and VEGFA) used in this study provides convincing evidence that multiple epitopes on the antigens are required for NP aggregation. Aggregation does not necessarily occur for every antigen–antibody pair (e.g. no aggregation was observed for DIII-anti-His mAb and VEGFA-anti-VEGFA mAb pairs). The above results therefore hold important implications for the rational selection of proteins and design of aggregation-based assays that rely on antibody corona for detection, as we showed that an aggregation-based assay can only be established if the target analyte has more than one epitope or if the antibodies used to form the NP-corona can recognize multiple epitopes on the target antigen. Such a limitation on the target antigen analyte has made explicit the need for pre-screening of the antigen–antibody pair, which may not be immediately apparent to many.
Functionality of aggregation assay – nature of protein corona
Although the addition of DIII-His target analyte to NP-anti-His mAb did not result in aggregation, this was not observed in the reciprocal system in which a DIII-His antigen corona was used. Here, addition of anti-His mAb target analyte to NP-DIII-His in an anti-His mAb:DIII-His molar ratio of 1:1 resulted in gradual aggregation over 2 h. In fact, a broadening of the UV-Vis absorbance spectrum and a decrease in peak absorbance could already be observed within 1 h (Fig. 8A). In contrast, addition of the IgG isotype control antibody to NP-DIII-His did not result in any detectable aggregation and the spectrum remained unchanged over time (Fig. 8B). It was thus apparent that while NP-anti-His mAb could not be used to detect the presence of DIII-His in an unknown sample, the reverse was possible with NP-DIII-His in detecting anti-His mAb. This showed that, apart from the number of epitopes on the antigen, the functionality of the aggregation assay was also dependent on the nature of the protein corona, and that the NP–antigen corona was able to detect specifically the antibody-of-interest, with no non-specific aggregation.
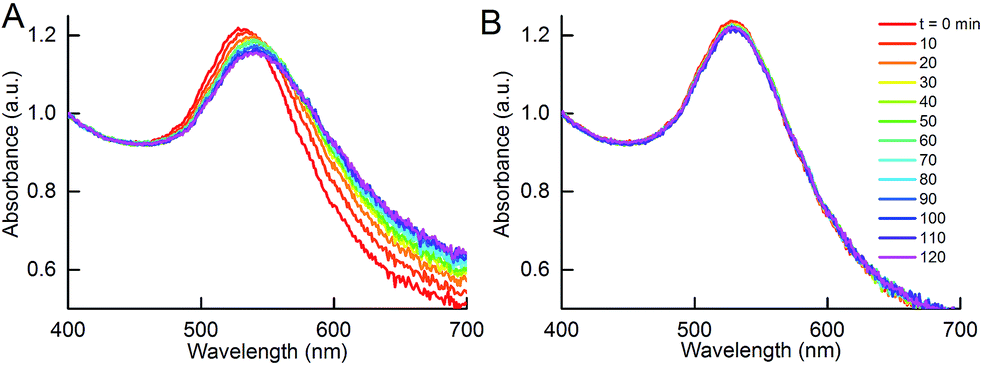 | ||
| Fig. 8 Aggregation of NPs with DIII-His corona (NP-DIII-His) in the presence of anti-His mAb target analyte. (A) Changes in UV-Vis absorbance spectrum due to aggregation of NP-DIII-His in the presence of anti-His mAb, in contrast to (B) no change in UV-Vis absorbance in the presence of IgG isotype control. | ||
The change in the UV-Vis spectrum was translated to a rise in AI over 1 h (Fig. 9A, solid line). The AI was also dependent on the anti-His mAb target analyte:DIII-His molar ratio. As the anti-His mAb:DIII-His molar ratio increased from 0 to 0.5, the AI increased sharply and plateaued beyond the molar ratio of 0.5 (Fig. 9B, solid line). This implied that two NP-DIII-His were needed to react with each anti-His mAb to cause aggregation. This could be explained by the presence of two Fab fragments on each antibody that are available to bind to one DIII-His molecule each. Further increment in the amount of anti-His mAb only resulted in a gradual rise in AI.
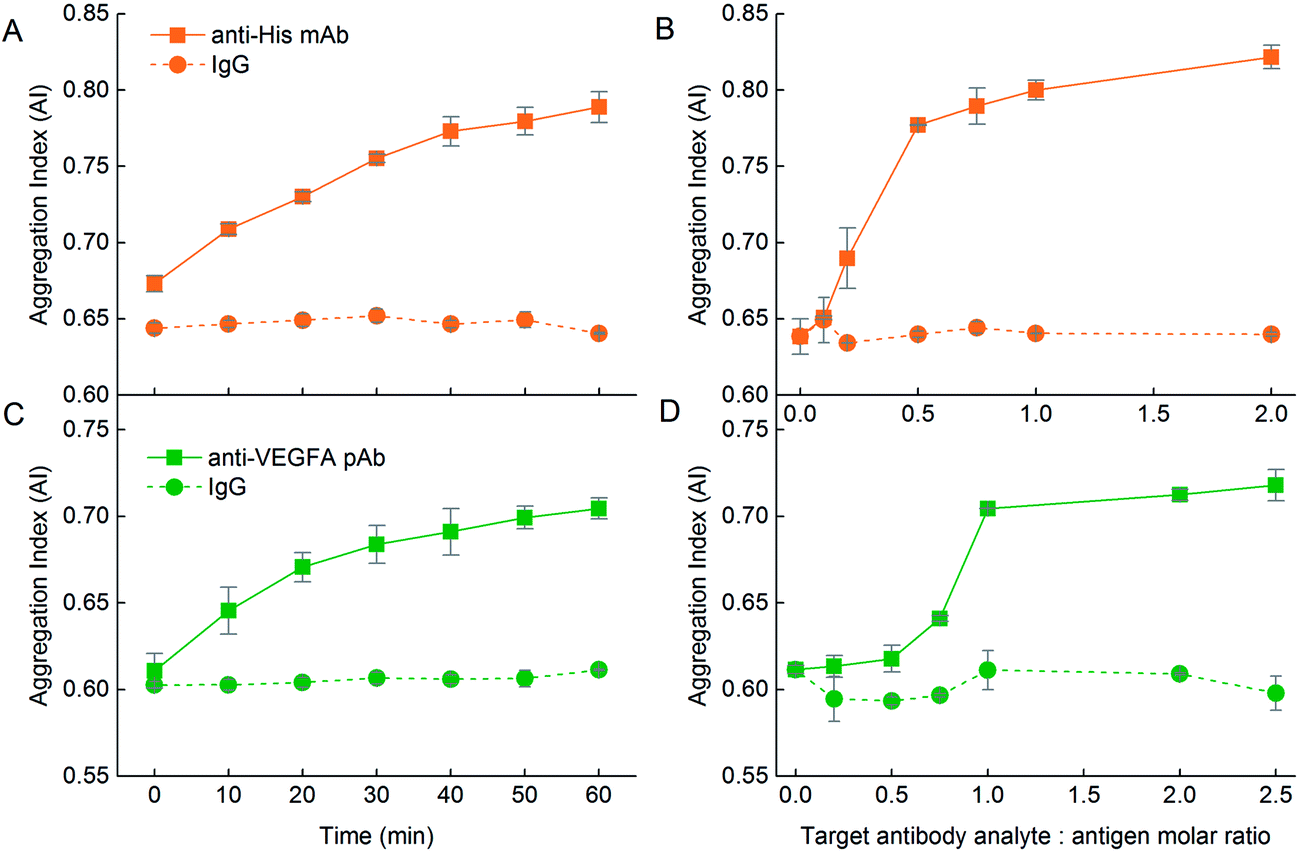 | ||
| Fig. 9 Influence of the nature of the protein corona on the functionality of the aggregation assays. With an antigen corona, addition of (A) anti-His mAb to NP-DIII-His in the ratio of anti-His mAb:DIII-His = 1:1 results in an increase in AI with time. This is not observed in the reciprocal system. (B) The AI is dependent on the anti-His mAb target analyte:DIII-His molar ratio. (C) Addition of anti-VEGFA pAb to NP-VEGFA in the ratio of anti-VEGFA pAb:VEGFA = 1:1 again resulted in an increase in AI over time. This increase, however, is more significant than in its reciprocal system. (D) The AI is again dependent on the anti-VEGFA pAb target analyte:NP-VEGFA molar ratio. In both NP-DIII-His and NP-VEGFA systems, the isotype control mouse IgG target does not elicit any aggregation under the same incubation ratio of 1:1, showing the specificity of the aggregation assay. | ||
The influence of the protein corona nature on the functionality of the aggregation assay was also observed in the VEGFA and anti-VEGFA system. VEGFA was able to elicit aggregation to NP-anti-VEGFA pAb with ΔAI = 0.048 within 1 h at a VEGFA target analyte:anti-VEGFA pAb ratio of 5:1 (Fig. 7K, solid line). However, addition of anti-VEGFA pAb target analyte to the NP-VEGFA reciprocal system resulted in a larger increase in AI at a lower anti-VEGFA pAb target analyte:VEGFA ratio of 1:1 (ΔAI = 0.093) (Fig. 9C, solid line). This increase was almost twice that of the VEGFA and NP-anti-VEGFA pAb system. Here, anti-VEGFA pAb recognized multiple epitopes on the VEGFA adsorbed on the NPs, thus allowing aggregation to occur. This showed that even with proteins having multiple epitopes whereby both antigen and antibody corona could elicit aggregation in the presence of their respective target analytes, the antigen corona was still able to elicit a stronger response with higher sensitivity than an antibody corona.
The higher sensitivity of the aggregation assay obtained with a NP–antigen corona was again confirmed by the amount of target analyte needed to achieve maximum aggregation per molar ratio of NP. For NP-anti-VEGFA pAb, 5 molecules of VEGFA were needed to elicit maximum aggregation per NP-anti-VEGFA pAb (Fig. 7L, solid line), whereas only 1 molecule of anti-VEGFA pAb was needed to elicit maximum aggregation per NP-VEGFA (Fig. 9D, solid line). This higher sensitivity could be due to the larger number of VEGFA present on the NP (MPA/NP = 81) compared to anti-VEGFA pAb (MPA/NP = 31), which allowed more target analyte to bind to the NPs.
The AI also increased with an increasing anti-VEGFA pAb target analyte:VEGFA molar ratio, but plateaued at a molar ratio of 1 (Fig. 9D, solid line). Here, at least two anti-VEGFA pAb must bind to two VEGFA on the NPs to elicit maximum aggregation between them. Compared to NP-DIII-His which required just one anti-His mAb to bind to two DIII-His on the NPs, this showed that NP-VEGFA had a poorer detection limit than NP-DIII-His. This might again be attributed to the larger number of DIII-His present on the NP (MPA/NP = 355) compared to VEGFA (MPA/NP = 81). These results thus revealed that the nature of the protein corona (i.e. antibody or antigen) around the NPs also plays an important role in the design of aggregation-based assays using NPs. In general, the protein corona formed from small antigen molecules that can be packed at higher densities on the NPs result in higher sensitivities than corona formed from larger antibody molecules.
Although the antigen corona was able to elicit a stronger response with higher sensitivity than an antibody corona, forming an antigen corona around the NPs by coating the NPs directly in antigen-containing biological fluids may not be direct and practical. There are usually other biomolecules present in biological fluids competing with the antigen to form the NP corona. Furthermore, the amount of antigen in biological samples is usually very low.61 This results in only a small amount of antigen being assimilated into the antigen corona and the NP–antigen system having poor detection capabilities. Instead, the NPs should be pre-coated with purified antigen in vitro to form the antigen corona.9,61,62 With the antigen of the disease-of-interest known, the recombinant antigen can be expressed, purified, and immobilized at a high concentration (or packing density) on the NP surface. The pre-coated NP–antigen corona probes can then be introduced into biological fluids or samples for detection of the target antibody.
Conclusion
Our study established two guidelines relevant to the design of aggregation-based assays. Firstly, we found that the number of epitopes on the antigen matters for antibody corona formed on NPs. DIII-His and VEGFA antigens had multiple epitopes for anti-DIII and anti-VEGFA pAb and were able to induce aggregation of NP-anti-DIII and NP-anti-VEGFA pAb, respectively. However, the same antigens had only a single epitope for anti-His and anti-VEGFA mAb, and were not able to induce aggregation of NP-anti-His and NP-anti-VEGFA mAb. Thus, any attempt to design an aggregation-based assay to detect an antigen would require the antigen to have multiple epitopes for its corresponding antibody. This further implied that only polyclonal, but not monoclonal, antibodies could be used in aggregation-based assays with NPs having an antibody corona, and monomeric antigen target analytes. Furthermore, the nature of the protein corona also matters as the corona formed from small antigens had lower limits of detection and elicited larger changes in AI, when compared to a corona formed from larger antigens and antibodies. Our study therefore established two important guidelines for the rational selection of proteins in the design of aggregation-based assays with NPs.Author contributions
The manuscript was written through contributions from all authors. All authors have given approval to the final version of the manuscript.Funding sources
The funding used to support the research of the manuscript was from the NUS Cross Faculty Research Grant.Acknowledgements
Funding was from the NUS Cross Faculty Research Grant. We thank the NUS Electron Microscopy Unit for use of the TEM.References
- M. Wasowicz, M. Milner, D. Radecka, K. Grzelak and H. Radecka, Sensors, 2010, 10, 5409–5424 CrossRef CAS PubMed.
- C. A. Mirkin, R. L. Letsinger, R. C. Mucic and J. J. Storhoff, Nature, 1996, 382, 607–609 CrossRef CAS PubMed.
- M. S. Cordray, M. Amdahl and R. R. Richards-Kortum, Anal. Biochem., 2012, 431, 99–105 CrossRef CAS PubMed.
- T. Bu, T. Zako, M. Fujita and M. Maeda, Chem. Commun., 2013, 49, 7531–7533 RSC.
- H. Lee, T. Kang, K. A. Yoon, S. Y. Lee, S. W. Joo and K. Lee, Biosens. Bioelectron., 2010, 25, 1669–1674 CrossRef CAS PubMed.
- S. Eissa, H. M. Azzazy, M. Matboli, S. M. Shawky, H. Said and F. A. Anous, Appl. Biochem. Biotechnol., 2014, 174, 751–761 CrossRef CAS PubMed.
- R. R. Al Olaby and H. M. Azzazy, Expert Rev. Mol. Diagn., 2011, 11, 53–64 CrossRef CAS PubMed.
- S. H. Radwan and H. M. Azzazy, Expert Rev. Mol. Diagn., 2009, 9, 511–524 CrossRef CAS PubMed.
- N. T. Thanh and Z. Rosenzweig, Anal. Chem., 2002, 74, 1624–1628 CrossRef CAS.
- W. Zhao, W. Chiuman, J. C. Lam, M. A. Brook and Y. Li, Chem. Commun., 2007, 3729–3731 RSC.
- K. V. Gobi, H. Iwasaka and N. Miura, Biosens. Bioelectron., 2007, 22, 1382–1389 CrossRef CAS PubMed.
- D. Aili, R. Selegard, L. Baltzer, K. Enander and B. Liedberg, Small, 2009, 5, 2445–2452 CrossRef CAS PubMed.
- S. Watanabe, K. Yoshida, K. Shinkawa, D. Kumagawa and H. Seguchi, Colloids Surf., B, 2010, 81, 570–577 CrossRef CAS PubMed.
- W. Zhao, W. Chiuman, M. A. Brook and Y. Li, ChemBioChem, 2007, 8, 727–731 CrossRef CAS PubMed.
- L. Zhang, J. Zhao, J. Jiang and R. Yu, Chem. Commun., 2012, 48, 10996–10998 RSC.
- J. S. Lee, M. S. Han and C. A. Mirkin, Angew. Chem., Int. Ed., 2007, 46, 4093–4096 CrossRef CAS PubMed.
- Y. Guo, Z. Wang, W. Qu, H. Shao and X. Jiang, Biosens. Bioelectron., 2011, 26, 4064–4069 CrossRef CAS PubMed.
- M. Li, H. Yang, S. Li, K. Zhao, J. Li, D. Jiang, L. Sun and A. Deng, J. Agric. Food Chem., 2014, 62, 10896–10902 CrossRef CAS PubMed.
- S. Link and M. A. El-Sayed, J. Phys. Chem. B, 1999, 103, 8410–8426 CrossRef CAS.
- J. J. Storhoff, A. A. Lazarides, R. C. Mucic, C. A. Mirkin, R. L. Letsinger and G. C. Schatz, J. Am. Chem. Soc., 2000, 122, 4640–4650 CrossRef CAS.
- J. J. Storhoff, R. Elghanian, R. C. Mucic, C. A. Mirkin and R. L. Letsinger, J. Am. Chem. Soc., 1998, 120, 1959–1964 CrossRef CAS.
- S. Dominguez-Medina, J. Blankenburg, J. Olson, C. F. Landes and S. Link, ACS Sustainable Chem. Eng., 2013, 1, 833–842 CAS.
- I. H. El-Sayed, X. Huang and M. A. El-Sayed, Nano Lett., 2005, 5, 829–834 CrossRef CAS PubMed.
- K. Sokolov, J. Aaron, B. Hsu, D. Nida, A. Gillenwater, M. Follen, C. MacAulay, K. Adler-Storthz, B. Korgel, M. Descour, R. Pasqualini, W. Arap, W. Lam and R. Richards-Kortum, Technol. Cancer Res. Treat., 2003, 2, 491–504 CrossRef CAS PubMed.
- P. Van Dong, H. Ha, P. Trong Hoang, C. Udo and C. Hoang Ha, Adv. Nat. Sci.: Nanosci. Nanotechnol., 2012, 3, 045017 CrossRef.
- A. Ambrosi, F. Airo and A. Merkoci, Anal. Chem., 2010, 82, 1151–1156 CrossRef CAS PubMed.
- B. Du, Z. Li and Y. Cheng, Talanta, 2008, 75, 959–964 CrossRef CAS PubMed.
- C. M. Niemeyer, Angew. Chem., Int. Ed., 2001, 40, 4128–4158 CrossRef CAS.
- S. H. Brewer, W. R. Glomm, M. C. Johnson, M. K. Knag and S. Franzen, Langmuir, 2005, 21, 9303–9307 CrossRef CAS PubMed.
- I. Lynch, A. Salvati and K. A. Dawson, Nat. Nanotechnol., 2009, 4, 546–547 CrossRef CAS PubMed.
- A. K. Murthy, R. J. Stover, W. G. Hardin, R. Schramm, G. D. Nie, S. Gourisankar, T. M. Truskett, K. V. Sokolov and K. P. Johnston, J. Am. Chem. Soc., 2013, 135, 7799–7802 CrossRef CAS PubMed.
- A. Bajaj, B. Samanta, H. Yan, D. J. Jerry and V. M. Rotello, J. Mater. Chem., 2009, 19, 6328–6331 RSC.
- J. C. Kah, C. Grabinski, E. Untener, C. Garrett, J. Chen, D. Zhu, S. M. Hussain and K. Hamad-Schifferli, ACS Nano, 2014, 8, 4608–4620 CrossRef CAS PubMed.
- J. C. Kah, J. Chen, A. Zubieta and K. Hamad-Schifferli, ACS Nano, 2012, 6, 6730–6740 CrossRef CAS PubMed.
- A. Cifuentes-Rius, H. de Puig, J. C. Kah, S. Borros and K. Hamad-Schifferli, ACS Nano, 2013, 7, 10066–10074 CrossRef CAS PubMed.
- S. Zhang, A. Garcia-D’Angeli, J. P. Brennan and Q. Huo, Analyst, 2013, 139, 439–445 RSC.
- M. D. Hapugoda, G. Batra, W. Abeyewickreme, S. Swaminathan and N. Khanna, Clin. Vaccine Immunol., 2007, 14, 1505–1514 CrossRef CAS PubMed.
- P. Sathupan, A. Khongphattanayothin, J. Srisai, K. Srikaew and Y. Poovorawan, Ann. Trop. Paediatr., 2007, 27, 179–184 CrossRef PubMed.
- C. S. Tseng, H. W. Lo, H. C. Teng, W. C. Lo and C. G. Ker, FEMS Immunol. Med. Microbiol., 2005, 43, 99–102 CrossRef CAS PubMed.
- M. G. Guzman, L. Hermida, L. Bernardo, R. Ramirez and G. Guillen, Expert Rev. Vaccines, 2010, 9, 137–147 CrossRef CAS PubMed.
- G. Frens, Nature, 1973, 241, 20–22 CAS.
- L. C. Tan, A. J. Chua, L. S. Goh, S. M. Pua, Y. K. Cheong and M. L. Ng, Protein Expression Purif., 2010, 74, 129–137 CrossRef CAS PubMed.
- P. Krupakar, A. M.-L. Ngo and M.-L. Ng, in Protein Purification, ed. M. a. A. Benitez and V. Aguirre, Nova Science Publishers, New York, 2012, pp. 147–169 Search PubMed.
- S. Xiulan, Z. Xiaolian, T. Jian, J. Zhou and F. S. Chu, Int. J. Food Microbiol., 2005, 99, 185–194 CrossRef PubMed.
- C. De Roe, P. J. Courtoy and P. Baudhuin, J. Histochem. Cytochem., 1987, 35, 1191–1198 CrossRef CAS PubMed.
- S. Hansson, R. Singh, A. T. Gudkov, A. Liljas and D. T. Logan, FEBS Lett., 2005, 579, 4492–4497 CrossRef CAS PubMed.
- A. Schiefner, M. Gebauer and A. Skerra, J. Biol. Chem., 2012, 287, 17578–17588 CrossRef CAS PubMed.
- H. Sutovsky and E. Gazit, J. Biol. Chem., 2004, 279, 17190–17196 CrossRef CAS PubMed.
- Y. A. Muller, B. Li, H. W. Christinger, J. A. Wells, B. C. Cunningham and A. M. de Vos, Proc. Natl. Acad. Sci. U. S. A., 1997, 94, 7192–7197 CrossRef CAS.
- Y. H. Tan, M. Liu, B. Nolting, J. G. Go, J. Gervay-Hague and G. Y. Liu, ACS Nano, 2008, 2, 2374–2384 CrossRef CAS PubMed.
- M. A. Ríos-Corripio, B. E. García-Pérez, M. E. Jaramillo-Flores, V. L. Gayou and M. Rojas-López, J. Nanopart. Res., 2013, 15, 1–7 CrossRef.
- S. Thobhani, S. Attree, R. Boyd, N. Kumarswami, J. Noble, M. Szymanski and R. A. Porter, J. Immunol. Methods, 2010, 356, 60–69 CrossRef CAS PubMed.
- E. Tellechea, K. J. Wilson, E. Bravo and K. Hamad-Schifferli, Langmuir, 2012, 28, 5190–5200 CrossRef CAS PubMed.
- M. E. Aubin-Tam and K. Hamad-Schifferli, Langmuir, 2005, 21, 12080–12084 CrossRef CAS PubMed.
- R. G. Rayavarapu, W. Petersen, C. Ungureanu, J. N. Post, T. G. van Leeuwen and S. Manohar, Int. J. Biomed. Imaging, 2007, 2007, 29817 Search PubMed.
- S. Pihlasalo, L. Auranen, P. Hanninen and H. Harma, Anal. Chem., 2012, 84, 8253–8258 CrossRef CAS PubMed.
- J. C. Kah, K. W. Kho, C. G. Lee, C. James, R. Sheppard, Z. X. Shen, K. C. Soo and M. C. Olivo, Int. J. Nanomed., 2007, 2, 785–798 CAS.
- R. T. Tom, A. K. Samal, T. S. Sreeprasad and T. Pradeep, Langmuir, 2007, 23, 1320–1325 CrossRef CAS PubMed.
- J. C. Kah, A. Zubieta, R. A. Saavedra and K. Hamad-Schifferli, Langmuir, 2012, 28, 8834–8844 CrossRef CAS PubMed.
- K. Hiramatsu, M. Tadano, R. Men and C. J. Lai, Virology, 1996, 224, 437–445 CrossRef CAS PubMed.
- X. Liu, Q. Dai, L. Austin, J. Coutts, G. Knowles, J. Zou, H. Chen and Q. Huo, J. Am. Chem. Soc., 2008, 130, 2780–2782 CrossRef CAS PubMed.
- C. Wang, Y. Chen, T. Wang, Z. Ma and Z. Su, Chem. Mater., 2007, 19, 5809–5811 CrossRef CAS.
Footnote |
| † Electronic supplementary information (ESI) available. See DOI: 10.1039/c4ra12089b |
| This journal is © The Royal Society of Chemistry 2015 |