 Open Access Article
Creative Commons Attribution 3.0 Unported Licence
Inhibiting the interaction between FeO and Al2O3 during chemical looping production of hydrogen
Wen
Liu
*a,
Mohammad
Ismail
a,
Matthew T.
Dunstan
b,
Wenting
Hu
c,
Zili
Zhang
d,
Paul S.
Fennell
d,
Stuart A.
Scott
a and
J. S.
Dennis
c
aDepartment of Engineering, University of Cambridge, Trumpington Street, Cambridge, CB2 1PZ, UK. E-mail: wl247@cam.ac.uk
bDepartment of Chemistry, University of Cambridge, Lensfield Road, Cambridge, CB2 1EW, UK
cDepartment of Chemical Engineering and Biotechnology, University of Cambridge, New Museums Site, Pembroke Street, Cambridge, CB2 3RA, UK
dDepartment of Chemical Engineering, Imperial College London, SW7 2AZ, UK
First published on 28th November 2014
Abstract
Hydrogen of high purity can be produced by chemical looping using iron oxide as an oxygen carrier and making use of the reaction between steam and either iron or FeO. However, this process is viable only if the iron oxide can be cycled between the fully-oxidised and fully-reduced states many times. This can be achieved if the iron oxide is supported on refractory oxides such as alumina. Unfortunately, the interaction between alumina and oxides of iron to form FeAl2O4 hinders the kinetics of the reactions essential to the production of hydrogen, viz. the reduction of Fe(II) to metallic iron by a mixture of CO and CO2 prior to the oxidation by steam. Here, oxygen carriers containing Fe2O3 and Al2O3 were doped with Na2O and, or, MgO, in order to inhibit the formation of FeAl2O4 by forming NaAlO2 or MgAl2O4, respectively. The performance of the modified oxygen carriers for producing hydrogen, i.e. cyclic transitions between Fe2O3 (or Fe3O4) and metallic Fe at 1123 K were investigated. It was found that the interaction between FeO and Al2O3 was successfully mitigated in an oxygen carrier containing Mg, with an Al: Mg ratio of 2, resulting in consistently stable and high capacity for producing hydrogen by chemical looping, whether or not the material was oxidised fully in air in each cycle. However, the oxygen carrier without Mg only remained active when a step to oxidise the sample in air was included in each cycle. Otherwise it progressively deactivated with cycling, showing substantial interaction between Al2O3 and oxides of Fe.
1. Introduction
Hydrogen is a potential fuel for a low-carbon economy, provided it can be manufactured with minimal release of CO2 to the atmosphere. Generally, to generate hydrogen, carbonaceous fuels need to be consumed, usually via large-scale, energy-intensive processes such as steam-methane reforming. Where the hydrogen is to be used in polymeric-electrolyte-membrane fuel cells; an additional process is required to purify the hydrogen to avoid poisoning of the Pt electrodes by the low concentrations of CO which contaminate the product of steam-methane reforming.1 However, CO may be less of a problem in other types of fuel cells, e.g. solid-oxide fuel cells or solid molten carbonate fuel cells.1 An alternative process, capable of producing pure hydrogen directly from carbonaceous fuels, at small to medium scales with simultaneous capture of CO2, is chemical looping hydrogen production.2Chemical looping techniques rely on the ability of transition metal oxides to transport oxygen from an oxidising environment to a reducing environment. When CO is used as a reductant and the oxygen in air is used as an oxidant, the reactions can be generalised:
| CO reduction: MeOx(s) + yCO(g) → MeOx−y(s) + yCO2(g) | (1) |
| Air oxidation: MeOx−y (s) + O2(g) → MeOx(s) | (2) |
| 3/4Fe(s) + H2O(g) ⇌ 1/4Fe3O4(s) + H2(g), ΔH°1123 K = −26.3 kJ mol−1 | (3) |
| 3Fe2O3(s) + H2(g) ⇌ 2Fe3O4(g) + H2O(g) ΔH°1123 K = −5.9 kJ mol−1 | (4) |
| 1.202Fe3O4(s) + H2(g) ⇌ 3.807Fe0.947O(s) + H2O(g) ΔH°1123 K = +56.6 kJ mol−1 | (5) |
| Fe0.947O(s) + H2(g) ⇌ 0.947 Fe(s) + H2O(g) ΔH°1123 K = −16.9 kJ mol−1 | (6) |
| 3Fe2O3(s) + CO(g) ⇌ 2Fe3O4(s) + CO2(g) ΔH°1123 K = −40.8 kJ mol−1 | (7) |
| 1.202Fe3O4(s) + CO(g) ⇌ 3.807Fe0.947O(s) + CO2(g) ΔH°1123 K = +34.9 kJ mol−1 | (8) |
| Fe0.947O(s) + CO(g) ⇌ 0.947 Fe(s) + CO2(g) ΔH°1123 K = −16.6 kJ mol−1 | (9) |
| 2Fe3O4(s) + 1/2O2(g) ⇌ 3Fe2O3(s) ΔH°1123 K = −237.2 kJ mol−1 | (10) |
In the first reactor, viz. the fuel reactor, reactions (4)–(9) would be conducted, where haematite (Fe2O3) is reduced by CO and H2 sequentially to magnetite (Fe3O4), wüstite (Fe0.947O) and iron (Fe). Both wüstite and iron can be then oxidised by steam in the second reactor, viz. the steam reactor, according to the reverse of reactions (3) and (5). The solid product, magnetite, is further oxidised to haematite according to the exothermic reaction (10), in the third reactor, viz. the air reactor, which provides heat to the system. Overall, the chemical energy of the synthesis gas is used to produce hydrogen by splitting water via chemical looping of the iron oxide. Of course, the hydrogen used during the reduction is mixed with CO, whereas the hydrogen produced in this manner is effectively free from carbonaceous contamination, and has high purity.2
One of the major challenges in the production of hydrogen by chemical looping is the development of a stable oxygen carrier capable of being reduced and oxidised over many cycles without deactivation. When almost pure iron oxide (99 wt% haematite) is used as an oxygen carrier, the reduction of Fe3O4 to Fe in each cycle led to rapid deactivation within the first few cycles.2 However, by limiting the extent of reduction to wüstite (FeO) in every cycle, a stable hydrogen yield could be obtained over more than 10 redox cycles.2 Nevertheless, the transition between Fe and Fe3O4 produces about four times as much hydrogen as the transition between wüstite (FeO) and magnetite (Fe3O4), for a given mass of iron, so that reduction to iron is desirable to maximise yield. Further studies have shown that supporting the iron oxide on Al2O3 could stabilise the performance of iron-based oxygen carriers.5–7 However, it was also found that hercynite, FeAl2O4, was inevitably formed in the presence of Al2O3 and this slowed down the rate of reduction of the supported iron oxide when the latter was reduced beyond Fe3O4.8 Here, FeAl2O4 belongs to the spinel group of crystalline phases with a general formula of AB2O4, where the A-sites are typically occupied by divalent cations and B-sites by trivalent cations. On the other hand, it was hypothesised by Kidambi et al.,7 that the formation and destruction of solid phases on each redox cycle might be important in maintaining the activity of the oxygen carrier. However, Liu et al.9 have demonstrated the stabilising effect of a ZrO2 support on the performance of iron oxide oxygen carriers for chemical looping hydrogen production. The support in this system is chemically stable, and no phases involving iron oxide are formed. Therefore, albeit desirable, it is not strictly necessary for there to be changes of phase to promote a carrier's stability over many cycles. Nevertheless, one drawback of using ZrO2 as a support material for chemical looping is its high cost relative to common refractory materials, e.g. Al2O3.
To avoid the formation of FeAl2O4, several researchers have proposed using MgAl2O4 as a replacement for Al2O3 as a support material on the basis that it prevents spinel formation with the transition metal oxides for chemical looping combustion operations.10–12 It was found that the use of MgAl2O4 (melting point = 2135 °C) as a support material gave both excellent mechanical strength and thermal resistance, whilst the reactivity of the active metal oxides for chemical looping combustion was preserved.10–12 Interestingly, when CuO is used as a chemical looping agent, researchers have reported that the formation of the spinel phase CuAl2O4 is inhibited in the presence of trace amounts of alkali metals (e.g. Na and K).13–15 The source of these alkali metal “contaminants” is most likely to be the Na- and K-dawsonites, viz. NaAlCO3(OH)2 and KAlCO3(OH)2, respectively, during the preparation of the oxygen carriers by co-precipitation.
The aim of the present study is to investigate the potential to use oxygen carriers containing a mixture of Fe2O3, Al2O3, Na2O and, or, MgO for producing hydrogen by chemical looping, because the use of Na2O and MgO could potentially inhibit the formation of FeAl2O4 by forming NaAlO2 and MgAl2O4 with Al2O3 instead. Two oxygen carriers were synthesised: one containing oxides of Fe, Al and Na and another containing oxides of Fe, Mg, Al and Na. Both oxygen carriers were investigated under conditions which simulate the production of hydrogen by chemical looping. The formation and interaction of different phases of mixed oxides during repeated redox cycling were studied using ex situ characterisation techniques.
2. Experimental
2.1. Preparation of oxygen carriers
The oxygen carriers containing (a) oxides of Fe, Al and Na, and (b) oxides of Fe, Mg, Al and Na are hereinafter referred to, respectively, as NAFO and NMAFO. Both oxygen carriers were synthesised using the method of co-precipitation with a slowly decreasing pH. In both cases, the precipitant used was an aqueous solution containing NaOH (≥98 wt%, Fisher Scientific) and Na2CO3 (≥99.5 wt%, Fisher Scientific) mixed at a molar ratio of 1![[thin space (1/6-em)]](https://www.rsc.org/images/entities/char_2009.gif) :
:![[thin space (1/6-em)]](https://www.rsc.org/images/entities/char_2009.gif) 1 to give a total concentration of [Na+] ∼ 4 M. The precursors were aqueous solutions containing nitrates of Mg2+, Al3+ and Fe3+, viz. Mg(NO3)2·9H2O (BioXtra, ≥98 wt%, Sigma-Aldrich), Al(NO3)3·9H2O (ACS reagent, ≥98 wt%, Sigma-Aldrich) and Fe(NO3)3·9H2O (ACS reagent, ≥98 wt%, Sigma-Aldrich), with a total cationic concentration of 2 M. The ratios of [Mg2+]
1 to give a total concentration of [Na+] ∼ 4 M. The precursors were aqueous solutions containing nitrates of Mg2+, Al3+ and Fe3+, viz. Mg(NO3)2·9H2O (BioXtra, ≥98 wt%, Sigma-Aldrich), Al(NO3)3·9H2O (ACS reagent, ≥98 wt%, Sigma-Aldrich) and Fe(NO3)3·9H2O (ACS reagent, ≥98 wt%, Sigma-Aldrich), with a total cationic concentration of 2 M. The ratios of [Mg2+]![[thin space (1/6-em)]](https://www.rsc.org/images/entities/char_2009.gif) :
:![[thin space (1/6-em)]](https://www.rsc.org/images/entities/char_2009.gif) [Al3+]
[Al3+]![[thin space (1/6-em)]](https://www.rsc.org/images/entities/char_2009.gif) :
:![[thin space (1/6-em)]](https://www.rsc.org/images/entities/char_2009.gif) [Fe3+] in the precursors for NAFO and NMAFO were 0
[Fe3+] in the precursors for NAFO and NMAFO were 0![[thin space (1/6-em)]](https://www.rsc.org/images/entities/char_2009.gif) :
:![[thin space (1/6-em)]](https://www.rsc.org/images/entities/char_2009.gif) 1
1![[thin space (1/6-em)]](https://www.rsc.org/images/entities/char_2009.gif) :
:![[thin space (1/6-em)]](https://www.rsc.org/images/entities/char_2009.gif) 1.49 and 1
1.49 and 1![[thin space (1/6-em)]](https://www.rsc.org/images/entities/char_2009.gif) :
:![[thin space (1/6-em)]](https://www.rsc.org/images/entities/char_2009.gif) 2
2![[thin space (1/6-em)]](https://www.rsc.org/images/entities/char_2009.gif) :
:![[thin space (1/6-em)]](https://www.rsc.org/images/entities/char_2009.gif) 2.16, respectively. These ratios correspond to mass fractions of Fe2O3 of 71.4% and 54.9%, respectively, in NAFO and NMAFO, if neither oxygen carriers contained Na+ or any other metal elements. The ratio of [Mg2+]
2.16, respectively. These ratios correspond to mass fractions of Fe2O3 of 71.4% and 54.9%, respectively, in NAFO and NMAFO, if neither oxygen carriers contained Na+ or any other metal elements. The ratio of [Mg2+]![[thin space (1/6-em)]](https://www.rsc.org/images/entities/char_2009.gif) :
:![[thin space (1/6-em)]](https://www.rsc.org/images/entities/char_2009.gif) [Al3+] of 1
[Al3+] of 1![[thin space (1/6-em)]](https://www.rsc.org/images/entities/char_2009.gif) :
:![[thin space (1/6-em)]](https://www.rsc.org/images/entities/char_2009.gif) 2 for NMAFO corresponds to the stoichiometric formation of MgAl2O4, ignoring Fe. The total number of moles of NaOH and Na2CO3 in the alkali solution (the precipitant) was 3 times the total number of moles of metal ions (Mg2+, Al3+ and Fe3+) in the nitrate solution (the precursor).
2 for NMAFO corresponds to the stoichiometric formation of MgAl2O4, ignoring Fe. The total number of moles of NaOH and Na2CO3 in the alkali solution (the precipitant) was 3 times the total number of moles of metal ions (Mg2+, Al3+ and Fe3+) in the nitrate solution (the precursor).
The precipitation was undertaken isothermally at 373 K, at atmospheric pressure. During precipitation, the precursor was added at a constant rate of ca. 1 drop per second to a 1 L flask containing the alkali solution, which was stirred constantly at 600 rpm. The temperature of the solution in the flask was held constant at 100 °C, below the point at which the slurry boiled. Loss of water by evaporation was prevented by condensing and refluxing all the vapour at the outlet of the flask. After the addition of the last drop of nitrate solution, the precipitate was kept stirred at 373 K for an additional 24 h. The final pH of the resulting slurry was found to be 10.0 ± 0.2. Then, the slurry was washed repeatedly with de-ionised water (with an ionic conductivity of ∼20 μS cm−1) until the ionic conductivity of the wash water fell below 120 μS cm−1. Approximately 120 L of de-ionised water was used, over 4 exchanges, to wash each batch of precipitate which yielded 20 g of calcined oxygen carrier. The washed precipitates were filtered, dried at 353 K in air for 24 h, and fired at 1223 K for 3 h. The resulting cake of oxygen carrier was crushed and sieved to a size fraction of 300–425 μm for experiments in a packed bed reactor.
2.2. Characterisation of the solids
To characterise the crystalline phases in the solid samples, X-ray powder diffraction (XRD) were performed on a Panalytical X'Pert Pro diffractometer using Cu Kα radiation (wavelength = 1.5418 Å), operated at 40 kV and 40 mA. The angle of reflection, 2θ, was varied between 5 and 60°, at a rate of 0.0167° per step where each step takes 16.5 s. The diffraction patterns were collected at ambient temperature and atmosphere. The collected diffractograms were preliminarily inspected with the aid of reference patterns found in the Inorganic Crystal Structure Database (ICSD). Rietveld refinements were further performed on the collected diffractograms using GSAS with the graphical interface EXPGUI.16,17 To investigate the elemental composition of the oxygen carriers, loose powders of the oxygen carriers were analysed by an S4 Explorer X-ray fluorescence spectrometer (XRF) system (Bruker AXS GmbH). The surface morphologies of the solid samples were inspected by a scanning electron microscope (NOVA NANOSEM, FEI), with a secondary electron detector, an accelerating voltage of 5 kV and probe current of 2 nA under high-vacuum (6 × 10⁻⁵ mbar). The samples were sputter-coated with Pt prior to examination by SEM. Energy-dispersive X-ray spectroscopy (EDS) analyses were performed on selected spots on the surface of the solid samples within the same SEM, using an accelerating voltage of 15 kV. The elemental composition at these spots was quantified using the collected EDS spectra and existing calibrations.The oxygen content available for reduction and oxidation in the oxygen carriers was quantified by reducing the samples isothermally in a thermogravimetric analyser (TGA/DSC1, Mettler Toledo). In a typical TGA experiment, ca. 20 mg of fully oxidised sample was placed in a 70 μL alumina crucible, and heated to 1223 K at a rate of 20 K min−1 under a flow of N2 (BOC Ltd.) of 50 mL min−1 (measured at 295 K, 1 atm). After degassing for one hour at 1123 K, an additional flow of 50 mL min−1 (measured at 295 K, 1 atm) of 5 vol% H2 in N2 (Spectrashield, BOC Ltd.) was introduced to the reaction chamber for 10 h before cooling down in N2 at a rate of −20 K min−1. The change in mass of the samples was recorded and the mass fraction of Fe2O3 in the fully oxidised sample was calculated, as shown later in Section 5.1.
To investigate the performance of the oxygen carriers, the samples were cycled under conditions suitable for producing hydrogen by chemical looping in a vertical packed bed. The wall of the tubular reactor (nominal I.D. = 9 mm) was made of recrystallised Al2O3 (>99 wt% purity, Multi-Lab Ltd.). The results of an earlier study by Liu et al.9 confirm that the wall of the tube does not react with Fe-based oxygen carriers under chemical looping conditions, and can be therefore considered as inert. The packing arrangement, from top to bottom, consisted of the following layers of materials: (i) 10.0 g α-Al2O3 (1400–1700 μm), (ii) approximately 0.3 g of oxygen carrier particles (300–425 μm), (iii) 2.0 g of α-Al2O3 (300–425 μm), (iv) 2.0 g of α-Al2O3 (1400–1700 μm), and (v) a ceramic distributor plate. The distributor, consisting of three holes of diameter 1.5 mm each in triangular array, was cast using an Al2O3-based cement (AL/CS – chemical setting adhesive cement, Multi-lab Ltd.) inside the tube. Both ends of the alumina tube were fitted with brass fittings with Viton rubber O-rings acting as seals. The control and gas sampling system for the packed bed has been described elsewhere by Liu et al.9
During the cycling experiments in the packed bed, the temperature of the active bed was maintained at 1123 K. In each cycle, the gas supplied to the bed consisted successively of: (i) 5 min of reduction by 9.5 vol% CO in N2 (BOC Ltd.), (ii) 2 min of N2 purge (Air Liquide UK), (iii) 3 min of oxidation by 12 vol% CO2 (Air Liquide UK) in N2 and (iv) 1 min of N2 purge and (v) 2 min of oxidation by air. Switching between the feed-gases was achieved using solenoid valves. In an additional set of experiments, the freshly-prepared oxygen carriers were cycled without step (v), in order to examine the presence of interaction between Al2O3 and oxides of Fe. Should there be interaction between Al2O3 and oxides of Fe, the absence of step (v) would result in a decay in reactivity and consequently deterioration in the conversion of solid over cycles, as shown by Kidambi et al.7 It should be noted that CO2 was used in step (iii) to simulate the oxidation of reduced iron oxide by steam to produce hydrogen, because the equilibrium values of pCO2/pCO and pH2O/pH2 for the oxidation of Fe to wüstite and wüstite to Fe3O4 are similar at 1123 K, where pi stands for partial pressure of species i. The validity of using CO2 to stimulate steam oxidation for chemical looping hydrogen cycles has also been experimentally confirmed by Liu et al.9 The flowrates of gases at the inlet were controlled and monitored using rotameters or mass flow sensors (Honeywell AWM5103VN). In all stages, the nominal gas flowrates were 1.5 L min−1 (measured at 295 K, 1 atm). For each sample, the oxygen carrier was cycled 20 times, with or without air-oxidation, viz. step (v). The effluent gas from the reactor was analysed by a non-dispersive infrared analyser (NDIR, Uras26, EL3020, ABB), which detects the mole fractions of CO and CO2 in the range of 0–10 vol% and 0–12 vol%, respectively.
3. Results
3.1. Characterisation of the uncalcined precipitate
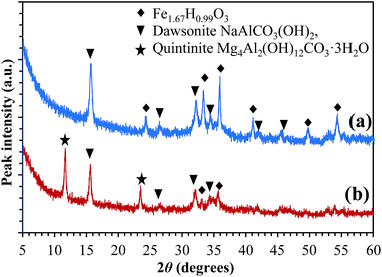
X-ray diffraction patterns of the precipitates were collected to investigate the crystalline phases formed during co-precipitation but before calcining at 1223 K; they are shown in Fig. 1. In Fig. 1(a), it can be seen that the dried precipitate consisted of a mixture of NaAlCO3(OH)2 (dawsonite) and Fe1.67H0.99O3, a dehydrated form of Fe(OH)3. In Fig. 1(b), the peaks at 11.7° and 23.5° are characteristic of the (0 0 2) and (0 0 4) planes, respectively, of Mg4Al2(OH)12CO3·3H2O (quintinite). The fact that the position of the peaks of the quintinite phase matches closely a reference pattern of pure quintinite (Mg4Al2(OH)12CO3·3H2O, ICSD-182293) suggests that the trivalent sites in the quintinite phase contain little or no Fe3+, i.e., almost all Fe3+ precipitated in the form of Fe(OH)3. Peaks of dawsonite are also seen in Fig. 1(b), together with weak peaks of Fe1.67H0.99O3. If there are no amorphous phases present, the precipitates of (a) NAFO and (b) NMAFO, should contain mixtures of (a) dawsonite and Fe(OH)3 and (b) quintinite, dawsonite and Fe(OH)3, respectively. In particular, for NAFO, the composition detected by XRD is also in agreement with the results of XRF shown in Table 1 below. Overall, all peaks in Fig. 1 can be indexed by Fe1.67H0.99O3, dawsonite and quintinite.| XRF analysis, oxide basis (wt%) | |||||
|---|---|---|---|---|---|
| Fe2O3 | Al2O3 | Na2O | MgO | Contaminants | |
| NAFO | 64.3 | 20.7 | 12.2 | 0 | 2.8 |
| NMAFO | 51.7 | 25.2 | 10.7 | 10.2 | 2.1 |
| XRF analysis, metal basis (mol%) | |||||
|---|---|---|---|---|---|
| Fe | Al | Na | Mg | Contaminants | |
| NAFO | 48.9 | 24.7 | 23.9 | 0 | 2.5 |
| NMAFO | 36.4 | 27.8 | 19.4 | 14.4 | 2.0 |
The precipitates of both samples were also examined by SEM, and the images are shown in Fig. 2. Both images in Fig. 2 show large rod-shaped crystallites, which are characteristic of the dawsonite (NaAlCO3(OH)2) phase.18 In Fig. 2(a), it can be seen that the precipitate also contains spherical agglomerates. Assuming no amorphous phase is present, these spherical agglomerates should be the dehydrated precipitate of Fe(OH)3. Fig. 2(b) shows that the precipitates for NMAFO consist of a mixture of rod-shaped crystals and some small grains. Based on the results of XRD, the latter may be assigned to a mixture of quintinite and Fe(OH)3.
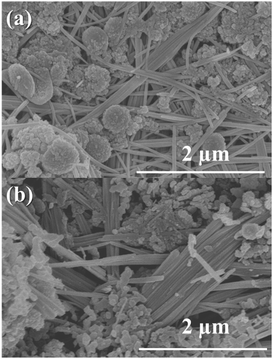 | ||
| Fig. 2 Scanning electron micrographs of the precipitates during the preparation of (a) NAFO and (b) NMAFO. | ||
3.2. Characterisation of the calcined precipitate
The mass fraction of the active iron oxide in the calcined precipitates, i.e. the freshly-prepared oxygen carriers, was determined by isothermal reduction of the calcined samples in a diluted stream of H2 in N2 at 1223 K in the TGA. The change in mass of the samples during reduction was rendered dimensionless:![[m with combining circumflex]](https://www.rsc.org/images/entities/i_char_006d_0302.gif) red(t) = m(t)/m(0), red(t) = m(t)/m(0), | (11) |
![[m with combining circumflex]](https://www.rsc.org/images/entities/i_char_006d_0302.gif) red(t) are shown in Fig. 3. Assuming complete reduction of the samples at the end of the experiment, xFe2O3, the mass fraction of Fe2O3 in the calcined oxygen carrier, was estimated using:
red(t) are shown in Fig. 3. Assuming complete reduction of the samples at the end of the experiment, xFe2O3, the mass fraction of Fe2O3 in the calcined oxygen carrier, was estimated using:xFe2O3 = [1 − ![[m with combining circumflex]](https://www.rsc.org/images/entities/i_char_006d_0302.gif) red(∞)]/0.301, red(∞)]/0.301, | (12) |
![[m with combining circumflex]](https://www.rsc.org/images/entities/i_char_006d_0302.gif) red(∞) equals to
red(∞) equals to ![[m with combining circumflex]](https://www.rsc.org/images/entities/i_char_006d_0302.gif) red at the end of the reduction period.
red at the end of the reduction period.
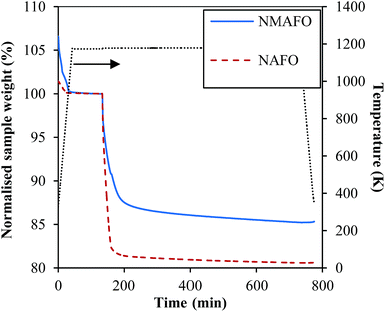 | ||
| Fig. 3 Normalised sample mass versus time during the isothermal reduction of the freshly-prepared oxygen carriers at 950 °C by H2 in N2. | ||
Accordingly, xFe2O3 for NAFO and NMAFO were found to be 64.7 and 49.3 wt%, respectively. Both values are lower than those calculated in Section 2.1, assuming the oxygen carriers contain only oxides of Mg2+, Al3+ and Fe3+. Therefore, the results of the thermogravimetric analysis indicate that both oxygen carriers contain substantial amount of Na+.
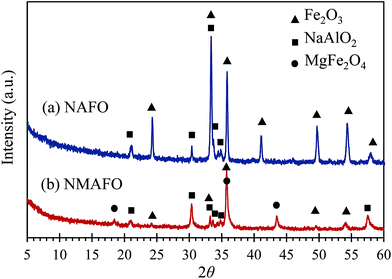
The compositions of the crystalline phases of the calcined oxygen carriers were investigated by XRD, the patterns of which are plotted in Fig. 4. In Fig. 4, NAFO was found to contain Fe2O3 and NaAlO2. For NMAFO, phases of Fe2O3 (haematite), NaAlO2 and MgFe2O4 were found. Interestingly, the product of the possible interaction between MgO and Al2O3, viz. MgAl2O4, which would generate strong diffraction peaks at e.g. 36.9° and 44.9°, was not detected.
In addition to XRD, the elemental composition of the oxygen carriers was quantified by XRF, and results are shown in Table 1. From Table 1, it can be seen that the ratio of [Na] and [Al] is very close to unity in NAFO, indicating that almost all Al3+ precipitated in the form of NaAlCO3(OH)2. The ratio of Fe![[thin space (1/6-em)]](https://www.rsc.org/images/entities/char_2009.gif) :
:![[thin space (1/6-em)]](https://www.rsc.org/images/entities/char_2009.gif) Al in the freshly-prepared NAFO was found to be ∼2, higher than the expected value of 1.49, suggesting some loss of Al3+ during preparation. This could be a result of Al3+ in the precipitate re-dissolving under an alkaline environment by:
Al in the freshly-prepared NAFO was found to be ∼2, higher than the expected value of 1.49, suggesting some loss of Al3+ during preparation. This could be a result of Al3+ in the precipitate re-dissolving under an alkaline environment by:
| Al(OH)3(s) + H2O(l) ↔ [Al(OH)4](aq)− + H(aq)+, | (13) |
| NaAlCO3(OH)2(s) + 2H2O(l) ↔ Al(OH)4−(aq) + HCO3−(aq) + Na(aq)+ + H(aq)+ | (14) |
![[thin space (1/6-em)]](https://www.rsc.org/images/entities/char_2009.gif) :
:![[thin space (1/6-em)]](https://www.rsc.org/images/entities/char_2009.gif) [Al ]
[Al ]![[thin space (1/6-em)]](https://www.rsc.org/images/entities/char_2009.gif) :
:![[thin space (1/6-em)]](https://www.rsc.org/images/entities/char_2009.gif) [Fe] in the freshly-calcined NMAFO is 1
[Fe] in the freshly-calcined NMAFO is 1![[thin space (1/6-em)]](https://www.rsc.org/images/entities/char_2009.gif) :
:![[thin space (1/6-em)]](https://www.rsc.org/images/entities/char_2009.gif) 1.9
1.9![[thin space (1/6-em)]](https://www.rsc.org/images/entities/char_2009.gif) :
:![[thin space (1/6-em)]](https://www.rsc.org/images/entities/char_2009.gif) 2.5, which suggests some loss of Mg2+ and Al3+ during synthesis. However, the ratio of [Mg]
2.5, which suggests some loss of Mg2+ and Al3+ during synthesis. However, the ratio of [Mg]![[thin space (1/6-em)]](https://www.rsc.org/images/entities/char_2009.gif) :
:![[thin space (1/6-em)]](https://www.rsc.org/images/entities/char_2009.gif) [Al] in NMAFO remains roughly the same as its nitrate precursor, in which [Mg]
[Al] in NMAFO remains roughly the same as its nitrate precursor, in which [Mg]![[thin space (1/6-em)]](https://www.rsc.org/images/entities/char_2009.gif) :
:![[thin space (1/6-em)]](https://www.rsc.org/images/entities/char_2009.gif) [Al]
[Al]![[thin space (1/6-em)]](https://www.rsc.org/images/entities/char_2009.gif) :
:![[thin space (1/6-em)]](https://www.rsc.org/images/entities/char_2009.gif) [Fe] = 1
[Fe] = 1![[thin space (1/6-em)]](https://www.rsc.org/images/entities/char_2009.gif) :
:![[thin space (1/6-em)]](https://www.rsc.org/images/entities/char_2009.gif) 2
2![[thin space (1/6-em)]](https://www.rsc.org/images/entities/char_2009.gif) :
:![[thin space (1/6-em)]](https://www.rsc.org/images/entities/char_2009.gif) 2.16. Apart from the major metal elements viz. Na+, Fe3+, Al3+ and Mg2+ in the case for NMAFO, XRF also detected some contamination by trace elements such as Si, Cr and Ca. The oxides of these contaminants make up less than 2.8% of the total mass of the oxygen carriers. These contaminants probably come from impurities in the chemical precursors. Based on the results of XRF, NAFO and NMAFO contain, respectively, 64.3 and 51.7 wt% of Fe2O3, assuming that the metal oxides are fully oxidised and do not form mixed oxides or solid solutions. Here, a solid solution is considered as a single crystal phase, formed from phases with almost identical crystal structure, e.g. Fe3O4 and MgFe2O4. The contents of Fe2O3 deduced by XRF are very close to those estimated from the TGA in Fig. 3, suggesting that all the Fe(III) in both oxygen carriers is eventually reducible in H2 to Fe(0). However, the proportion of Fe(III) practically reducible to Fe(0) during chemical looping is discussed in Section 3.3, below.
2.16. Apart from the major metal elements viz. Na+, Fe3+, Al3+ and Mg2+ in the case for NMAFO, XRF also detected some contamination by trace elements such as Si, Cr and Ca. The oxides of these contaminants make up less than 2.8% of the total mass of the oxygen carriers. These contaminants probably come from impurities in the chemical precursors. Based on the results of XRF, NAFO and NMAFO contain, respectively, 64.3 and 51.7 wt% of Fe2O3, assuming that the metal oxides are fully oxidised and do not form mixed oxides or solid solutions. Here, a solid solution is considered as a single crystal phase, formed from phases with almost identical crystal structure, e.g. Fe3O4 and MgFe2O4. The contents of Fe2O3 deduced by XRF are very close to those estimated from the TGA in Fig. 3, suggesting that all the Fe(III) in both oxygen carriers is eventually reducible in H2 to Fe(0). However, the proportion of Fe(III) practically reducible to Fe(0) during chemical looping is discussed in Section 3.3, below.
3.3. Cyclic performance in chemical looping
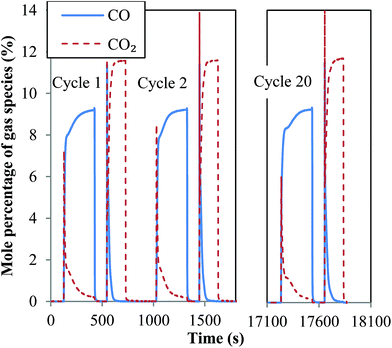
Particles of both oxygen carriers, sized dp = 300–425 μm, were investigated in a packed bed for the chemical looping production of hydrogen at 1123 K. As mentioned above, the production of hydrogen was simulated by the production of CO by oxidising the reduced oxygen carrier in CO2, the redox potential of which is almost identical to that of steam at 1123 K. A total of 20 cycles were performed in each experiment. Profiles of mole fractions of CO and CO2 in the off-gas during the first two cycles as well as the last cycle in a typical cycling experiment are shown in Fig. 5. Here, the concentration of O2 during the air-oxidation was not measured. It can be seen from Fig. 5 that, in the case of NMAFO, the profiles were reproducible over the cycles, showing stable performance. The profile of CO2 produced during reduction, when CO was fed to the inlet, showed an initial sharp rise followed by decay. This is characteristic of the reduction of Fe2O3 successively to Fe3O4, FeO and Fe.19 It should be noted that the concentration of CO2 did not fall to zero at the end of the reduction, suggesting a conversion of Fe2O3 to metallic Fe of less than 100% in each cycle. On the other hand, the rate of oxidation of the reduced carriers by CO2 fell to zero after 90 s, suggesting fast apparent rates cf. reduction. The spike of CO2 at the very beginning of the oxidation in each cycle was a result of insufficient mixing between CO2 and N2 in the feed, immediately after gas-switching, which was achieved using solenoid valves.The conversion from Fe3O4 to Fe, X, was calculated in two ways, when the oxygen carriers were oxidised in air to Fe2O3 at the end of each cycle:
 | (15) |
 | (16) |
 | (17) |
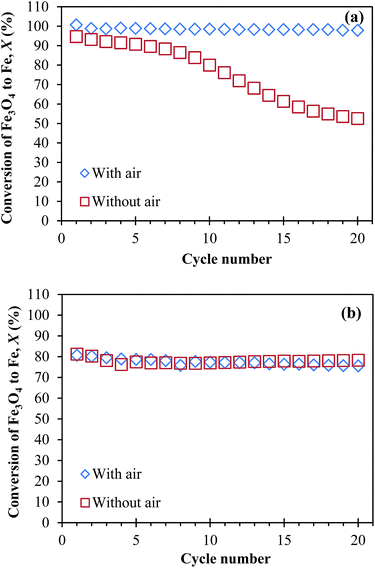
The calculated results of Xred and Xox in each cycle typically differ by less than 1%. Therefore, the arithmetic mean of Xred and Xox was taken as the average value of X in each cycle. The measured X were plotted against cycle number in Fig. 6. Fig. 6(a) shows that, when NAFO was oxidised by air at the end of each cycle, X ∼ 100% consistently over 20 cycles. In contrast, without air, X fell quickly, tending towards 50% by the 20th cycle. This diminution is similar to those reported by Bohn et al.5 and Kidambi et al.,7 who studied oxygen carriers made of Fe2O3 and Al2O3 for chemical looping production of hydrogen and attributed the decaying conversion to the formation of FeAl2O4. Furthermore, Kidambi et al.7 hypothesised two possible reasons for this reduced yield: (i) the presence of the alumina alters the equilibrium for the reduction of iron oxide, making it effectively harder to reduce and (ii) the Fe–Al–O mixture could not prevent sintering over repeated cycles owing to the lack of cyclic phase segregation. In contrast, more consistent performance was seen for NMAFO, as shown in Fig. 6(b), regardless of whether or not air oxidation was used. The measured X, with and without air, equals to ca. 80% over the 20 cycles at 1123 K. These values of X were less than unity owing to the fact that reduction did not reach completion in each cycle, as discussed above.
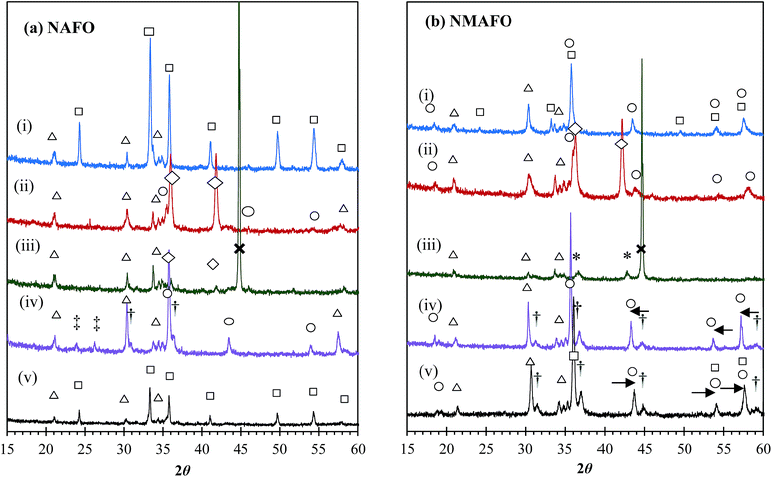
Fig. 7 shows the XRD patterns of the oxygen carriers before and after cycling, as well as the fresh samples after various treatments, viz. (i) reduction in 10% CO in N2 at 1123 K for 10 min and (ii) reduction in a mixture of CO and CO2 (pCO2![[thin space (1/6-em)]](https://www.rsc.org/images/entities/char_2009.gif) :
:![[thin space (1/6-em)]](https://www.rsc.org/images/entities/char_2009.gif) pCO = 1) at 1123 K for 10 min. For NAFO, it can be seen from Fig. 7(a) that, during the reduction of the fresh oxygen carrier, the Fe2O3 is reduced subsequently to Fe3O4, FeO and finally Fe, without any detectable formation of FeAl2O4, i.e. the interaction between FeO and Al2O3 was absent during the first cycle, and hence the initially high X seen in Fig. 6(a). However, peaks of FeAl2O4 can be clearly seen in the sample after 20 cycles without air-oxidation Fig. 7(a)(iv)). This result suggests that there was an accumulation of FeAl2O4 in NAFO over cycles without air-oxidation. Consequently the reactivity of the oxygen carrier decreases gradually and progressively, as seen in Fig. 6(a). Finally, the two diffraction peaks between 21° and 26° seen in Fig. 7(a)(iv) could not be adequately fitted by Rietveld refinement. With air-oxidation, no FeAl2O4 is found after cycling, i.e. FeAl2O4 could not accumulate. When fully oxidised in air, the cycled material has a diffraction pattern Fig. 7(a)(v) almost identical to that of the fresh NAFO Fig. 7(a)(i). These XRD patterns suggest that the formation of FeAl2O4 in NAFO was a slow and irreversible process in the absence of air-oxidation, but could be reserved by oxidising the oxygen carrier in air at the end of each cycle. In addition, the NaAlO2 phase was detected consistently during the reduction and after 20 cycles, indicating it is relatively stable under the conditions used in this study.
pCO = 1) at 1123 K for 10 min. For NAFO, it can be seen from Fig. 7(a) that, during the reduction of the fresh oxygen carrier, the Fe2O3 is reduced subsequently to Fe3O4, FeO and finally Fe, without any detectable formation of FeAl2O4, i.e. the interaction between FeO and Al2O3 was absent during the first cycle, and hence the initially high X seen in Fig. 6(a). However, peaks of FeAl2O4 can be clearly seen in the sample after 20 cycles without air-oxidation Fig. 7(a)(iv)). This result suggests that there was an accumulation of FeAl2O4 in NAFO over cycles without air-oxidation. Consequently the reactivity of the oxygen carrier decreases gradually and progressively, as seen in Fig. 6(a). Finally, the two diffraction peaks between 21° and 26° seen in Fig. 7(a)(iv) could not be adequately fitted by Rietveld refinement. With air-oxidation, no FeAl2O4 is found after cycling, i.e. FeAl2O4 could not accumulate. When fully oxidised in air, the cycled material has a diffraction pattern Fig. 7(a)(v) almost identical to that of the fresh NAFO Fig. 7(a)(i). These XRD patterns suggest that the formation of FeAl2O4 in NAFO was a slow and irreversible process in the absence of air-oxidation, but could be reserved by oxidising the oxygen carrier in air at the end of each cycle. In addition, the NaAlO2 phase was detected consistently during the reduction and after 20 cycles, indicating it is relatively stable under the conditions used in this study.
The XRD patterns of NMAFO at various stages of the cycling experiment are shown in Fig. 7(b). Here, attention is given to the spinel compounds of Fe3O4 and MgFe2O4, which are mutually soluble and have similar diffraction patterns. For example, the (4 0 0) plane of Fe3O4 produces a peak at 43.1° whereas for MgFe2O4 the (4 0 0) peak is at 43.2°. On the other hand, the solid solution of MgFe2O4 and Fe3O4 can be easily distinguished from the alumina-based spinel phases of FeAl2O4 and MgAl2O4, the (4 0 0) reflections of which show peaks 44.4° and 44.9°, respectively. The differences between the positions of corresponding peaks are greater at higher angles according to Bragg's Law. Fig. 7(b)(i) shows that the fresh oxygen carrier consists of a mixture of Fe2O3, MgFe2O4 (possibly with a small amount of Fe3O4) and NaAlO2. Looking at the position of the peaks of Fe2O3 and MgFe2O4, there is no strong evidence to suggest that either phase forms a solid solution with Al2O3 in the fresh NMAFO. After reduction in an equimolar mixture of CO2 and CO (Fig. 7(b)(i)) at 1123 K, the peaks of MgFe2O4 weaken and those of wüstite start to appear (Fig. 7(b)(ii)). After reduction in CO for 10 min, the crystalline phases detectable are MgO, Fe and NaAlO2 (Fig. 7(b)(iii)). During the reduction of fresh NMAFO, NaAlO2 appeared to be the only crystalline phase that contains Al(III), despite the fact that there is more Al than Na in NMAFO. After 20 cycles at 1123 K without air-oxidation (Fig. 7(b)(iv)), the oxygen carrier is found to contain MgFe2O4, Fe3O4, MgAl2O4 and NaAlO2, where the presence of Fe3O4 is manifested by the peaks of MgFe2O4 shifting slightly to a lower 2θ value. With air-oxidation, the XRD pattern of the fully oxidised sample (Fig. 7(b)(v)) shows the same phases as Fig. 7(b)(iv), but with an additional phase of Fe2O3. In Fig. 7(b)(v), the positions of peaks of Fe2O3 and MgFe2O4 are slightly shifted to the right, suggesting the partial dissolution of Al3+ in both phases. The dissolution of Al3+ in MgFe2O4 is not obvious in Fig. 7(b)(iv), because the effect of shift of peaks of MgFe2O4 due to Al3+ might have been cancelled by the opposite effect due to Fe3O4. Overall, the evolution of the XRD patterns in Fig. 7(b) shows that, the MgFe2O4 phase (with some dissolved Fe3O4) was decomposed during reduction, and could be regenerated in CO2. Despite the formation of MgFe2O4, the nearly 80% X seen in Fig. 6(b) demonstrates that this spinel compound did not significantly compromise the reactivity of Fe2O3. In addition, the fact that MgFe2O4 may be regenerated in CO2 means there is a potential to produce more hydrogen per mole of Fe by the steam-oxidation of reduced MgFe2O4 than of pure Fe; this is discussed below in Section 4.2. Lastly, similar to the case of NAFO, NaAlO2 was deemed stable under the conditions used for the cycling tests.
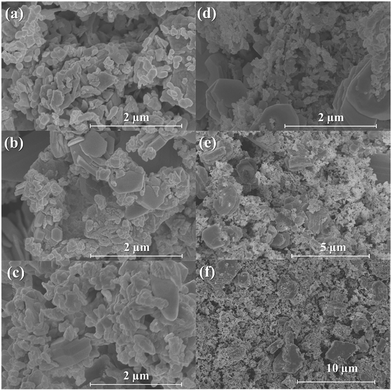
Another important aspect indicating the stability of an oxygen carrier is its change in surface morphology with redox cycling. This was investigated by SEM; the results in Fig. 8 show the morphologies of NAFO when (a) fresh, (b) after 20 cycles without air-oxidation and (c) after 20 cycles with air-oxidation, respectively, as well as the surface of particles of NMAFO when (d) fresh and (e) + (f) after 20 cycles without oxidation in air. In all cases, the disappearance of the rod-shaped grains seen in Fig. 2 can be correlated to the decomposition of dawsonite (NaAlCO3(OH)2). Fig. 8(a) shows that fresh NAFO, the surface of which is relatively porous, is composed of small, irregularly-shaped grains of uniform size. After 20 cycles without air-oxidation, some large hexagonal crystals were found in NAFO, together with some agglomerated small grains of no particular crystalline feature. When cycled with air-oxidation, the surface of NAFO was found to be mainly composed of uniformly-sized grains similar to those seen in Fig. 8(a). A large grain exhibiting a prismatic crystal habit is also seen in Fig. 8(c); this means that the crystallite has an orthorhombic crystal structure, suggesting that it is made of NaAlO2. On the other hand, both fresh and cycled (without air-oxidation) NMAFO were found to contain large hexagonal crystals of ca. 1 μm in size mixed with small grains of ca. 100 nm in size. Interestingly, none of the crystalline phases identified in Fig. 7(b)(iv) crystallises hexagonally. To investigate the nature of the hexagonal crystals seen in energy-dispersive X-ray spectra (EDS) of the corresponding samples were taken at points shown in Fig. 9; and the results of the quantitative analysis are presented in Table 2.
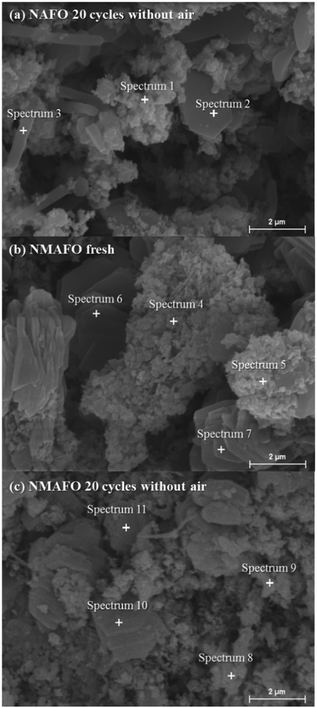 | ||
| Fig. 9 SEM image of the surface of a particle of (a) NAFO after 20 cycles without oxidation by air, (b) fresh NMAFO and (c) NMAFO after 20 cycles without oxidation by air. Positions where EDS spectra were taken are marked by crosses and results are shown in Table 2. | ||
| Spectrum | NAFO 20 cycles without air-oxidation | NMAFO fresh | NMAFO 20 cycles without air-oxidation | ||||||||
|---|---|---|---|---|---|---|---|---|---|---|---|
| 1 | 2 | 3 | 4 | 5 | 6 | 7 | 8 | 9 | 10 | 11 | |
| Al (mol%) | 23 | 52 | 21 | 30 | 31 | 87 | 80 | 22 | 38 | 79 | 74 |
| Fe (mol%) | 63 | 28 | 44 | 26 | 24 | 6 | 10 | 21 | 27 | 15 | 10 |
| Mg (mol%) | 0 | 0 | 0 | 19 | 19 | 1 | 2 | 20 | 23 | 3 | 9 |
| Na (mol%) | 14 | 21 | 35 | 25 | 26 | 6 | 8 | 38 | 13 | 3 | 6 |
Here, it should be noted that, the volume of interaction between the electron beam (with an accelerating voltage of 15 kV) and the solid material is several microns wide. Hence, the EDS collected for the hexagonal grains, e.g. spectra 2, 10 and 11, might also contain signals produced by the surrounding materials. Therefore, the numbers shown in Table 2 should only be regarded as giving a qualitative indication, which can only be used to estimate the chemical compositions of the hexagonal grains, in combination with other experimental results.
The result of EDS analysis (Fig. 9 and Table 2) suggests that these micron-sized hexagonal grains are predominantly made of Al2O3, which means that the “host-phase” of these crystals could be corundum (α-Al2O3), β-alumina ((Na2O)n·(Al2O3)11, where n = 1–1.5), or β′′-alumina ((Na2O)·(Al2O3)6). However, the lack of detection of the corundum peaks in Fig. 7 suggests that, the content of Al2O3 relative to the other phases is low in the bulk of the solid, despite its strong presence at the surface. Furthermore, the strongest peak of Al2O3 at around 35° could overlap with a peak of NaAlO2, making detection of the former even more difficult. From Fig. 9 and Table 2, it can be also seen that, the metal-based elemental composition of the small, 100 nm-sized grains in NAFO was comparable to the analysis by XRF, although the content of Fe in the small grains in NMAFO appears to be underestimated by EDS.
4. Discussion
4.1. Performance of NAFO
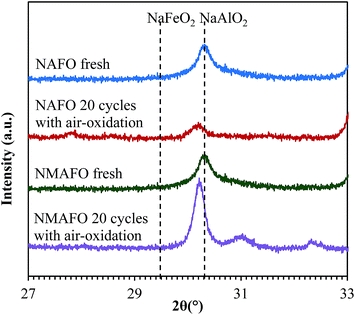
The experimental results suggest that NAFO underwent several phase changes during its initial preparation and also during the subsequent cycling experiments. The interesting features observed during the experimental investigation of NAFO are discussed in this section.Firstly, the chemical inertness of the NaAlO2 phase was investigated by XRD for 27° ≤ 2θ ≤ 33°, with a slow scanning speed of 0.00418° per 50 s per step. The results of the XRD, shown in Fig. 10, indicate that for both NAFO and NMAFO, the (1 2 0) peak of the NaAlO2 phase at 30.3° has shifted slightly to a lower 2θ value after the cycling experiments. Here, the NaAlO2 originates from the dawsonite in the original precipitation. This shift could be explained by the dissolution of Fe3+ into the NaAlO2 phase, forming a solid solution with a general formula NaAl1−yFeyO2 (0 < y < 1), which is stable even at room temperature.20 However, Fig. 2(a) suggests, visually, that Fe(OH)3 and dawsonite (NaAlCO3(OH)2) precipitated heterogeneously during the preparation of NAFO, so that for Fe3+ – from either Fe2O3 or Fe3O4 – to dissolve in the NaAlO2 phase, it would have to migrate a considerable distance to do so. Because the migration of ions in a solid is often a slow process below its melting point, the substitution of Al3+ by Fe3+ in NaAlO2 might therefore be, kinetically, slow, even though thermodynamically favourable.
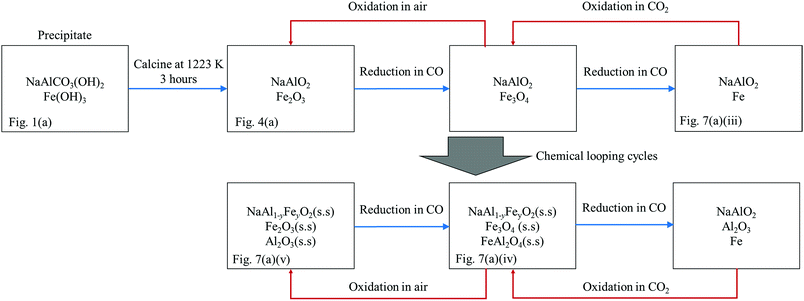
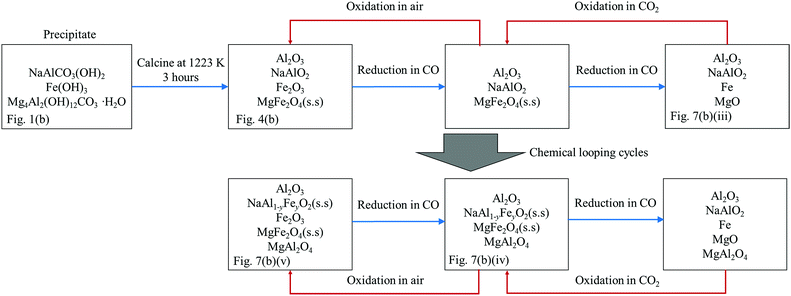
Thus, a plausible explanation to the behaviour of the oxygen carrier is proposed and depicted in Fig. 11. Here, the reaction schematic shown in Fig. 11 postulates that, as a result of the formation of NaAl1−yFeyO2, where y increased gradually with time, an increasing amount Al3+ was displaced from the NaAl1−yFeyO2 phase, and became free to interact with oxides of Fe. Evidence for this explanation comes from XRD measurements on fresh carrier and carrier cycled many times. Initially, the freshly-calcined oxygen carrier contained a mixture of NaAlO2 and Fe2O3, both of which were detected by XRD, as seen in Fig. 7(a)(i). In the first cycle, the only reactive species in the fresh NAFO was Fe2O3, whilst the NaAlO2 was more or less stable, as seen in Fig. 7(a)(i)–(iii). In other words, almost all the Fe3+ in NAFO was present as Fe2O3, which could be reduced completely to Fe, resulting in the observed X of ∼100%. However, peaks of FeAl2O4 can be clearly seen in the sample after 20 cycles without air-oxidation (Fig. 7(a) (iv)), suggesting that a substantial amount of Al3+ was made available to interact with Fe2O3, Fe3O4 and FeO. In particular, the formation of FeAl2O4 has been known to be responsible for the decaying performance of the Fe-based oxygen carriers in the absence of an air-oxidation step.6,7 Thus far, the theory matches the experimental facts.
4.2. Performance of NMAFO
Here, the changes in composition during the preparation and investigation of NMAFO are depicted in Fig. 12 and discussed below. In NMAFO, MgO has been added to the oxygen carrier such that [Mg]![[thin space (1/6-em)]](https://www.rsc.org/images/entities/char_2009.gif) :
:![[thin space (1/6-em)]](https://www.rsc.org/images/entities/char_2009.gif) [Al] = 0.5, a ratio theoretically sufficient to bind all the Al2O3 in the form of MgAl2O4, even if no sodium aluminate phase forms. The results of XRF, shown in Table 1, indicate that in NMAFO the ratio [Al]
[Al] = 0.5, a ratio theoretically sufficient to bind all the Al2O3 in the form of MgAl2O4, even if no sodium aluminate phase forms. The results of XRF, shown in Table 1, indicate that in NMAFO the ratio [Al]![[thin space (1/6-em)]](https://www.rsc.org/images/entities/char_2009.gif) :
:![[thin space (1/6-em)]](https://www.rsc.org/images/entities/char_2009.gif) [Na] is ≫ 1. Therefore, besides NaAlO2, there should be at least one more Al-containing phase present in the freshly-calcined oxygen carrier. The results of EDS analysis, shown in Fig. 9 and Table 2, suggest that this Al-containing phase could be Al2O3 (corundum), which appears to be stable in the form of large hexagonal crystals before and after the cycling experiments, with or without air-oxidation. In addition, the absence of MgAl2O4 peaks in Fig. 7(b)(i)–(iii), and the absence of cubic crystals in Fig. 8(d), suggest that the fresh NMAFO contains very little MgAl2O4.
[Na] is ≫ 1. Therefore, besides NaAlO2, there should be at least one more Al-containing phase present in the freshly-calcined oxygen carrier. The results of EDS analysis, shown in Fig. 9 and Table 2, suggest that this Al-containing phase could be Al2O3 (corundum), which appears to be stable in the form of large hexagonal crystals before and after the cycling experiments, with or without air-oxidation. In addition, the absence of MgAl2O4 peaks in Fig. 7(b)(i)–(iii), and the absence of cubic crystals in Fig. 8(d), suggest that the fresh NMAFO contains very little MgAl2O4.
As with NAFO, NaAl1−yFeyO2 was progressively formed with cycling and its presence verified by XRD, with evidence shown in Fig. 10. Therefore, analogous to the case for NAFO, it is suggested here that the initially pure NaAlO2 phase is gradually doped with Fe3+, progressively forming NaAl1−yFeyO2 over the course of the cycling experiments. Then, the displaced Al3+ ions are simultaneously absorbed by: MgFe2O4 + Al2O3 = MgAl2O4 + Fe2O3. Consequently, MgAl2O4 accumulated over time, and is clearly seen in Fig. 7(b) (iv) and (v). In the extreme scenario where all the Al3+ ions are eventually displaced by Fe3+ in the NaAl1−yFeyO2 phase, a ratio of [Mg]![[thin space (1/6-em)]](https://www.rsc.org/images/entities/char_2009.gif) :
:![[thin space (1/6-em)]](https://www.rsc.org/images/entities/char_2009.gif) [Al] of 0.5 would ensure that FeAl2O4 does not form. Hence, the oxygen carrier showed consistent conversion from Fe3O4 to Fe of ∼80% with or without air-oxidation over 20 cycles at 1123 K. In passing, it should be also noted that the conversion is less than unity in Fig. 6(b) because the reduction was not completed in each cycle, as indicated by the non-zero [CO2] at the end of each reduction step in Fig. 5.
[Al] of 0.5 would ensure that FeAl2O4 does not form. Hence, the oxygen carrier showed consistent conversion from Fe3O4 to Fe of ∼80% with or without air-oxidation over 20 cycles at 1123 K. In passing, it should be also noted that the conversion is less than unity in Fig. 6(b) because the reduction was not completed in each cycle, as indicated by the non-zero [CO2] at the end of each reduction step in Fig. 5.
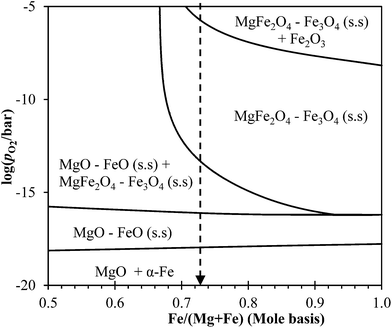
Prior to the formation of MgAl2O4, all the MgO is assumed to be present in the form of MgFe2O4, as shown in Fig. 12. Thus, the reactive phases in the freshly-calcined NMAFO should be, by simple stoichiometry, a mixture of 51.0 wt% MgFe2O4 and 13.9 wt% Fe2O3, with a ratio of [Fe]/([Fe] + [Mg]) ∼ 0.73, together with NaAlO2, which remains effectively stable during the first cycle. After cycling, the XRD patterns in Fig. 7(b)(iv) and (v) suggest that there remains substantial amounts of MgFe2O4. In contrast with FeAl2O4, the spinel MgFe2O4 formed in NMAFO appeared to be readily reducible under the conditions of experimentation used and so its formation did not lead to a fall in the reactivity of NMAFO.
The phase diagram of the Mg–Fe–O system at 1123 K, calculated using MTDATA21 and plotted in Fig. 13, can be used to explore the thermodynamics further. Fig. 13 shows that, in the Mg–Fe–O system, the reduction of NMAFO, in which Fe/(Fe + Mg) > 0.68, involves three phase transitions: (i) haematite to MgFe2O4–Fe3O4 solid solution, (ii) MgFe2O4–Fe3O4 solid solution to MgO–FeO solid solution, and (iii) MgO–FeO solid solution to metallic Fe. These three phase transitions are analogous to the three phases in the reduction of Fe2O3 sequentially to Fe3O4, FeO and Fe. However, in the presence of Mg2+, the phase transitions from haematite to spinel (Fe3O4 and MgFe2O4) and then to halite (MgO and FeO) occur at higher values of equilibrium pO2 than for the corresponding transitions with pure iron oxides. Thus, thermodynamically, the MgO–Fe2O3 mixture could in fact be more readily reducible than pure Fe2O3. On the other hand, in a commercial chemical looping process, where the reduced oxygen carrier is oxidised by steam, the hydrogen produced by the reduced NMAFO would be more dilute than that by pure Fe, because of the shifted-equilibrium; this is a potential drawback because more steam is needed for each mole of hydrogen produced using NMAFO. Another implication of the Mg–Fe–O phase diagram is that, in NMAFO, a larger proportion of Fe could be oxidised to Fe(III) by steam than for pure Fe2O3. However, taking into account the dilution by MgO, the theoretical yield of hydrogen per unit mass of fully-oxidised oxygen carrier, for any MgFe2O4–Fe2O3 mixture, is still lower than that for unmodified Fe2O3. To investigate the assertions mentioned above, the behaviour of a mixed oxide containing only Mg and Fe, e.g. MgFe2O4, should be studied in future work. Interestingly, a molar ratio of Mg![[thin space (1/6-em)]](https://www.rsc.org/images/entities/char_2009.gif) :
:![[thin space (1/6-em)]](https://www.rsc.org/images/entities/char_2009.gif) Fe
Fe![[thin space (1/6-em)]](https://www.rsc.org/images/entities/char_2009.gif) :
:![[thin space (1/6-em)]](https://www.rsc.org/images/entities/char_2009.gif) Al = 3.5
Al = 3.5![[thin space (1/6-em)]](https://www.rsc.org/images/entities/char_2009.gif) :
:![[thin space (1/6-em)]](https://www.rsc.org/images/entities/char_2009.gif) 6
6![[thin space (1/6-em)]](https://www.rsc.org/images/entities/char_2009.gif) :
:![[thin space (1/6-em)]](https://www.rsc.org/images/entities/char_2009.gif) 1 could be fruitful in future investigations, because such a composition corresponds to an oxygen carrier consisting of MgFe2O4 (as an active component) and MgAl2O4 (as a support). Thus, the use of Mg2+ as an inhibitor as well as a promoter might be optimised.
1 could be fruitful in future investigations, because such a composition corresponds to an oxygen carrier consisting of MgFe2O4 (as an active component) and MgAl2O4 (as a support). Thus, the use of Mg2+ as an inhibitor as well as a promoter might be optimised.
Finally, Fig. 13 shows that, during the cycling experiments, the MgFe2O4–Fe2O3 mixture in NMAFO would be transformed between single-phase regions and two-phase mixtures repeatedly. It is believed that cycling between a two-phase mixture and a single-phase solid solution could give oxygen carriers a regenerable porous structure, which renders superior cyclic stability over conventional oxygen carriers, e.g. metal oxides mixed with catalyst supports.7,22 Dunstan et al.22 have suggested that a similar mechanism might explain the longevity of their high-temperature sorbents for the capture and release of CO2, where the solid sorbents undergo changes in molar volume cyclically at a temperature similar to that used in this study. Nevertheless, it must be remembered that, in practice, the oxygen carrier would have to withstand several thousand of cycles of reduction and oxidation. Therefore, other properties, such as resistance against fracture due to repeated change in molar volume and resistance against attrition, must be considered for the future development of the oxygen carrier.
In conclusion, the oxygen carrier NMAFO worked well, probably because (i) the interaction involving Fe–Al–O was prevented by the formation of MgAl2O4 and (ii) the thermodynamic properties of the Mg–Fe–O system were utilised, in which the formation of spinel phase and various solid solutions might have improved the “reducibility” of the Fe-based oxygen carriers. This contrasts with the decaying reactivity seen in the Fe–Al–O system.
In the light of the above results, it would also be interesting to investigate the potential use of other elements in group II, e.g. Ca and Sr, as well as other divalent metal oxides, to stabilise a mixture of Fe–Al–O and to promote the reactivity of oxides of Fe in the chemical looping production of hydrogen. In fact, analogous systems, viz. Ni–Fe–O and Co–Fe–O have been studied by Aston et al.23 for the production of hydrogen by chemical looping. Accordingly, Aston et al.23 found that both NiFe2O4 and CoFe2O4 could be reduced to FeO at higher pCO2/pCO than pure Fe2O3, but at the cost of a higher equilibrium value of pH2O/pH2 during the generation of H2. All of these mixed oxide systems have demonstrated the potential of altering the thermodynamics of conventional oxygen carriers by using mixed oxides for chemical looping, a technique which can be engineered to suit a wide range of chemical processes involving redox reactions.
5. Conclusion
Fe-based oxygen carriers, consisting of oxides of (i) Na, Al and Fe (NAFO) and (ii) Na, Mg, Al and Fe (NMAFO) were synthesised by means of co-precipitation using a technique involving a gradual reduction in the pH of the solution containing the precursor salts. The major components in the precipitates were Fe(OH)3, NaAlCO3(OH)2 (dawsonite), and in the case of NMAFO, Mg4Al2(OH)12CO3·3H2O (quintinite); the corresponding oxygen carriers were obtained by calcining these precipitates. Such formulations could in theory prevent the formation of FeAl2O4, by forming instead the thermodynamically more stable MgAl2O4 and NaAlO2, which could also act as support materials to stabilise the reactivity of the active Fe2O3. The spinel FeAl2O4 leads to a progressive diminution in the yield of hydrogen unless the carrier is fully oxidised on each cycle using air. It was found that, the sodium in NAFO was unable to prevent the interaction between Al2O3 and iron oxide, whereas in NMAFO, the excess MgO used assisted in inhibiting the interaction. When cycled under conditions suitable for producing hydrogen at 1123 K, both oxygen carriers showed stable performance over 20 cycles, demonstrating ∼100% and ∼80%, respectively, of their theoretical capacities to produce hydrogen, when they were oxidised in air at the end of each cycle. However, without air-oxidation, the performance of NAFO was found to decay with cycling, attributed to the gradual, progressive formation of FeAl2O4. In contrast, the performance of NMAFO was found to be stable and consistent with cycling regardless of the inclusion of air-oxidation. The experiments suggested that, although there was some evidence that NaAlO2 resisted the formation of FeAl2O4, this resistance was slowly compromised by the gradual replacement of Al3+ by Fe3+ in NaAlO2, leading to the formation of “free” Al2O3. This alumina reacted with FeO to form the unreactive FeAl2O4 in NAFO. However, in NMAFO, free alumina was postulated to react preferentially with Mg2+ to form MgAl2O4 instead of FeAl2O4 spinel. The unique thermodynamic properties of the Mg–Fe–O system might also be responsible for the outstanding performance of the NMAFO oxygen carrier.Acknowledgements
The authors would like to thank Mr S.J. Griggs from the Department of Materials Sciences and Metallurgy, University of Cambridge for access to SEM; Prof C.P. Grey from the Department of Chemistry, University of Cambridge for access to XRD; the EPSRC funded National Chemical Database Service hosted by the Royal Society of Chemistry for crystallographic data. Financial support from the Engineering and Physical Sciences Research Council (Grant number: EP/G063265/1) is acknowledged. This work is also funded by the National Research Foundation (NRF), Prime Minister's Office, Singapore under its Campus for Research Excellence and Technological Enterprise (CREATE) programme.Notes and references
- B. C. H. Steele and A. Heinzel, Nature, 2001, 414, 345–352 CrossRef CAS PubMed.
- C. D. Bohn, C. R. Müller, J. P. Cleeton, A. N. Hayhurst, J. F. Davidson, S. A. Scott and J. S. Dennis, Ind. Eng. Chem. Res., 2008, 47, 7623–7630 CrossRef CAS.
- A. Messerschmitt, US Pat., 971,216, 1910.
- H. Reed and H. Berg, US Pat. 2,635,947, 1953.
- C. D. Bohn, J. P. Cleeton, C. R. Müller, S. Y. Chuang, S. A. Scott and J. S. Dennis, Energy Fuels, 2010, 24, 4025–4033 CrossRef CAS.
- A. M. Kierzkowska, C. D. Bohn, S. A. Scott, J. P. Cleeton, J. S. Dennis and C. R. Müller, Ind. Eng. Chem. Res., 2010, 49, 5383–5391 CrossRef CAS.
- P. R. Kidambi, J. P. E. Cleeton, S. A. Scott, J. S. Dennis and C. D. Bohn, Energy Fuels, 2012, 26, 603–617 CrossRef CAS.
- J. P. E. Cleeton, Ph.D. thesis, University of Cambridge, 2011.
- W. Liu, J. S. Dennis and S. A. Scott, Ind. Eng. Chem. Res., 2012, 51, 16597–16609 CrossRef CAS.
- P. Gayán, L. F. de Diego, F. García-Labiano, J. Adánez, A. Abad and C. Dueso, Fuel, 2008, 87, 2641–2650 CrossRef PubMed.
- H. Jin, T. Okamoto and M. Ishida, Ind. Eng. Chem. Res., 1999, 38, 126–132 CrossRef CAS.
- T. Mattisson, M. Johansson and A. Lyngfelt, Energy Fuels, 2004, 18, 628–637 CrossRef CAS.
- Q. Imtiaz, A. M. Kierzkowska, M. Broda and C. R. Müller, Environ. Sci. Technol., 2012, 46, 3561–3566 CrossRef CAS PubMed.
- Q. Imtiaz, A. M. Kierzkowska and C. R. Müller, ChemSusChem, 2012, 5, 1610–1618 CrossRef CAS PubMed.
- Q. Song, W. Liu, C. D. Bohn, R. N. Harper, E. Sivaniah, S. A. Scott and J. S. Dennis, Energy Environ. Sci., 2012, 6, 288–298 Search PubMed.
- A. C. Larson and R. B. Von Dreele, General Structure Analysis System (GSAS), Los Alamos national Laboratory Report, LAUR, 2000, pp. 86–748 Search PubMed.
- B. H. Toby, J. Appl. Crystallogr., 2001, 34, 210–213 CrossRef CAS.
- H. Hellevang, J. Declercq, B. Kvamme and P. Aagaard, Appl. Geochem., 2010, 25, 1575–1586 CrossRef CAS PubMed.
- W. Liu, J. Y. Lim, M. A. Saucedo, A. N. Hayhurst, S. A. Scott and J. S. Dennis, Chem. Eng. Sci., 2014, 120, 149–166 CrossRef CAS PubMed.
- R. Davies, A. Dinsdale, J. Gisby, J. Robinson and S. Martin, Calphad, 2002, 26, 229–271 CrossRef CAS.
- J. J. Bara, B. F. Bogacz, T. Jaworska, J. Leciejewicz, M. Styczyńska and A. SzytuŁa, J. Magn. Magn. Mater., 1988, 75, 73–78 CrossRef CAS.
- M. T. Dunstan, W. Liu, A. F. Pavan, J. A. Kimpton, C. D. Ling, S. A. Scott, J. S. Dennis and C. P. Grey, Chem. Mater., 2013, 25, 4881–4891 CrossRef CAS.
- V. J. Aston, B. W. Evanko and A. W. Weimer, Int. J. Hydrogen Energy, 2013, 38, 9085–9096 CrossRef CAS PubMed.
| This journal is © The Royal Society of Chemistry 2015 |

