Modeling the multiple shape memory effect and temperature memory effect in amorphous polymers

Rui Xiao*a, Jingkai Guoa and Thao D. Nguyen*ab
aDepartment of Mechanical Engineering, Johns Hopkins University, Baltimore, MD 21218, USA. E-mail: rxiao4@jhu.edu; vicky.nguyen@jhu.edu
bDepartment of Materials Science and Engineering, Johns Hopkins University, Baltimore, MD 21218, USA

Received 29th September 2014 , Accepted 13th November 2014

First published on 13th November 2014


Abstract

Amorphous polymers achieve a shape memory effect from the tremendous change of chain mobility in the glass transition. The span of the glass transition region has a direct influence on the shape recovery behavior. In this paper, we investigated the shape memory behavior of Nafion, which has an extremely broad glass transition region. We measured the influence of the shape memory programming temperature on the recovery response and multiple shape memory effect. We applied a finite deformation, nonlinear viscoelastic model with a discrete spectrum of relaxation times to describe the shape memory behavior of the material. The parameters of the relaxation spectrum were determined from the master curve of the relaxation modulus. The model was implemented for finite element analysis and applied to design a multiple switchable pattern transformation of a Nafion membrane.

1 Introduction

Amorphous cross-linked polymers achieve their shape memory behavior through reversible glass transition. When the temperature is high, the amorphous networks are in their mobile rubbery state and can be easily deformed to a temporarily programmed shape. The programmed shape can be fixed under either force or displacement constraint by cooling to the immobile glassy state. The polymer can recover the permanent shape when heated above the glass transition temperature (Tg). The temperature range of the glass transition temperature region strongly influences the temperature range of the shape recovery region.1–3 Amorphous shape memory polymers (SMPs) typically exhibit a glass transition region spanning 15–20 °C. A narrower glass transition temperature range is desired for a shorter recovery time. Safranski and Gall systemically investigated the influence of chemical structure and cross-linker density on the glass transition region and the shape recovery behavior.4 By tailoring the chemical compositions, the temperature span of the glass transition region of the acrylate family of polymers can be varied from 20 to 50 °C.

Xie5 demonstrated that the commercially available Nafion PFSA membrane has a broad glass transition region that spans T = 55–130 °C. By employing this broad glass transition region, a multiple shape recovery behavior can be achieved by successively programming the material at different temperatures. The authors showed that the activation temperature for shape recovery of Nafion correlated with the deformation temperature of the programming step.6,7 This phenomenon is known as the temperature memory effect (TME).8 The multiple and temperature memory behaviors have also been demonstrated by Li et al.9,10 using a versatile copolymer with a tailorable broad glass transition behavior. The broad glass transition region can be used to program multiple shapes at distinct temperatures during the glass transition and provide a more complex shape recovery response. In a recent report, Yu and Qi11 demonstrated that the TME also exists for an acrylate-based SMP with a relatively narrow glass transition region.

Numerous works have investigated the shape memory behaviors of amorphous networks by modeling the glass transition.2,12–17 These models typically assume a temperature dependent relaxation time or viscosity. The tremendous change in relaxation time during the glass transition allows the material to store a temporary shape and recover a permanent shape. Our group developed generalized finite deformation models, where the relaxation time is dependent on the temperature, nonequilibrium structure through the fictive temperature, and solvent concentration. The models were used to the study the effects of deformation temperature,3 physical aging,14 solvent absorption18 and stiff inclusions19 on the shape recovery response. We also developed thermomechanical experiments and analysis methods to determine the model parameters and validate the modeling assumptions. The generalized models could be applied to predict the shape memory behavior under a wide variety of shape programming, recovery temperature and mechanical conditions, but required multiple experiments to obtain the model parameters. Yu et al.15 developed a one-dimensional viscoelastic model with a small number of parameters for the multiple shape memory behavior. The model was able to reproduce well the experimental data, but the authors assumed an even distribution of relaxation times. Here, we present a method for measuring the relaxation spectrum to accurately model the multiple and temperature memory effect.

The paper is arranged as follows: section 2 describes the experimental methods to characterize the mechanical properties and shape memory behaviors of Nafion. We then extended the standard rheological model to describe the large deformation, nonlinear viscoelastic behaviors of Nafion and similar amorphous polymers with a broad glass transition region. The model is composed of one elastic element to represent the hyperelastic behavior at high temperatures and multiple Maxwell elements arranged in parallel with a temperature dependent relaxation time to describe the viscoelastic behavior. In the following section, an efficient method is presented to obtain the model parameters using a time–temperature superposition stress relaxation test. Finally, the model with the obtained parameters was adopted to simulate shape memory recovery experiments of Nafion sheets programmed and deployed at different temperatures. The model was also implemented for finite element analysis to design a sequence of pattern transformations for a Nafion membrane.

2 Methods

A Nafion® PFSA membrane with an equivalent molecular weight of 1100 was purchased (Dupont, Wilmington, DE, USA) and cut into strips of 15 mm × 5 mm × 0.25 mm in dimension for dynamic mechanical analysis (DMA) measurements described below. Prior to the DMA measurements, the specimens were annealed for 30 minutes at 160 °C to remove the water in the specimens.

2.1 Materials characterization

2.1.1 Stress relaxation. Stress relaxation experiments were performed using the DMA Q800 (TA Instruments, New Castle, DE, USA). The Nafion strips were equilibrated at 190 °C for 15 minutes and then cooled to 40 °C in 6 °C increments. The specimens were equilibrated at each test temperature for 15 minutes, then subjected to a 0.4% strain and held for 20 minutes for stress relaxation. The relaxation modulus as a function of time was measured at each temperature and then shifted to the reference temperature, T0 = 160 °C, using the method described by Ferry.20 This procedure provided a master curve of the relaxation modulus, which was used to determine the parameters of the viscoelastic relaxation spectrum and the temperature-dependent shift factor a(T).
2.1.2 Dynamic temperature sweep. The dynamic temperature sweep test was used to measure the temperature-dependent storage modulus, loss modulus and tan[thin space (1/6-em)]δ of the Nafion strips. The specimen was equilibrated at 20 °C for 20 minutes and then heated to 180 °C at 1 °C min−1. A 0.4% dynamic strain was applied at 1 Hz at each temperature to measure the dynamic mechanical properties.

2.2 Shape recovery experiments

2.2.1 Temperature memory. The DMA Q800 was also used to measure the free recovery response of the Nafion strips programmed at different deformation temperatures, 155, 120 and 85 °C. The specimens were equilibrated at the deformation temperature for 15 minutes, then stretched to 50% engineering strain in two minutes. The specimens were cooled to 40 °C at 3 °C min−1 at a constant strain and held isothermally for 5 minutes to fix the temporary shape before unloading. To recover the permanent shape, the strips were heated to 180 °C at 1 °C min−1. The displacement of the strips was measured using the zero force mode of the Q800. We chose a relatively low cooling and heating rate to reduce the influence of heat conduction on the shape memory performance.
2.2.2 Multi-stage shape recovery. To investigate the influence of the recovery temperature, the specimens were stretched to 80% engineering strain at 155 °C and cooled to 40 °C. To recover the permanent shape, the specimens were heated in discrete steps at 3 °C min−1. The temperature steps were 40, 100, 120, 140 and 160 °C. The specimens were held for 20 minutes at each step and the displacement was measured under zero force mode.
2.2.3 Dual programming shape recovery. We performed a two-step shape memory programming test. The specimen was equilibrated at 155 °C (the first programming temperature) for 15 minutes and stretched to 40% engineering strain. The specimen was cooled to 120 °C (the second programming temperature) at 3 °C min−1 and held for 5 minutes under isostrain conditions. The specimen was then stretched for another 40% engineering strain before cooling to 40 °C at 3 °C min−1 to fix the temporary shape. To recover the permanent shape, the specimens were heated to 170 °C at 1 °C min−1 under zero force mode. The experiment investigated two additional sets of programming temperatures: (155 °C, 85 °C) and (120 °C, 85 °C).

3 Numerical modeling

3.1 Constitutive modeling

A finite deformation, nonlinear viscoelastic model with multiple parallel relaxation mechanisms was used to describe the shape memory behavior of Nafion. The deformation gradient F is defined to map a point in the undeformed reference configuration to a point in the current deformed configuration. To describe viscoelasticity, the deformation gradient is multiplicatively decomposed into elastic and viscous parts as: F = FeiFvi,i = 1:N. The total and elastic left Cauchy–Green deformation tensors are defined as b = FFT and bei = FeiFeTi. To represent the inherent difference in the time-dependent behavior of the volumetric and deviatoric response, we also split the deformation into distortional and volumetric parts as: [b with combining macron] = J−2/3b and [b with combining macron]ei = Je−2/3bei, where J = det(F) and Jei = det(Fei) are the total and elastic parts of the volumetric deformation ratio.

The Cauchy stress response σ is described as the sum of a time-independent equilibrium distortional component, N time-dependent nonequilibrium distortional components, and a time-independent volumetric component:

 
image file: c4ra11412d-t1.tif(1)
where Geq is the equilibrium shear modulus, Gneqi are the nonequilibrium shear moduli and κ is the bulk modulus.

The following nonlinear evolution equation is adopted for the internal strains, bei,21

 
image file: c4ra11412d-t2.tif(2)
where image file: c4ra11412d-t3.tif and Łv is the Lie time derivative.22 The parameter υrefi is the shear viscosity at the reference temperature and a(T) is the temperature-dependent shift factor. The stress relaxation time is related to the shear viscosity as τrefi = υrefi/Gneqi.

3.2 Parameter determination

As described in Section 2.1.1, the master curve of the relaxation modulus was obtained and is shown in Fig. 1a. Linearizing the viscoelastic model to small strain, the uniaxial tension stress relaxation modulus at the reference temperature can be expressed as:
 
image file: c4ra11412d-t4.tif(3)
where Eeq is the equilibrium Young’s modulus and Eneqi are the nonequilibrium Young’s moduli.

image file: c4ra11412d-f1.tif
Fig. 1 Characterizing the stress relaxation behavior of Nafion: (a) master curve of the relaxation modulus, and (b) the discrete stress relaxation spectrum.

Because the master curve is extremely broad, it is difficult to fit eqn (3) directly to the master curve of the relaxation modulus to obtain the relaxation spectrum (τrefi, Eneqi). Instead, we first evaluated a continuous relaxation spectrum h(τ) from the master curve,20.

 
image file: c4ra11412d-t5.tif(4)

According to Schwarzl and Staverman,23 the continuous relaxation spectrum can be calculated using the following second order accurate approximation method:

 
image file: c4ra11412d-t6.tif(5)

To evaluate eqn (5) for h(τ), we expressed log[thin space (1/6-em)]E as a function of log[thin space (1/6-em)]t by fitting a 7th order polynomial to the master curve of the relaxation modulus plotted on a log–log scale. We next evaluated the continuous cumulative relaxation spectrum as:

 
image file: c4ra11412d-t7.tif(6)

The discreet cumulative relaxation spectrum was evaluated by combining eqn (3), (4) and (6) as:

 
image file: c4ra11412d-t8.tif(7)
where 〈ττrefi〉 = 1 for τ < τrefi.

We next assumed a power law distribution of the relaxation times at the reference temperature as:2

 
image file: c4ra11412d-t9.tif(8)
where τmax and τmin are the maximum and minimum relaxation times chosen based on the relaxation region and N is the number of relaxation processes. The choice of N is a trade off between accuracy and computational cost. Haupt et al.24 presented a detailed discussion of the effect of N on the error of the discrete approximation of the relaxation spectrum. The nonequilibrium moduli Eneqi were calculated such that Hdisc(τ) in eqn (7) formed a staircase approximation for H(τ) in eqn (6):24
 
image file: c4ra11412d-t10.tif(9)

As shown in Fig. 1a, the relaxation modulus continuously decreased with increasing time, though at a very slow rate, and did not exhibit a clear rubbery plateau. We chose Eeq to be the smallest measured stress relaxation modulus. The results for (τrefi, Eneqi) were applied to eqn (3) to calculate the master curve for the discrete viscoelastic model. The results, plotted in Fig. 1a, are in good agreement with the experimental data. The shear moduli were calculated from the Young’s moduli as Geq = Eeq/2(1 + υr) and Gneqi = Eneqi/2(1 + υg), where the rubbery Poisson’s ratio was υr = 0.5 and the glassy Poisson’s ratio was υg = 0.35. The bulk modulus was calculated as: k = Eneq/3(1 − 2υg). The results gave Geq = 0.087 MPa and the bulk modulus κ = 744.4 MPa. Fig. 1b shows the relaxation spectrum (τrefi, Gneqi). The relaxation modulus Gneq(τ) decays very slowly, decreasing by only 3 orders of magnitude over a range of 1024 s during the relaxation time.

The temperature-dependent shift factor was described using a third order polynomial function:

 
a(T) = 2.76 × 10⁻⁶T3 − 4.78 × 10⁻⁴T2 − 0.171T + 28.2, (10)
which provided a good fit to the experimental data, as shown in Fig. 2. Finally, the temperature-dependent storage modulus, loss modulus, and tan[thin space (1/6-em)]δ can be evaluated for the linearized viscoelastic model as:
 
image file: c4ra11412d-t11.tif(11)
where a(T) is the shift factor (eqn (10)).


image file: c4ra11412d-f2.tif
Fig. 2 The temperature-dependent shift factor a(T).

4 Results

The constitutive model was applied first to simulate the dynamic temperature sweep experiments described in Section 2.1.2 using the relaxation spectrum obtained from the stress relaxation tests in Fig. 1. The temperature-dependent storage modulus and tan[thin space (1/6-em)]δ were calculated using eqn (11) for ω = 2π and T = 40–172 °C. The results are compared to the experimental measurements in Fig. 3 and are in good quantitative agreement across the glass transition region. We observed from the tan[thin space (1/6-em)]δ that the glass transition region spanned T = 50–140 °C.
image file: c4ra11412d-f3.tif
Fig. 3 Comparing experimental results and model predictions of dynamic temperature sweep measurements of: (a) the storage modulus, and (b) tan[thin space (1/6-em)]δ.

We applied the model to study the shape recovery of the specimens deformed at different programming temperatures, as described in Section 2.2.1. Fig. 4a shows the experimental and simulation results of the free recovery response of the specimens programmed at 155, 120 and 85 °C. The activation temperature for strain recovery increased with the programming temperature. The simulations showed good agreement with the experimental data especially for the specimens programmed at 155 and 120 °C. For the specimens programmed at 85 °C, the simulation predicted a lower temperature recovery region. The discrepancy was likely caused by structural relaxation, which is a pronounced effect at the onset of the glass transition3 and was not included in the model. To illustrate the physical mechanism behind the effect of the programming temperature, the normalized distribution of nonequilibrium stresses at the end of the cooling period was plotted as a function of the characteristic relaxation time, as shown in Fig. 4b, for each relaxation time τrefi in the discrete relaxation spectrum. The distribution of nonequilibrium stresses was narrow compared to the distribution of relaxation moduli in Fig. 1b because faster processes were able to relax to equilibrium for the programming temperature and applied strain rate. The breadth of the distribution of nonequilibrium stresses decreased with increasing programming temperature, and the peak of the distribution shifted towards smaller relaxation times for lower programming temperatures. This allowed for faster shape recovery. These results were consistent with the observation by Yu et al.,17 where the authors used the concept of the reduced time to investigate the influence of the programming and recovery temperatures on the shape memory performance.


image file: c4ra11412d-f4.tif
Fig. 4 Influence of the deformation temperature on shape recovery. (a) Comparison of experimental and simulation results for the unconstrained recovery behavior at different deformation programming temperatures, (b) the distribution of nonequilibrium stresses at the end of the programming process before unloading.

Fig. 5 shows the experimental and simulation results for the multi-stage shape recovery experiments described in Section 2.2.2. The simulations showed good agreement with the experimental results. At each recovery temperature, the specimens achieved a partial shape recovery, though the results showed that recovery continued to persist at a significantly reduced rate. This demonstrated that multi-stage shape recovery at discrete temperatures is a manifestation of the very broad relaxation spectrum with relaxation time. The distribution of relaxation times for Nafion was significantly larger than laboratory time scale, which allowed the material to obtain a quasi-stable nonequilibrium shape at each recovery temperature.


image file: c4ra11412d-f5.tif
Fig. 5 Comparing the experimental results and model predictions for the free shape recovery response at multiple temperature steps.

Fig. 6 shows the plots of the recovery behavior of specimens programmed at two different temperatures (Section 2.2.3), showing good agreement between experiments and simulations. The initial recovery of the specimens programmed at 155 °C and 85 °C coincided with the recovery curve of the specimens programmed at 120 °C and 85 °C. The two curves separated at 80 °C, which corresponded to the activation temperature for shape recovery of the specimens programmed at 120 °C in the single-step programming experiment (Fig. 4). In contrast, the recovery curves of the specimens programmed at 155 °C and 120 °C and at 155 °C and 85 °C were initially different, but merged at 130 °C. The 130 °C temperature coincided with the temperature at which the specimens programmed at a single temperature (120 °C) achieved full recovery (Fig. 4).


image file: c4ra11412d-f6.tif
Fig. 6 Shape recovery of specimens programmed at two different temperatures, comparing experimental results and model predictions.

The nonlinear viscoelastic model was implemented for finite element analysis (Tahoe©, Sandia National Laboratories) and applied to describe the multiple shape memory effect of a membrane with a periodic array of holes (Fig. 7a).


image file: c4ra11412d-f7.tif
Fig. 7 (a) Schematic presentation of Nafion membrane with a periodic array of circular holes, (b) finite element model of a representative unit cell of the Nafion membrane.

A series of pattern transformations was programmed into the membrane at different temperatures by applying deformations to trigger a mechanical instability.25–28 The numerical examples combined the multiple shape memory effect and mechanical instability to achieve multiple temperature activated pattern transformation. The repeating unit cell shown in Fig. 7 was used to describe a membrane with a periodic array of circular holes. The unit cell was discretized using hexahedral elements and only one layer element was used in the thickness direction, as shown in Fig. 7b.

In order to simulate the deformation through the mechanical instability and bias in the buckled configuration, the shape of the bottom-left circle was perturbed into an ellipse with a major axis that was 0.14% larger than the minor axis. The displacements were fixed as follows: uz(x, y, 0) = 0, ux(0, 0, 0) = 0, uy(0, 0, 0) = 0. In addition, periodic boundary conditions were applied to the x surfaces (AABB, DDCC) and y surfaces (AADD, BBCC). The membrane was deformed in the z direction to −25% engineering strain over 100 seconds at 160 °C. The boundary conditions were chosen to simulate the experiments of Li et al.,28 which used hot-pressing to trigger the pattern transformation of an SMP periodic membrane. The applied programmed shape at different strain levels is shown in Fig. 8. The mechanical instability transformed the circular holes into alternating horizontal and vertical ellipses. The programmed membrane was cooled to 120 °C at 6 °C min−1 and stretched from −25% to 25% engineering strain in the z direction. The tension in the z direction opened the ellipses with the shape returning to the original periodic array of circular holes. The third temporarily programmed shape was achieved by cooling the membrane to 80 °C at 6 °C min−1 and then compressing it again in the z direction to −20% strain at 80 °C. The final shape, an array of alternating horizontal and vertical ellipses, was fixed by cooling the membrane to 40 °C at 6 °C min−1 under fixed compression strain, and unloaded.


image file: c4ra11412d-f8.tif
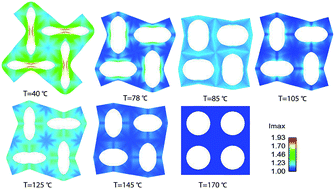
Fig. 8 The shape memory programming and recovery of the Nafion membrane with a periodic array of circular holes showing multiple switchable pattern transformation.

The membrane was heated to 170 °C at 1 °C min−1 to achieve shape recovery under traction-free conditions in z, the thickness direction. The recovered shape is shown in Fig. 8 at different temperatures. As shown at T = 40 °C, unloading in z had a negligible effect on the programmed shape. No pronounced recovery occurred until 70 °C. The elliptical holes continuously opened with increasing temperature until 85 °C, and then closed to reach the ellipses with a larger aspect ratio with increasing the temperature to 125 °C. The elliptical holes then opened again, transforming to the permanent circular shape. The membrane achieved full recovery at 170 °C. As shown, the multiple pattern transformation can be achieved by combining mechanical instability and the multiple shape memory effect. Stretching the thin film in the thickness direction to program the second temporary shape may be difficult to achieve in experiments. Alternatively, pattern transformation can be achieved by deforming the film through uniaxial or biaxial compression in the plane.26,27 Stretching the film in the plane would open the collapsed holes to achieve the second temporary shape for this loading configuration.

5 Conclusions

In this paper, we applied a simple finite deformation, nonlinear viscoelastic model to describe the complex shape memory behaviors of Nafion and similar materials with a broad glass transition temperature region. We also developed a method to obtain the parameters of the relaxation spectrum from the master curve of the relaxation modulus. The model is capable of predicting the influence of the deformation and recovery temperatures on the free recovery response of Nafion films. We also demonstrated the application of the multiple shape memory effect to program a series of switchable pattern transformations in Nafion membranes using finite element simulations.

Acknowledgements

The authors gratefully acknowledge the funding support from the National Science Foundation (CMMI-1130358) and the Laboratory Directed Research and Development program at Sandia National Laboratories. Sandia is a multiprogram laboratory operated by Sandia Corporation, a Lockheed Martin Company, for the United States Department of Energy under contract DE-ACO4-94AL85000.

References

  1. X. Chen and T. D. Nguyen, Mech. Mater., 2011, 43, 127–138 CrossRef PubMed .
  2. T. Nguyen, C. M. Yakacki, P. D. Brahmbhatt and M. L. Chambers, et al., Advanced Materials, 2010, 22, 3411–3423 CrossRef CAS PubMed .
  3. R. Xiao, J. Choi, N. Lakhera, C. Yakacki, C. Frick and T. Nguyen, J. Mech. Phys. Solids, 2013, 61, 1612–1635 CrossRef PubMed .
  4. D. L. Safranski and K. Gall, Polymer, 2008, 49, 4446–4455 CrossRef CAS PubMed .
  5. T. Xie, Nature, 2010, 464, 267–270 CrossRef CAS PubMed .
  6. T. Xie and K. A. Page, Adv. Funct. Mater., 2011, 21, 2057–2066 CrossRef CAS .
  7. J. Li and T. Xie, Macromolecules, 2010, 44, 175–180 CrossRef .
  8. L. Sun and W. M. Huang, Soft Matter, 2010, 6, 4403 RSC .
  9. J. Li, T. Liu, S. Xia, Y. Pan, Z. Zheng, X. Ding and Y. Peng, J. Mater. Chem., 2011, 21, 12213–12217 RSC .
  10. J. Li, T. Liu, Y. Pan, S. Xia, Z. Zheng, X. Ding and Y. Peng, Macromol. Chem. Phys., 2012, 213, 2246–2252 CrossRef CAS .
  11. K. Yu and H. J. Qi, Soft Matter, 2014, 10, 9423–9432 RSC .
  12. J. Diani, Y. Liu and K. Gall, Polym. Eng. Sci., 2006, 46, 486–492 CAS .
  13. J. Diani, P. Gilormini, C. Frédy and I. Rousseau, Int. J. Solids Struct., 2012, 49, 793–799 CrossRef PubMed .
  14. J. Choi, A. Ortega, R. Xiao, C. Yakacki and T. Nguyen, Polymer, 2012, 53, 2453–2464 CrossRef CAS PubMed .
  15. K. Yu, T. Xie, J. Leng, Y. Ding and H. J. Qi, Soft Matter, 2012, 8, 5687–5695 RSC .
  16. Q. Ge, K. Yu, Y. Ding and H. J. Qi, Soft Matter, 2012, 8, 11098–11105 RSC .
  17. K. Yu, Q. Ge and H. J. Qi, Nat. Commun., 2014, 5, 1–9 Search PubMed .
  18. R. Xiao and T. D. Nguyen, Soft Matter, 2013, 9, 9455–9464 RSC .
  19. S. Alexander, R. Xiao and T. D. Nguyen, J. Appl. Mech., 2014, 81, 041003 CrossRef .
  20. J. D. Ferry, Viscoelastic Properties of Polymers, John Wiley and Sons, New York, NY, 1980 Search PubMed .
  21. S. Reese and S. Govindjee, Int. J. Solids Struct., 1998, 35, 3455–3482 CrossRef .
  22. G. A. Holzapfel, Nonlinear solid mechanics: a continuum approach for engineers, John Wiley and Sons, LTD, Chichester, 2000 Search PubMed .
  23. F. Schwarzl and A. Staverman, Appl. Sci. Res., Sect. A, 1953, 4, 127–141 Search PubMed .
  24. P. Haupt, A. Lion and E. Backhaus, Int. J. Solids Struct., 2000, 37, 3633–3646 CrossRef .
  25. W. Hong, Z. Liu and Z. Suo, Int. J. Solids Struct., 2009, 46, 3282–3289 CrossRef CAS PubMed .
  26. T. Mullin, S. Deschanel, K. Bertoldi and M. Boyce, Phys. Rev. Lett., 2007, 99, 084301 CrossRef CAS .
  27. K. Bertoldi, M. Boyce, S. Deschanel, S. Prange and T. Mullin, J. Mech. Phys. Solids, 2008, 56, 2642–2668 CrossRef PubMed .
  28. J. Li, J. Shim, J. Deng, J. T. Overvelde, X. Zhu, K. Bertoldi and S. Yang, Soft Matter, 2012, 8, 10322–10328 RSC .

Footnote

http://sourceforge.net/projects/tahoe/.

This journal is © The Royal Society of Chemistry 2015
Click here to see how this site uses Cookies. View our privacy policy here.