DOI:
10.1039/C4RA08376H
(Paper)
RSC Adv., 2015,
5, 424-433
Numerical investigation of the effects of polypropylene hollow fibre membrane structure on the performance of CO2 removal from flue gas
Received
8th August 2014
, Accepted 12th November 2014
First published on 12th November 2014
Abstract
Carbon dioxide (CO2) absorption from flue gas by hollow fibre membrane contactors is considered as a clean, highly efficient and promising decarburisation technique. Herein, a two-dimensional mathematical model is developed for CO2 absorption from parallel countercurrent mixed gas by a hollow fibre membrane contactor. Using the finite element method, the fibre membrane structure effect on CO2 removal efficiency and mass transfer performance were simulated, including the inner diameter, wall thickness, length, packing density, porosity and tortuosity factor. Three absorbents were chosen: EEA (ethyl-ethanolamine), EDA (ethylenediamine) and PZ (piperazine). The axial and radial diffusion in the membrane contactor, diffusion in the fibre and membrane pores and non-wetting conditions were considered. The simulation results showed that the CO2 removal efficiency and mass transfer rate were reduced with increasing wall thickness, inner diameter and tortuosity factor, and the performance was enhanced with increasing length, packing density and porosity. However, the effects of porosity and tortuosity factor were weak; thus, it was very favourable for making the module. The CO2 removal performance was excellent for a wall thickness in the range of 30–50 μm, an inner diameter of 90–110 μm, a length greater than 150 mm, and a packing density of 21–25% of the membrane structure.
1. Introduction
Carbon dioxide represents about 80% of all greenhouse gases; it causes global warming and has resulted in serious global environmental problems.1 It is reported that half of all CO2 is produced by industry and fossil fuel power plants.2 Thus, it is important to capture CO2 from flue gas to avert the threat of global warming. There are many methods for CO2 removal such as physical adsorption, chemical absorption, cryogenic distillation and membrane separation. However, conventional absorption methods have many deficiencies such as flooding, foaming, channelling, mist entrainment, air entrainment, and high energy consumption or operational costs.3,4 Membrane gas absorption combines the advantages of chemical absorption and membrane separation; thus, it has been widely studied by many researchers.
The hollow fibre membrane contactor (HFMC) is a typical type of equipment used in membrane gas absorption. In an HFMC, the absorbent flows in one side, while the mixture gas flows in the other side. Meanwhile, a gas–liquid interface is formed in the membrane pores, which are filled with gas. In the membrane absorption process, the mixture gas initially diffuses through the gas–liquid interface, and CO2 then reacts with the solution. The driving force of this process is the CO2 concentration difference between the two sides in the membrane. Subsequently, the rich solution can be sent into a gas-liquid separator or other membrane contactors for stripping to remove CO2. The gas membrane separation provides a faster mass transfer rate, good operational flexibility, and a bigger gas–liquid contacting area. Therefore, this technique is considered to be promising for large-scale CO2 capture.5
The CO2 removal performance is affected by many factors such as the kind of absorbent, the connection mode of the membrane module and the membrane structure. Much work has been done by many scholars to study these aspects. The effect of membrane structure on CO2 removal performance has been studied in terms of inner diameter, wall thickness, length, packing density, porosity, pore size, tortuosity degree, etc. Rajabzadeh6,7 studied the effect of hollow fibre membrane wire internal diameter (0.66–1 mm) on CO2 absorption with pure CO2 in PVDF microporous hollow fibre membranes. The results showed that the CO2 export concentration increased linearly with membrane diameter. Based on experiments with different lengths of fibre membranes, Lu et al.8 showed that longer membrane lengths resulted in better mass transfer performance. Mass transfer performance also increased with porosity. Faiz et al.9 investigated CO2 removal from natural gas at high pressure using hydrophobic membranes. The results showed that porosity and CO2 removal rate are positively correlated, while tortuosity factor and CO2 removal rate are inversely related. Meanwhile, the effects of porosity and tortuosity are greater in the chemical absorption process. Eslami et al.10 developed a mathematical model to simulate the behaviour of CO2 removal from flue gas by PG solution in PTFE hollow fibre modules. The simulation results showed that increasing the diameter and number of fibres had positive effects. However, although many researchers have studied the effect of membrane structure on CO2 removal performance, few have reported a comprehensive and systematic study in this area.
Therefore, the aim of the current study is to develop and solve a comprehensive 2D model based on the non-wetting mode in PP HFMC. Assuming axial and radial diffusion inside the tube side, the membrane and the shell side are investigated in this model. This paper focuses on the effects of the inner diameter, wall thickness, length, packing density, porosity and tortuosity factor of fibre membranes using ethyl-ethanolamine (EEA), ethylenediamine (EDA) and piperazine (PZ) as adsorbents. This work provides a reference for making and selecting membrane contactors.
2. Model development and validation
In this research, a steady state 2D mathematical model has been developed to describe the absorption process of CO2 from flue gas using aqueous EEA, EDA and PZ solutions. Fig. 1 shows a schematic diagram of the PP HFMC material module used in the model development. Axial and radial diffusion is considered in the tube, shell and membrane. In this case, the liquid absorbent flows into the tube side (at z = 0), while CO2 flows into the shell side (at z = L) in a countercurrent arrangement. The CO2 first diffuses from the gas phase to the liquid phase through the membrane pores and then reacts with the absorbent in the tube. The flue gas is composed of CO2 and N2 according to a certain proportion.
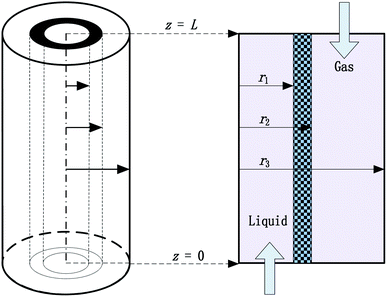 |
| | Fig. 1 Physical model of CO2 absorption in the hydrophobic PP hollow fibre membrane contactor. | |
2.1 Tube side
The steady state continuity equation for the transport and reaction of one species in the tube side due to diffusion, reaction and convection may be written as:| |
 | (1) |
where Ci, Ni and Ri are the concentration, flux and reaction rate of species i, respectively. Fick's law of diffusion can be used to determine the flux of species i:where Di and Vz are the diffusion coefficient and axial velocity along the membrane module length, respectively. Combining eqn (1) and (2) gives the following overall mass transfer equation:| |
 | (3) |
The equation of material balance for CO2 transfer is as follows:
| |
 | (4) |
where
r and
z are the radial and axial distances of species
i, respectively. The velocity distribution is assumed to follow Newtonian laminar flow pattern in the tube:
| |
 | (5) |
where
![[V with combining macron]](https://www.rsc.org/images/entities/i_char_0056_0304.gif) tube
tube is the average liquid flow rate, and
r1 is fibre inner radius. The boundary conditions are given as:
| |
 | (6) |
at
r =
r1,
| |
 | (7) |
at
z = 0,
| | |
CCO2-tube = 0, Cliq-tube = Cliq-tube,initial
| (8) |
where
m is the dimensionless Henry constant.
2.2 Membrane side
Due to the non-wetting of the membrane pore, the steady state mass transfer of CO2 inside the membrane with cylindrical coordinates can be represented by:| |
 | (9) |
The effective diffusion coefficient DCO2-membrane can be approximated by:
| |
 | (10) |
where
ε and
τ are the porosity and tortuosity factor, respectively.
The boundary conditions for the membrane are as follows:
| |
 | (11) |
| | |
at r = r2, CCO2-membrane = CCO2-shell
| (12) |
| | |
at z = 0 and z = L, ∇CCO2-membrane = 0
| (13) |
where
r2 is the outer radius of the fibre.
2.3 Shell side
The steady state material balance for the transfer of CO2 inside the shell side due to diffusion and convection can be represented by:| |
 | (14) |
The convective part for the transfer of CO2 inside the shell Vz-shell is complicated. Assuming Happel's free surface for the model,11 the velocity profile in the shell side will follow the below equation:
| |
 | (15) |
where
![[V with combining macron]](https://www.rsc.org/images/entities/i_char_0056_0304.gif) shell
shell is the average gas flow rate;
r3 is the shell effective radius in the shell side and can be defined as follows:
| |
 | (16) |
| |
 | (17) |
where
ϕ is the volume fraction of the void inside the membrane contactor module.
The boundary conditions for the shell side will be as follows:
| | |
at r = r2, CCO2-shell = CCO2-membrane
| (18) |
| |
 | (19) |
| | |
at z = L, CCO2-shell = CCO2-initial
| (20) |
| | |
at z = 0, NCO2 = CCO2Vz-shell
| (21) |
3. Reaction mechanisms
Li et al.12 studied the reaction kinetics of EEA-CO2 and EDA-CO2. Bishnoi et al.13 experimentally investigated CO2 absorption performance using PZ aqueous solutions and obtained the corresponding kinetic parameters. The chemical formula and structure of the EEA, EDA and PZ solvents are shown in Fig. 2.
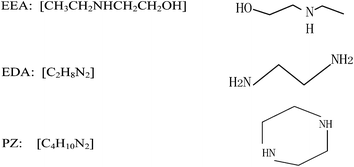 |
| | Fig. 2 Chemical formulae and structures of EDA, EEA and PZ solvents. | |
Because EEA and EDA are both amphoteric ions, the reaction of EEA-CO2 and EDA-CO2 is as follows:
| |
 | (22) |
For example, the reaction of EDA-CO2 is as follows:
| |
 | (23) |
Due to the existing OH−, the reactions of PZ aqueous solution and CO2 are as follows:
| |
 | (24) |
| |
 | (25) |
where
k2,
k2,EDA,
k2,OH− and
k2,PZ are the reaction rate constants for the amphoteric ion, EDA, OH
− and PZ with CO
2, respectively;
k−1 is the corresponding reverse reaction rate constant. The Arrhenius expressions for the chemical reaction rate constants are as follows:
12,14| |
 | (26) |
| |
 | (27) |
| |
 | (28) |
| |
 | (29) |
All the reaction rate equations for the simultaneous reactions are presented below:
| | |
RCO2-EEA = −k2,EEACEEACCO2
| (30) |
| | |
RCO2-EDA = −k2,EDACEDACCO2
| (31) |
| | |
RCO2-PZ = −k2,PZCPZCCO2 − k2,OH−COH−CCO2
| (32) |
4. Model validation
Due to the concentration difference, CO2 diffuses from the shell side to the tube side through the membrane pores. The CO2 concentration is the largest at z = L, and is zero at z = 0. It decreases after the diffusion and mass transfer inside the shell. Fig. 3 depicts the concentration gradient and the total flux vectors of CO2 in the hollow fibre membrane model.
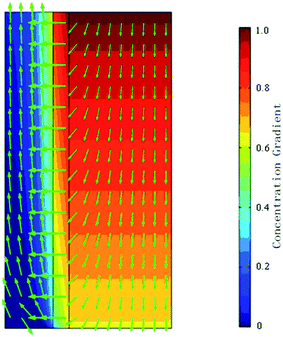 |
| | Fig. 3 Concentration distribution and flux vectors of CO2 flow in the contactor. | |
Generally, the CO2 removal performances are reflected by the CO2 removal efficiency (η) and mass transfer rate (JCO2). Their expressions are as follows:
| |
 | (33) |
| |
 | (34) |
where
η is the CO
2 removal efficiency,
Qin and
Qout are the gas flow rate of the inlet and outlet, respectively,
φin and
φout are the volume fraction of CO
2 at the inlet and outlet, respectively,
Tg is the gas temperature, and
S is the total membrane area.
In order to validate the developed model, the membrane parameters used in the simulation were the same as those in the experiment. The module dimensions and physical and chemical properties are provided in Table 1. The above dimensionless model equations associated with the tube, membrane, and shell sides with the appropriate boundary conditions and properties were solved by the COMSOL Multiphysics software, which uses the computational fluid dynamics (CFD) method for numerical solutions of model equations. For the finite element analysis, the solver UMFPACK was applied due to its memory efficiency. This method was combined with adaptive meshing and error control. This solver, an implicit time-stepping scheme, is well suited for solving stiff and non-stiff nonlinear boundary value problems.
Table 1 Specifications of the hydrophobic PP hollow fibre membrane contactor
| Parameter |
Unit |
Physical meaning |
Value |
Reference |
| r1 |
μm |
Inner tube radius |
172 |
15 |
| r2 |
μm |
Outer tube radius |
221 |
15 |
| δ |
μm |
Wall thickness |
49 |
15 |
| R |
m |
Inner column radius |
0.04 |
15 |
| L |
m |
Module length |
0.8 |
15 |
| n |
|
Number of fibres |
7000 |
15 |
| d |
μm |
Average pore diameter |
0.02 |
15 |
| ε |
% |
Membrane porosity |
45 |
15 |
| τ |
|
Tortuosity factor |
2 |
15 |
| (1 − ϕ) |
% |
Packing density |
21.4 |
15 |
| S |
m2 |
Module area |
6.05 |
15 |
| DCO2-shell |
m2 s−1 |
Diffusion coefficient of CO2 in the shell side |
1.8 × 10⁻⁵ |
16 |
| DCO2-tube |
m2 s−1 |
Diffusion coefficient of CO2 in the tube side |
1.5 × 10⁻⁹ |
17 |
Fig. 4 shows the comparison of the simulation results with the experimental data of Yan et al.,15 who studied the CO2 absorption performance under different simulated flue gas velocities with 1000 mol m−3 PG (potassium glycinate) and MEA solution. Fig. 4 shows that the simulation results are similar to the experimental data. The η was reduced from 93.2% to 65.8%, while the gas flow rate increased from 0.211 m s−1 to 0.526 m s−1. In the simulation results, η decreased from 99.5% to 64.4% under the same conditions. The maximum difference in η was smaller than 10%, and the average difference was just 6.8%. For the 1000 mol m−3 MEA the η decreased from 83.5% to 53.5% in the experiment and from 89% to 49.9% in the simulation. The maximum difference in η was smaller than 6%, and the average difference was 3.7%. The small deviation in parameters was due to misoperation. The curves are similar and show the same tendency in the experimental and simulation results for PG and MEA. Thus, it is reasonable to believe that the model can effectively predict CO2 removal.
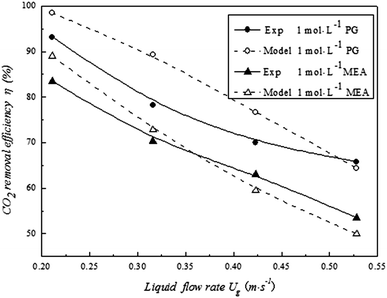 |
| | Fig. 4 Comparison of modelling and experimental results for the CO2 removal efficiency (Tg: 298 K; CO2 volume fraction in feed gas: 14 vol%). | |
5. Results and discussion
The structure of polypropylene hollow fibre membrane mainly consists of the wall thickness, inner diameter, length, packing density, porosity and tortuosity factor, which are investigated for their effects on CO2 removal efficiency and mass transfer rate.
5.1 Effect of fibre membrane wall thickness
The effects of wall thickness on CO2 removal efficiency and mass transfer rate are illustrated in Fig. 5 and 6, respectively. They show that removal efficiency and mass transfer rate decrease with increasing wall thickness. The diffusion time of CO2 from the shell side to the tube side increases with increasing wall thickness. Meanwhile, the motion direction of CO2 is affected by the thickness, resulting in an increase in the gas diffusion resistance. Therefore, the CO2 removal performance showed a downward trend. In addition, the CO2 removal performance of the PZ solution is maximized at a different wall thickness; the performance of EEA is the lowest in Fig. 5 and 6. Therefore, the fibre membrane wall thickness cannot be thick when making the membrane.
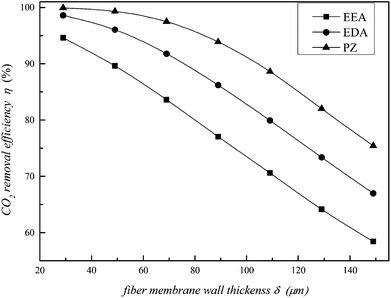 |
| | Fig. 5 Effect of fibre membrane wall thickness on the CO2 removal efficiency. | |
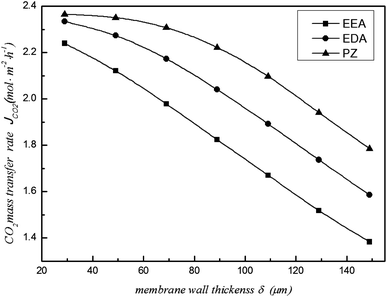 |
| | Fig. 6 Effect of fibre membrane wall thickness on the CO2 mass transfer rate. | |
5.2 Effect of fibre membrane inner diameter
When the gas and liquid flow remain constant, the CO2 removal efficiency and mass transfer rate will decrease with increasing fibre membrane inner diameter (Fig. 7 and 8, respectively). Because of the increasing inner diameter, the flow velocity is slower in the large diameter fibre compared to the small diameter fibre. Thus, the CO2 that is absorbed by the solution is relatively decreased, and the mass transfer per unit of time also reduces. Therefore, the CO2 removal efficiency and mass transfer rate decrease in large diameter fibres. The experimental results of Rajabzadeh6 also verified this conclusion. Furthermore, the difference changes based on the type of absorbent, demonstrating that the influence of inner diameter is different for different absorbents. When r1 = 232 μm, the CO2 removal efficiency of the EEA solution drops to 83%, while the CO2 removal efficiency of the PZ and EDA solutions remain above 91%. The large inner diameter results in a decrease in CO2 removal efficiency and an increase in cost. Thus, when making the membrane, the inner diameter cannot be too large.
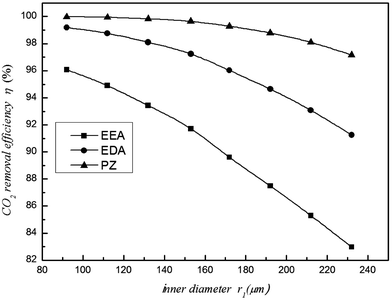 |
| | Fig. 7 Effect of the inner diameter on the CO2 removal efficiency. | |
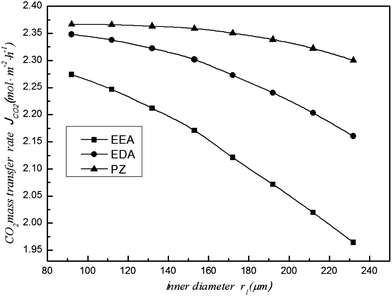 |
| | Fig. 8 Effect of the inner diameter on the CO2 mass transfer rate. | |
5.3 Effect of fibre membrane length
The CO2 removal efficiency changes with the fibre membrane length, while the CO2 mass transfer rate does not change. Fig. 9 shows that η increases with increasing fibre membrane length. When the length is less than 150 mm, the CO2 removal efficiency increases rapidly; when the length is more than 150 mm, the growth becomes slow or even stops. This is due to the increasing detention time of CO2 in the shell, increasing the chance for CO2 absorption. However, η reaches a maximum value when the length reaches a certain value. For example, when L = 150 mm, the CO2 removal efficiency of the PZ solution reaches the maximum (>99%) and becomes stable. However, for the EEA and EDA solutions, a longer length is required to observe this phenomenon. Thus, the fibre membrane length should not exceed 150 mm for PZ to obtain high CO2 removal efficiency and avoid the wasting of material. The length should also be appropriate when choosing the membrane for any other absorbent. In this way, the material and the installation area of the module can be saved. Furthermore, a short fibre membrane is convenient for the process, site installation and system maintenance.
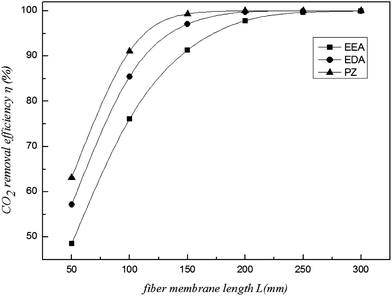 |
| | Fig. 9 Effect of fibre membrane length on the CO2 removal efficiency. | |
5.4 Effect of fibre membrane packing density
If the inner diameter of the module was determined; changing the number of fibres changes the packing density, which will directly influence the CO2 removal performance. Thus, as illustrated in Fig. 10 and 11, the packing density affects the performance. That same result was shown by the experimental study of Lai Chunfang18 and the simulations of Eslami.19 This effect is obvious since the available mass transfer interface increases with increasing fibre packing density. The mass transfer coefficient of the shell side increased. Thus, the CO2 removal efficiency and mass transfer rate can be improved. However, the rise becomes slow when the packing density exceeds 20%. This change is more obvious for PZ and smooth for EDA and EEA; thus, greater packing density is needed for EDA and EEA. In other words, more fibres must be filled to maintain the high CO2 removal efficiency of EEA and EDA compared to PZ.
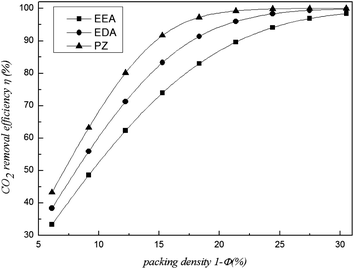 |
| | Fig. 10 Effect of packing density on the CO2 removal efficiency. | |
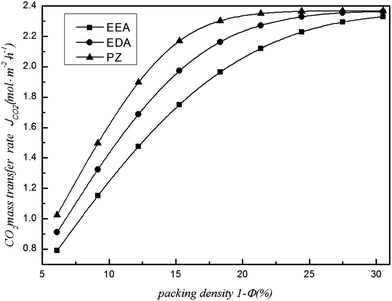 |
| | Fig. 11 Effect of packing density on the CO2 mass transfer rate. | |
If the packing density is too large, the space of the shell side will be reduced, decreasing the amount of gas entering the shell side. The η remains at a high level because the work of the fibre membrane is relatively reduced. Therefore, the packing density should be appropriate in order to save material.
5.5 Effect of fibre membrane porosity
Fig. 12 shows the effects of fibre membrane porosity on the CO2 removal performance. Keeping the tortuosity factor constant, increasing the porosity enhances the diffusion coefficient of the membrane and reduces the mass transfer resistance to encourage mass transfer. However, the growth is small when the porosity increases from 25% to 85% (Fig. 12). Even the maximum increase in EEA is just around 0.5%. Thus, the effect of fibre membrane porosity is weak. Therefore, when we make or choose the module, the fibre membrane porosity should not be too large. Furthermore, a large fibre membrane porosity may decrease the anti-wetting ability, leading to an increase in mass transfer resistance. This is not conducive to mass transfer and absorption of CO2. Meanwhile, a large fibre membrane porosity will reduce the self-supporting ability of the module, increasing the difficulties in membrane manufacturing. Thus, the appropriate porosity should be chosen when designing or making membranes.
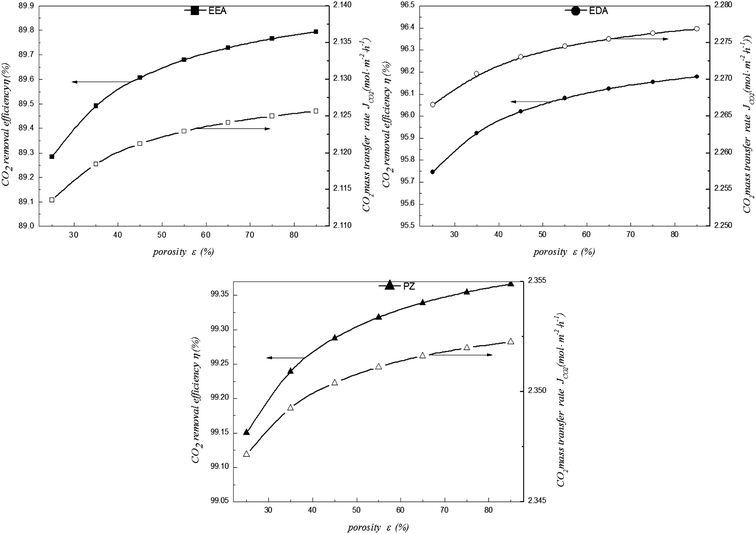 |
| | Fig. 12 Effect of porosity on CO2 removal performance in EEA, EDA and PZ solutions. | |
5.6 Effect of fibre membrane tortuosity factor
It can be seen that the CO2 removal performance is decreased with increasing tortuosity factor (Fig. 13). The diffusion coefficient and the mass transfer resistance of the membrane are enhanced with increasing tortuosity factor, reducing the CO2 removal performance; however, this change is very weak. As tortuosity factor was increased from 1.5 to 5.0, the CO2 removal performance in the EEA solution fell by only about 0.7%. This decrease results from the reduction in the diffusion coefficient of the membrane with increasing tortuosity factor, which increases the mass transfer resistance. Thus, the decarburisation rate and mass transfer rate are both decreased. This phenomenon is very favourable for making the module. An inappropriate tortuosity factor, which reduces the CO2 removal performance, can be neglected during the assembly of the module.
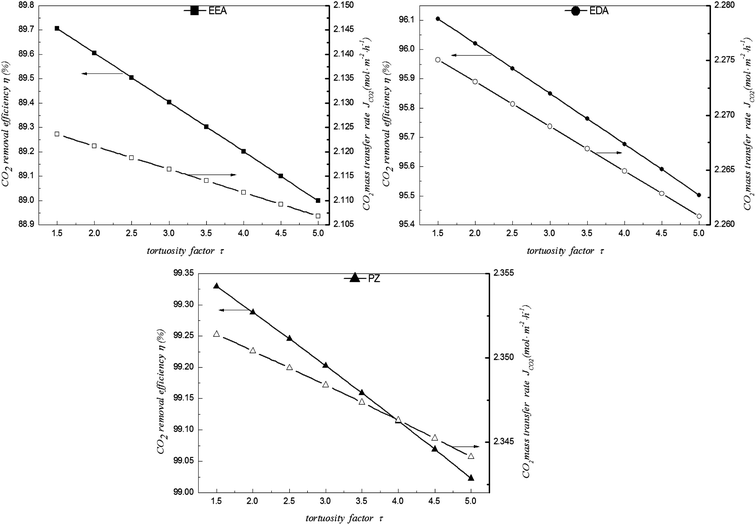 |
| | Fig. 13 Effect of tortuosity factor on CO2 removal performance in EEA, EDA and PZ solutions. | |
According to the results, a CO2 removal efficiency exceeding 90% could be obtained by the combination of various factors of fibre membrane structure: for EEA, a wall thickness less than 50 μm, an inner diameter under 110 μm, a membrane length greater than 150 mm and a packing density greater than 20%; for EDA, a wall thickness less than 75 μm, an inner diameter under 190 μm, a membrane length greater than 115 mm and a packing density greater than 17%; for PZ, a wall thickness less than 110 μm, an inner diameter under 250 μm, a membrane length greater than 100 mm, and a packing density greater than 14%.
6. Conclusion
This paper built a comprehensive 2D mathematical model for membrane gas absorption of CO2 from parallel countercurrent mixed gas under non-wetting conditions in a PP hollow membrane contactor. By using a finite element method, the effects of membrane structure (wall thickness, inner diameter, length, packing density, porosity and tortuosity factor) on the CO2 removal efficiency and mass transfer rate were simulated using three absorbents: EEA (ethyl-ethanolamine), EDA (ethylenediamine) and PZ (piperazine). The simulation results showed that the CO2 removal efficiency and mass transfer rate decrease with increasing wall thickness, inner diameter and tortuosity factor; the performance is enhanced with increasing length, packing density and porosity. However, the influence of porosity and tortuosity factor are weak, which is very favourable for making the module. The membrane structure has excellent CO2 removal performance when wall thickness in 30–50 μm, the inner diameter is 90–110 μm, the length is greater than 150 mm, and the packing density is 21–25%.
Nomenclature
| C | Concentration (mol m−3) |
| d | Average pore diameter (μm) |
| D | Diffusion coefficient (m2 s−1) |
| JCO2 | CO2 mass transfer rate (mol m−2 h−1) |
| k2 | Reaction rate constant (m3 mol−1 s−1) |
| k−1 | Reverse reaction rate constant (m3 mol−1 s−1) |
| L | Length (m) |
| m | Henry constant (mol mol) |
| n | Number of fibres |
| Ni | Flow rate of species i (mol m−2 s−1) |
| Q | Flow rate of gas (m3 s−1) |
| R | Radial distance of species i (m) |
| r1, r2, r3 | Inner radius, outer diameter and free surface radius (μm) |
| Ri | Reaction rate of species i (mol m−3 s−1) |
| S | Contact area of fibre (m2) |
| t | Time (s) |
| T | Temperature (K) |
| U | Velocity (m s−1) |
| V | Instantaneous velocity of gas at a point of module (m s−1) |
| Vz | Axial velocity (m s−1) |
| z | Height of fibre along the length direction (m) |
Greek letters
| ε | Porosity of fibre membrane (%) |
| δ | Wall thickness of fibre membrane (μm) |
| η | CO2 removal efficiency (%) |
| τ | Tortuosity factor of fibre membrane |
| φ | Volume fraction of CO2 in gas (vol%) |
| (1 − ϕ) | Packing density of fibre membrane |
Subscripts
| g | Gas |
| i | Species i |
| l | Liquid |
| in | Inlet |
| out | Outlet |
Abbreviations
| EEA | Ethyl-ethanolamine |
| EDA | Ethylenediamine |
| PZ | Piperazine |
| PG | Potassium glycinate |
| MEA | Monoethanol |
| PVDF | Polyvinylidene fluoride |
| PTFE | Polytetrafluoroethylene |
| PP | Polypropylene |
Acknowledgements
This research is supported by the Fundamental Research Funds for the Central Universities (no. CDJZR14145501), the Chongqing Science and Technology Talent Training Plan (cstc2013kjrc-qnrc90002) and the National Natural Science Foundation of China (Project no. 50906103).
References
- H. Herzog, B. Eliasson and O. Kaarstad, Capturing greenhouse gases, Sci. Am., 2000, 182(2), 72–79 CrossRef PubMed
 .
. - U. Desideri and A. Paolucci, Performance modeling of a carbon dioxide removal system for power plants, Energy Convers., 1999, 40, 1899–1915 CrossRef CAS
 .
. - M. H. Al-Marzouqi, M. H. El-Naas, S. A. M. Marzouk, M. A. Al-Zarooni, N. Abdullatif and R. Faiz, Modeling of CO2 absorption in membrane contactors, Sep. Purif. Technol., 2008, 59(3), 286–293 CrossRef CAS PubMed
 .
. - S. H. Lin, P. C. Chiang, C. F. Hsieh, M. H. Li and K. L. Tung, Absorption of carbon dioxide by the absorbent composed of piperazine and 2-amino-2-methyl-1-propanol in PVDF membrane contactor, J. Chin. Inst. Chem. Eng., 2008, 39(1), 13–21 CrossRef PubMed
 .
. - S. H. Yeon, K. S. Lee, B. Sea, Y. I. Park and K. H. Lee, Application of pilot-scale membrane contactor hybrid system for removal of carbon dioxide from flue gas, J. Membr. Sci., 2005, 257(1–2), 156–160 CrossRef CAS PubMed
 .
. - S. Rajabzadeh, S. Yoshimoto and M. Teramoto, et al. CO2 absorption by using PVDF hollow fiber membrane contactors with various membrane structures, Sep. Purif. Technol., 2009, 69(2), 210–220 CrossRef CAS PubMed
 .
. - S. Rajabzadeh, S. Yoshimoto and S. Yoshimoto, et al. Effect of membrane structure on gas absorption performance and long-term stability of membrane contactors, Sep. Purif. Technol., 2013, 108, 65–73 CrossRef CAS PubMed
 .
. - L. Jiangang, Z. Youfei, Y. Yan, X. Jianqiang and C. Mindong, Process Simulation for Module Operation of Hydrophobic Hollow Fiber Membrane, Journal of Nanjing Institute of Meteorology, 2008, 31(5), 718–722 Search PubMed
 .
. - R. Faiz and M. Al-Marzouqi, CO2 removal from natural gas at high pressure using membrane contactors: model validation and membrane parametric studies, J. Membr. Sci., 2010, 365(1–2), 232–241 CrossRef CAS PubMed
 .
. - S. Eslami, S. M. Mousavi, S. Danesh and H. Banazadeh, Modeling and simulation of CO2 removal from power plant flue gas by PG solution in a hollow fiber membrane contactor, Adv. Eng. Software, 2011, 42(8), 612–620 CrossRef PubMed
 .
. - J. Happel, Viscous flow relative to arrays of cylinders, AIChE J., 1959, 5(2), 174–177 CrossRef CAS
 .
. - J. Li and A. Henni, Paitoon Tontiwachwuthikul, Reaction Kinetics of CO2 in Aqueous Ethylenediamine, Ethyl Ethanolamine, and Diethyl Monoethanolamine Solutions in the Temperature Range of 298–313 K, Using the Stopped-Flow Technique, Ind. Eng. Chem. Res., 2007, 46(13), 4426–4434 CrossRef CAS
 .
. - S. Bishnoi and G. T. Rochelle, Absorption of carbon dioxide into aqueous piperazine: reaction kinetics, mass transfer and solubility, Chem. Eng. Sci., 2000, 55, 5531–5543 CrossRef CAS
 .
. - W.-C. Sun, C.-B. Yong and M.-H. Li, Kinetics of the absorption of carbon dioxide into mixed aqueous solutions of 2-amino-2-methyl-l-propanol and piperazine, Chem. Eng. Sci., 2005, 60(2), 503–516 CrossRef CAS PubMed
 .
. - S.-P. Yan, M.-X. Fang and W.-F. Zhang, et al. Experimental study on the separation of CO2 from flue gas using hollow fiber membrane contactors without wetting, Fuel Process. Technol., 2007, 88(5), 501–511 CrossRef CAS PubMed
 .
. - R. Faiz and M. Al-Marzouqi, Mathematical modeling for the simultaneous absorption of CO2 and H2S using MEA in hollow fiber membrane contactors, J. Membr. Sci., 2009, 342(1–2), 269–278 CrossRef CAS PubMed
 .
. - S. Paul, A. K. Ghoshal and B. Mandal, Theoretical studies on separation of CO2 by single and blended aqueous alkanolamine solvents in flat sheet membrane contactor (FSMC), Chem. Eng. J., 2008, 144(3), 352–360 CrossRef CAS PubMed
 .
. - L. Chunfang, Y. Bo, Z. Guoliang and W. Caishao, Factors influencing CO2 capture by PVDF membrane contactor [J], CIESC J., 2012, 63(2), 500–507 Search PubMed
 .
. - S. Eslami, S. M. Mousavi, S. Danesh and H. Banazadeh, Modeling and simulation of CO2 removal from power plant flue gas by PG solution in a hollow fiber membrane contactor [J], Adv. Eng.
Software, 2011, 42(8), 612–620 CrossRef PubMed
 .
.
|
| This journal is © The Royal Society of Chemistry 2015 |
Click here to see how this site uses Cookies. View our privacy policy here. 


![[V with combining macron]](https://www.rsc.org/images/entities/i_char_0056_0304.gif) tube is the average liquid flow rate, and r1 is fibre inner radius. The boundary conditions are given as:
tube is the average liquid flow rate, and r1 is fibre inner radius. The boundary conditions are given as:


![[V with combining macron]](https://www.rsc.org/images/entities/i_char_0056_0304.gif) shell is the average gas flow rate; r3 is the shell effective radius in the shell side and can be defined as follows:
shell is the average gas flow rate; r3 is the shell effective radius in the shell side and can be defined as follows:


.
.
.
.
.
.
.
.
.
.
.
.
.
.
.
.
.
.
.


