Deep-blue emitting pyrene–benzimidazole conjugates for solution processed organic light-emitting diodes

Durai Karthika, K. R. Justin Thomas*a, Jwo-Huei Joub, Sudhir Kumarb, Yu-Lin Chenb and Yung-Cheng Joub
aOrganic Materials Chemistry, Department of Chemistry, Indian Institute of Technology Roorkee, Roorkee-247 667, India. E-mail: krjt8fcy@iitr.ac.in
bDepartment of Material Science and Engineering, National Tsing Hua University, Hsinchu 30013, Taiwan

Received 23rd September 2014 , Accepted 22nd December 2014

First published on 22nd December 2014


Abstract

New pyrene–benzimidazole conjugates containing different π-linkers such as phenyl, thiophene and triarylamine were synthesized and characterized by photophysical, electrochemical, thermal and electroluminescence studies. Triarylamine-containing dyes displayed red-shifted absorption spectra and positive solvatochromism in emission spectra due to the pronounced intramolecular charge transfer (ICT) from the triarylamine donor to pyrene acceptor in the excited state. All derivatives were used as emitting dopants in multilayered organic light-emitting diodes exhibiting deep blue electroluminescence. The solution processed device fabricated by utilizing 1-phenyl-2-(pyren-1-yl)-1H-benzo[d]imidazole as an emitter displayed promising deep blue emission characteristics with a maximum luminance of 714 cd m−2, external quantum efficiency of 1.5%, CIE coordinates of (0.16, 0.05) at 100 cd m−2 and 100% color saturation.

Introduction

Organic materials applicable in light-emitting diodes (LED)1 have attracted wide attention due to the potential applications realized for LEDs in displays and light sources. Organic LEDs (OLED) are superior to their rival technologies because of their light weight, flexibility, low cost and ease of fabrication.2 Typically, an OLED is fabricated using a multi-layer architecture involving several classes of organic materials such as a hole transporter, electron transporter, emitter and host.3 Depending on the functional capability of the materials used, charge injection and blocking materials are also often used to modulate the charge transport across the molecular layers and confine the exciton generation inside the emitting layer.4 Such a multi-layered device requires cumbersome strategies to maintain layer integrity and thickness. Gustafsson and co-workers first reported flexible OLED fabricated by solution processing method in 1992.5 Among the device fabrication techniques, solution processing method is cheap, easy to apply for large area devices and gives better performance due to uniform distribution of materials, which is beneficial for luminescence at high current density.6 Another important aspect about the OLED is the requirement of primary color (RGB) emission for the design of full color displays. Though, green and red OLED with excellent performance statistics and color purity have been achieved, blue OLEDs still suffer due to poor carrier injection into the emitting layer because of the inherent wide band gap.7 Deep blue color is determined as the EL emission with a Commission International de L'Eclairage (CIE) coordinate of y < 0.08.8 The development of deep blue emitters is essential for OLEDs, because deep blue emission can significantly enhance the gamut area and enable the high color saturation for realizing full-color displays.9 In addition, deep blue emitters can be used to generate light of any required color by energy transfer to emissive dopants.10 Also, they can serve as efficient hosts for green and red triplet emitters.11

Pyrene is a poly aromatic hydrocarbon, which contains an extensive π-conjugation with deep blue emission and high photoluminescence (PL) quantum efficiency. Pyrene-based materials find wide applications in OLEDs,12 organic field-effect transistors (OFET),13 bulk heterojunction solar cells (BHJ),14 gas storage15 and dye sensitized solar cells (DSSC)16 due to their unique photophysical and electrochemical properties. The photophysical and electrochemical properties of pyrene can be fine-tuned by incorporating electron donor or electron acceptor and by multiple substitutions of chromophores at different nuclear positions.17 For instance, the mono-substituted pyrene derivatives display blue emission while the tetra-substituted analogs inherit red emission.18 Though pyrene derivatives possess high emission efficiency in solution, they suffers from solid state PL efficiency due to aggregation caused by long range π–π interactions.19 However, by incorporating sterically demanding imidazole derivatives,20 arylamines21 and 3D scaffolds,22 pyrene derivatives have been restricted to exhibit useful emission characteristics in the solid state as well. Though many deep blue emitters were proven to exhibit EL emission with CIEy < 0.08 in the devices fabricated by thermal evaporation23 and vacuum deposition,24 solution processed OLED remain rare and largely unexplored.25

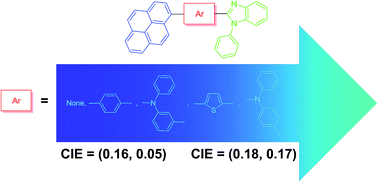
In this paper, we report new pyrene-based deep blue-emitting dopants (3a–3e) (Fig. 1) which can be applied in solution processed multilayered OLED. It is believed that due to electron-withdrawing nature, N-phenylbenzimidazole unit may impart electron-transporting ability to the resulting materials. Incorporation, of benzimidazole has been found to facilitate electron injection and transport in several bipolar derivatives.26 Triarylamine segment present in 3d and 3e may enhance hole-transport character besides reducing aggregation propensity in the solid state due to its trigonal geometry. Herein, we present the detailed account on their photophysical, electrochemical, thermal and electroluminescent properties. Photophysical and electrochemical properties were corroborated by density functional theoretical calculations. Among the dyes (3a–3e), a dye 3a showed better device performance as an emitting dopant (ηext = 1.50%; ηc = 0.5 cd A−1; ηp = 0.2 lm W−1; CIE (0.16, 0.05); brightness: 714 cd m−2). The resulting deep blue emission enables greater than 100% color saturation as compared with National Television System Committee (NTSC) standard (0.14, 0.08) or High-Definition Television (HDTV) ITU-R BT.709 standard (0.15, 0.06).


image file: c4ra11043a-f1.tif
Fig. 1 Structures of the dyes, 3a–3e.

Results and discussion

Synthesis and characterization

The pyrene derivatives end-capped with N-phenylbenzimidazole and linked by various conjugation units such as thiophene, benzene and triarylamine were obtained by a single step protocol shown in Scheme 1. The reaction of the corresponding aldehyde (1a–1e)16,21,27 with the N1-phenylbenzene-1,2-diamine (2) in the presence of sodium metabisulfite produced desired target compounds (3a–3e) in good yields. The molecular compositions of the blue fluorophores were unambiguously established by 1H, 13C NMR and high resolution mass spectroscopy measurements.
image file: c4ra11043a-s1.tif
Scheme 1 Synthetic pathway of the dyes, 3a–3e.

Photophysical properties

The absorption spectra of the dyes (3a–3e) recorded in 10−5 M dichloromethane (DCM) solution is shown in Fig. 2 and the data are compiled in Table 1. All the compounds exhibited at least three major absorption peaks with multiple shoulders. The high energy peaks observed below 300 nm are assigned to pyrene and benzimidazole localized π–π* transitions.28 The longer wavelength intense absorption originates from the delocalized π–π* transition. Interestingly, this peak position is same for 3a and 3b while the thiophene derivative, 3c showed a red-shifted λmaxλ = 27 nm). In the compound containing phenyl linker (3b), probably the conjugation is disrupted due to the twisting of the phenyl bridge while for the thiophene-containing compound (3c) the coplanarity and reduced aromaticity of thiophene extended the conjugation favorably. Also, the molar extinction coefficients for the dye 3b and 3c are larger than for 3a. The hike in the optical density is more for 3c than 3b. This suggests the increase in the chromophoric population associated with this absorption for these dyes. The amine-containing compounds 3d and 3e exhibited an additional moderate absorption peaking at ∼380 nm originating from the charge transfer transition arising from the amine and pyrene chromophores.18a,21,27c The π–π* electronic transition for 3e is red-shifted than that of 3d due to the effective electronic communication between the amine and benzimidazole segments via the para-phenylene linkage in 3e. It is also interesting to compare the absorption parameters of 3d and 3e with N,N-diphenylpyren-1-amine.29 The λmax (379 nm)29 of N,N-diphenylpyren-1-amine is similar to 3d and 3e which suggests that the introduction of benzimidazole unit on the periphery of triarylamine did not alter the λmax. So, benzimidazole decoration on blue-emitting materials can be performed to impart electron-transport capability while retaining the absorption characteristics.
image file: c4ra11043a-f2.tif
Fig. 2 Absorption spectra of the dyes (3a–3e) recorded in DCM.
Table 1 Optical data for the dyes
Dye λmax, nm (εmax, M−1 cm−1 × 10³) λem, nm (ΦF, %) Stokes' shift (cm−1) FWHM (nm) μg, Debye μe, Debye
DCM Tol DCM Tol Filmc,d DCM Tol DCM Tol Filmc
a 2-Aminopyridine (ΦF = 60% in 0.1 N H2SO4) as reference.b Coumarin-1 (ΦF = 99% in ethyl acetate) as reference.c Emission maxima obtained for drop-cast solid film.d Absolute quantum yield measured in solid state using integrating sphere.e Could not be calculated as there is no significant variation of emission energy with solvent polarity.
3a 269 (38.6), 279 (55.1), 346 (54.1) 287, 351 407, 425 (73)a 409, 427 (67)a 469 (16) 4332 4286 59 54 88 3.54 e
3b 269 (40.3), 280 (60.7), 299 (43.3), 347 (65.2) 285, 302, 313, 349 428 (53)a 419 (45)a 470 (13) 5454 4787 64 57 73 3.60 7.52
3c 269 (37.7), 278 (44.1), 329 (43.3), 373 (64.9) 283, 330, 375 457 (59)b 456 (56)b 494 (6) 5000 4880 65 63 72 4.39 e
3d 265 (57.7), 275 (60.7), 304 (69.3), 380 (23.4) 285, 306, 381, 402 461 (60)b 444 (84)b 469 (9) 4624 3655 55 46 50 3.62 10.84
3e 265 (53.0), 275 (60.1), 330 (72.2), 380 (35.7) 283, 332, 382, 400 469 (68)b 449 (95)b 482 (11) 4994 3906 57 47 52 3.66 12.00


The emission spectra of the dyes recorded in DCM solution are displayed in Fig. 3 and the pertinent data listed in Table 1. The emission maxima of these dyes followed the same trend realized for the absorption spectra. The emission maximum showed a progressive red-shift on increasing the conjugation or introduction of amine unit. Thus the dyes 3a and 3b showed deep blue emission while the dyes 3c–3e displayed cyan emission. The dyes 3a and 3c exhibited vibrational fine structure in the emission profile indicative of a relatively rigid molecular structure while the remaining dyes 3b, 3d and 3e showed broad structureless emission suggestive of structural reorganization in the excited state.30 The parent dye N,N-diphenylpyren-1-amine showed emission peak (464 nm)29 very close to that observed for 3d and 3e (461 and 469 nm, respectively). This further indicates that decorating this chromophore with benzimidazole did not drastically affect the excited state of the molecules.


image file: c4ra11043a-f3.tif
Fig. 3 Emission spectra of the dyes (3a–3e) recorded in DCM.

In order to ascertain the impact of solvent polarity on the photophysical properties of the dyes, we have measured the absorption and emission spectra for the dyes in different solvents. Representative solvent induced spectral variations observed for the dye 3e is displayed in Fig. 4. The absorption spectra of the dyes are largely insensitive to the solvent polarity. Minor changes observed for the dyes 3d and 3e are constrained to the amine to pyrene CT electronic transition. Moreover this showed a negative solvatochromism, i.e. red-shifted absorption in toluene and shorter wavelength absorption for acetonitrile solution (Fig. 4a). This clearly establishes that the ground state of these dyes is less polar and receives no significant stabilization from the polar solvents. In the emission spectra, the dyes 3a and 3c did not show noticeable changes. However, the amine-containing dyes 3d and 3e displayed positive solvatochromism in the emission spectra (Fig. 4b). This indicates that the excited states for these dyes are more polar than their corresponding ground states. The full-width at half maximum (FWHM) measured for the dyes 3a–3e are listed in Table 1. All dyes showed small FWHM in toluene compared to other solvents. The dyes 3a and 3c showed negligible change in FWHM value regardless of the polarity of the solvents which further confirms the absence of solvatochromism in the excited state for these compounds. However, a significant increase in FWHM on increasing solvent polarity is noticed for the dyes 3b, 3d and 3e. The degree of increase of FWHM is in the order 3b < 3d < 3e which is reflective of the electronic structural reorganization in the excited state. The excited state dipole moments calculated (for details see Table S1, ESI) for 3d and 3e from the slope of the plot of emission energies versus the solvent polarity parameter (Δf)31 are larger than those found in ground state (Table 1). This supports the assumption of relatively large degree of charge separation for the amine-containing molecules (3d and 3e) in the excited state.32,33


image file: c4ra11043a-f4.tif
Fig. 4 Absorption (a) and emission (b) spectra recorded for 3e in different solvents. (c) Correlation between the Stokes shift and solvent parameter, ET(30) for the dyes 3a–3e.

The Stokes shifts for the dyes 3a–3e in different solvents were calculated to know the structural reorganization occurring during electronic excitation. Stokes shift values in a particular solvent for the dyes follow the order 3a < 3d < 3c < 3e < 3b. Large Stokes shift observed for 3b indicates appreciable structural reorganization due to photo-excitation from ground state to excited state. Also, 3b exhibited slight solvatochromism in the excited state (Fig. 4c). The Stokes shifts observed for the dyes showed a reasonable correlation with the ET(30) parameter (Fig. 4c) indicating a general dye–solvent interaction.

This can be explained by comparing the slope of the correlation plots which provides the information about the magnitude of interaction between the dyes and the solvent. The slopes are in the order 3a (10.08) < 3c (23.97) < 3b (71.61) < 3d (133.10) < 3e (158.87) and indicative of more pronounced intramolecular charge transfer (ICT) from the donor to acceptor in 3e. The dyes (3d and 3e) behaved unusually in methanol and produced unexpected blue-shift in the emission profile than the acetonitrile solution. This led to a deviation in the correlation graph (Fig. 4c). This could be due to the hydrogen bonding interaction between the compound and the solvent or aggregation caused by ‘oil in water’ effect.34

The emission spectra of the drop-cast thin films of the dyes are shown in Fig. 5. All dyes showed featureless and broad emission in the solid state. Particularly, PL spectra of the dyes 3a–3c in the solid state are significantly red-shifted (Δλ > 35 nm) to that observed in the solution. This indicates that the dyes are involved in strong intramolecular π–π* interactions in the solid state leading to J-aggregates.35 The resistance of 3d and 3e for aggregation may be arising due to the trigonal amine moiety.


image file: c4ra11043a-f5.tif
Fig. 5 Photoluminescence spectra of the dyes, 3a–3e recorded as drop-cast thin film.

The photoluminescence quantum yields (ΦF) for dye solutions were determined by using 2-aminopyridine (ΦF = 60% in 0.1 N H2SO4)36 or coumarin-1 (ΦF = 99% in ethyl acetate)37 as standard while for the solid films were by using integrating sphere. Triarylamine-based dyes (3d and 3e) showed high ΦF in this series when measured in nonpolar solvent such as toluene (Table 1). However, they experienced significant reduction in ΦF in polar solvents such as DCM. Interestingly, the triarylamine free dyes (3a–3c) showed an increment in ΦF in DCM. This clearly establishes that the main energy decay channel in the compounds 3d and 3e is dipolar relaxation38,39 which is pronounced in polar solvents for the dyes. The ΦF measured for the dyes in solid state is apparently small when compared to the solution quantum yield.

Thermal properties

Thermal properties of the dyes (3a–3e) were characterized by thermogravimetric analysis (TGA) under nitrogen atmosphere at the heating rate of 10 °C min−1. The thermal parameters are summarized in Table 2. All dyes showed high thermal decomposition temperature (Td ≥ 470 °C) with the onset temperature greater than 376 °C. The high thermal stability of these dyes can be attributed to the rigid pyrene segment. Pronounced thermal stability for pyrene-based molecular materials has been adequately documented in the literature.40 Among the new compounds the amine-containing dyes 3d and 3e exhibited high decomposition temperature in analogy with the triarylamine derivatives known in the literature.18a
Table 2 Thermal and electrochemical data for the dyes
Dye Tonseta, °C Td, °C Tm, °C EoxEp)b, V HOMOc,d, eV LUMOd,e, eV E0–0f, eV
a Temperature corresponding to 10% weight loss.b Measured for 2 × 10⁻⁴ M DCM solution and the potentials are quoted with reference to ferrocene as internal standard.c HOMO = 4.8 + Eox.d Values in parenthesis are obtained from DFT computation (B3LYP).e LUMO = HOMO − E0–0.f Optical band gap (E0–0) obtained from the intersection of normalized absorption and emission spectra (optical edge).g Eox obtained from DPV.
3a 376 470 262 0.90 5.70 (5.25) 2.47 (1.72) 3.23
3b 416 517 158 0.87g 5.67 (5.24) 2.47 (1.66) 3.20
3c 431 530 211 0.79 5.59 (5.12) 2.69 (1.81) 2.90
3d 392 532 131 0.50 (81) 5.30 (4.91) 2.40 (1.60) 2.90
3e 430 524 232 0.47 (99) 5.27 (4.90) 2.40 (1.64) 2.87


Electrochemical properties

The electrochemical properties of the dyes 3a–3e were measured by using cyclic voltammetry (CV) (Fig. 6) and differential pulse voltammetry (DPV) techniques. The triarylamine based dyes 3d and 3e showed a quasi-reversible oxidation couple attributable to the removable of electron from the triarylamine unit. The triarylamine free dyes, 3a–3c displayed an irreversible oxidation wave attributable to the removable of electron from the conjugated system. The redox potentials calculated by calibrating with the internal ferrocene standard are listed in Table 2. The oxidation potentials of the dyes are reflective of the electron richness of the molecules. The triarylamine derivatives (3d and 3e) exhibited relatively low oxidation potential (0.47–0.50 V) than the remaining triarylamine-free derivatives (3a–3c) (0.79–0.90 V), attributable to the electron richness of the triarylamine unit. Among the triarylamine-free dyes, 3c displayed low oxidation potential contributed by the electron richness of thiophene. The HOMO and LUMO energy levels of dyes were estimated from the electrochemical redox potentials and optical band gap to ascertain the feasibility of recombination of hole and electron in the emissive layer and the capture of excitons by the dopants. Low operating voltage results in an OLED when the HOMO and LUMO levels of the host molecule are suitably aligned with respect to the adjoining hole transport layer (HTL) and electron transport layer (ETL). Ideally, the host molecule should have high HOMO and low LUMO with respect to HTL and ETL. But, in reality there will be always barrier for the hole and electron injections from the HTL and ETL, respectively into the host material. The energy level diagram for the new materials along with the HTL, ETL and electrode materials used in the present study is shown in Fig. 7. The host CBP exhibits decent alignment of energy levels with those of PEDOT and TPBI. Among the dyes, 3c possesses favorable LUMO with less electron injection barrier and dyes 3d and 3e inherit high lying HOMO with relatively low hole injection barriers. Considering the fact that holes move faster than electrons in an organic semiconductor, 3c is expected to show low driving voltage if used as a neat emitting layer.
image file: c4ra11043a-f6.tif
Fig. 6 Cyclic voltammograms recorded for the dyes 3a, 3c–3e.
Table 3 Computed vertical excitation parameters, ionization potentials, electron affinities and reorganization energies of the dyes
Dye λmax, nm NTO eigenvaluea Iapb, eV Ivpb, eV Eaab, eV Evab, eV λ+b, eV λb, eV
B3LYP/6-31G(d,p) BMK/DGDZVP DCM (exp) B3LYP/6-31G(d,p) BMK/DGDZVP
a Largest natural transition orbital eigenvalue for the first excited state.b Obtained from B3LYP/6-31G(d,p) method.
3a 373 353 346 0.99 0.98 6.40 6.54 0.60 0.41 0.27 0.37
3b 373 349 347 0.98 0.97 6.29 6.42 0.68 0.48 0.26 0.37
3c 411 382 373 0.99 0.98 6.12 6.26 0.84 0.64 0.26 0.39
3d 435 377 380 0.99 0.98 5.93 6.06 0.46 0.34 0.25 0.23
3e 439 383 380 0.99 0.98 5.86 5.97 0.55 0.44 0.20 0.21


image file: c4ra11043a-f7.tif
Fig. 7 Energy-level diagram of the materials used for the fabrication of OLED.

Electronic structure from DFT computations

To gain further information about the electronic structure of the dyes, we have performed density functional theoretical calculations. The geometry of the molecules were optimized using hybrid B3LYP41 functional and using 6-31G(d,p) basis set. The optimized structures were used for the electronic parameters estimation in BMK/DGDZVP level with the SMD42 solvent model for dichloromethane solvent.

The computed parameters are listed in Table 3. The electronic distributions observed in the frontier molecular orbitals of the selected molecules are shown in Fig. S11 and S12, ESI. Invariably for all the dyes the LUMO orbital was contributed mainly by the pyrene unit. This clearly indicates that pyrene is the relatively better electron-withdrawing unit when compared to benzimidazole. The HOMO of the dyes had compositions reflecting the electron richness of the moieties present in the molecule. For majority of the dyes (3a–3c and 3e), it was spread over the entire molecule excluding the N-phenyl substituent on the benzimidazole. For 3d, it is restricted to triarylamine segment due to the meta-linkage between the triarylamine and benzimidazole units. Since the longer wavelength absorption is predicted to possess major contribution from the HOMO to LUMO electronic excitation, the prominent absorption band realized for the dyes 3a–3c can be assigned to the π–π* electronic transition while for 3d and 3e it is mainly a charge transfer from diarylamine donor to pyrene acceptor. These assignments were also confirmed by natural transition orbital analysis (Fig. 8). Though the trend in the lower energy electronic excitation values predicted by theoretical calculation using B3LYP/6-31G(d,p) method (3a3b < 3c < 3d3e) is consistent with the experimentally observed lower energy absorption the absorption maxima showed deviations from the calculated values (Table 3). So we have used BMK/DGDZVP level for the estimation of the vertical excitations as this model has been found to accurately predict the absorption characteristics for Pechmann dyes.43 The calculated vertical excitation wavelengths for the dyes are closely matching with the observed peak positions in dichloromethane.


image file: c4ra11043a-f8.tif
Fig. 8 Natural transition orbital distributions of the selected compounds, 3b, 3d and 3e.

According to Marcus–Hush equation44 hole/electron transfer rate is inversely proposal to the internal reorganization energy (λ). Smaller λ means higher charge mobility. In order to understand the charge transport capability of the dyes, we have calculated the reorganization energies for the electrons (λ) and holes (λ+) at the B3LYP/6-31G(d,p) level (Table 3) from the hole and electron relaxation energies. Among the dyes, 3d and 3e may exhibit balanced charge transport as the reorganization energies for their hole and electron are comparable. But, for the dyes 3a–3c the electron transport involves significant reorganization. This difference can be rationalized by looking at the LUMO of the dyes. In the dyes 3d and 3e the LUMO is confined to the moderate electron-deficient pyrene unit, while in the dyes 3a–3c it is delocalized into the relatively electron-rich thiophene or benzimidazole units. Thus, the dyes, 3a–3c are expected to possess low affinity to transport electrons than the dyes 3d and 3e. Relatively low λ+ value for 3e is indicative of good hole transporting capability.

Table 4 Electroluminescence data for the dyes
Dye Concentration (wt%) Vta (V) ηpb,c (lm W−1) ηcb,d (cd A−1) ηextb,e (%) CIEb (x, y) λEL (nm) Max luminance (cd m−2) FWHM (nm)
a Turn-on voltage corresponding to luminance 10 cd m−2.b 100 cd m−2.c Power efficiency.d Current efficiency.e External quantum efficiency.f @40 cd m−2.
3a Neat 6.6 0.04f 0.1f 0.1f (0.2, 0.24)f 468 92 117
5 5.8 0.2 0.5 1.5 (0.16, 0.05) 416 714 58
3b Neat 7.6 0.04f 0.1f 0.1f (0.17, 0.24)f 468 86 106
5 6.9 0.1 0.2 0.4 (0.16, 0.08) 420 318 68
3c Neat 5.6 0.1 0.3 0.1 (0.26, 0.48) 512 324 99
5 6.2 0.1 0.3 0.3 (0.17, 0.15) 468 1176 86
3d Neat 4.9 0.2 0.4 0.3 (0.16, 0.17) 460 492 58
5 5.4 0.2 0.4 0.5 (0.16, 0.10) 444 549 54
3e Neat 6.9 0.4 1.1 0.5 (0.22, 0.35) 476 586 82
5 6.1 0.3 0.7 0.5 (0.18, 0.17) 452 627 61


Electroluminescence characteristics

Electroluminescence properties of the dyes (3a–3e) were evaluated in solution processed multilayered OLED device (ITO/PEDOT:PSS/CBP + 3a–3e (5 wt%)/TPBI/LiF/Al) by doping them as guest (5 wt%) in 4,4′-bis(9H-carbazol-9-yl)biphenyl (CBP) host. We have also fabricated the devices by employing the non-doped dyes as emitting layer, which exhibited relatively lower performance than that of doped emitting layer based devices. The current density–voltage (JV) and luminescence–voltage (LV) curves of the devices fabricated for the dyes are shown in Fig. 9 and the data listed in Table 4.
image file: c4ra11043a-f9.tif
Fig. 9 JVL plots for devices with the dyes (3a–3e) as (a) emitter and (b) emitting dopant (5%).

In both the devices, the dye 3d exhibited good current density demonstrating good charge transport capability. On moving from neat devices to doped devices the current density decreased for 3d but increased for other dyes 3a, 3b and 3e. But for 3c the current density remained same in both the devices. It appears that 3c possesses balanced charge transport for holes and electrons. This may arise from the relatively low barrier for hole and electron injection from the HTL and ETL, respectively into the molecular layer of 3c. However, 3c showed difference in performance in both devices. All the dyes showed poor luminance when used as neat film and the luminance increased significantly when used as dopant (Table 4). But, for the amine derivatives (3d & 3e) comparable luminance was observed for both neat and dopant devices. This shows that the introduction of triphenylamine unit is beneficial for charge transport. Secondly, the EL maxima (Fig. 10) observed for the neat and dopant devices are also interesting. For the amine dyes (3d & 3e), neat devices showed moderate red-shift (<16 nm) while the other dyes exhibited significant red shift (>44 nm). This clearly points the role of triphenylamine in reducing the aggregation. Red-shifted EL emission with low luminance for 3a–3c is probably due to the result of excimer formation.45 Deep blue emission was observed for the EL devices fabricated using 3a and 3b guest molecules in CBP host, 3d and 3e exhibited blue emission and 3c showed cyan color (Fig. 10) in agreement with the PL spectra measured in DCM. The extensive blue-shift realized when 3a–3e is doped (5 wt%) in the CPB host can be rationalized as the solid state solvation effect which helps to disperse the emitter in the host and prevents emitter aggregation.46 The color saturation of the pyrene–benzimidazole conjugates in doped devices follows the order of 3a (102%) > 3b (98%) > 3d (95%) > 3c (86%) > 3e (82%) as compared with the deep-blue emission defined by NTSC, and 3a (100%) > 3b (96%) > 3d (93%) > 3c (85%) > 3e (81%) as compared with the deep-blue emission defined by the HDTV (ITU-R BT.709). The high color saturation attributed to low FWHM (58 nm) of EL of the doped device 3a.


image file: c4ra11043a-f10.tif
Fig. 10 EL spectra of the devices with the dyes 3a–3e as dopants (5%).

Relatively low driving voltage was observed for the dyes 3c and 3d when they were employed as neat emitter. Though, 3d and 3e have similar LUMO energy levels the HOMO is showing small difference. Wu and co-workers47 showed that the turn-on voltage is mainly dependent on the HOMO and LUMO energies of the constituent layers. However, while using the HOMO and LUMO values to rationalize the differences in electroluminescence performances care must be exercised. As, there might be charge exchanges and dipole layers formed at the interfaces of organic layers.48 The existence of charge transfer-induced dipoles at the interfaces leads to the shift in the molecular levels of one organic with respect to the other. So, the difference in turn-on voltage observed for 3d and 3e may be due to the differences arising from the band offsets. Among the devices, the maximum luminance was achieved for the doped device employing 3c as an emitter while high external quantum efficiency recorded for 3a (ηext = 1.50%).

Conclusions

In summary, we have developed deep blue emitting dopants (3a–3e), which contains pyrene and benzimidazole segments either connected directly or with different π-linkers. Incorporation of arylamine unit (3d and 3e) led to red-shifted absorption spectra originating from the ICT between arylamine donor and pyrene acceptor. Dyes 3a and 3b showed deep blue photoluminescence emission, whereas, incorporation of thiophene and arylamine (3c–3e) unit red-shifted the emission profile to cyan region. Electrochemical studies revealed low oxidation potential for the arylamine derivatives (3d and 3e) which shrunk the band gap. All dyes showed high thermal decomposition temperature (≥470 °C) attributable to the presence of rigid pyrene unit. Dye 3a showed deep blue EL emission with better device performance of ηext = 1.50%, ηc = 0.5 cd A−1, ηp = 0.2 lm W−1, brightness = 714 cd m−2 and CIE (0.16, 0.05) at 100 cd m−2 using solution processed method. The resulting deep blue emission is very close to the CIE of the HDTV, and colour saturation is over 100%. A cyan-emitting device comprising 3c exhibited maximum luminance 1176 cd m−2. Pyrene–benzimidazole conjugates are promising candidates for deep blue emitting solution processed OLED applications.

Experimental section

Materials and methods

All the reagents were purchased from commercial sources and used as such without further purification. The solvents used in the reactions and spectroscopic measurements were dried prior to use by standard procedures. Column chromatography purification was performed by using neutral aluminum oxide (100–125 mesh) as a stationary phase. 1H and 13C NMR were recorded on a Bruker NMR spectrometer operating at 500.13 and 125.77 MHz, respectively. Deuterated chloroform (CDCl3) was used as solvent and the chemical shifts were calibrated using the residual peak at δ 7.26 ppm for 1H and 77.0 ppm for 13C, respectively. UV-Vis spectra were recorded at room temperature in quartz cuvettes using either Shimadzu spectrophotometer UV-1800 or Cary UV-100 spectrophotometer. The fluorescence spectra were measured on a Shimadzu spectrofluorimeter for the air equilibrated solutions. Drop-cast thin films on quartz plates were prepared from toluene solution and used for the measurement of solid state photoluminescence. Absolute solid state fluorescent quantum yield (±3% accuracy) was measured by integrating sphere method using Edinburgh FLS980 fluorescence spectrometer. The TGA analyses were performed on a PerkinElmer Pyris Diamond Analyzer using nitrogen as carrier gas and at a heat rate of 10 °C min−1. Cyclic voltammetry (CV) and differential pulse voltammetry (DPV) measurements were performed using BASi Epsilon electrochemical analyzer with a conventional three electrode assembly comprising glassy carbon working electrode, a non-aqueous Ag/AgNO3 reference electrode and platinum wire counter electrode. The electrochemical measurements were conducted for the dichloromethane (DCM) solutions while tetrabutylammonium perchlorate (0.1 M) served as supporting electrolyte. Ferrocene was used as potential marker to calibrate the redox potentials of the compounds. The high resolution mass spectra were obtained from a HRMS ESI mass spectrometer (Bruker Daltonics) operating at the positive ion mode.

Synthesis

1-Phenyl-2-(pyren-1-yl)-1H-benzo[d]imidazole (3a). A flask was charged with pyrene-1-carbaldehyde (0.44 g, 1.91 mmol), 2-aminodiphenyl amine (0.37 g, 2.01 mmol), sodium metabisulfite (0.73 g, 3.82 mmol) and 10 mL DMF. The resulting mixture was heated at 95 °C for 5 h. Then it was cooled to room temperature and poured into ice-cold water to obtain a solid. The solid was filtered and dried. Finally, it was purified by column chromatography using chloroform/hexanes mixture (4/1) as eluant. Tan solid, yield (0.67 g, 89%); mp 262 °C, 1H NMR (CDCl3, 500.13 MHz): δ 7.23–7.25 (m, 5H), 7.37–7.40 (m, 1H), 7.43–7.48 (m, 2H), 7.88–7.90 (m, 1H), 8.02–8.09 (m, 5H), 8.12–8.14 (m, 1H), 8.20–8.23 (m, 2H), 8.43–8.45 (m, 1H); 13C NMR (CDCl3, 125.77 MHz): δ 110.6, 120.2, 123.1, 123.5, 124.0, 124.4, 124.6, 124.7, 125.0, 125.6, 125.7, 126.2, 126.7, 127.2, 127.9, 128.5, 128.6, 129.4, 130.5, 130.8, 131.1, 132.0, 136.3, 136.5, 143.4, 152.3 ppm; HRMS calcd for C29H18N2 [M + H]+ m/z 395.1504, found 395.1531.
1-Phenyl-2-(4-(pyren-1-yl)phenyl)-1H-benzo[d]imidazole (3b). It was prepared by following the procedure described above for 3a, using 4-(pyren-1-yl)benzaldehyde (0.50 g, 1.63 mmol), 2-aminodiphenyl amine (0.33 g, 1.79 mmol) and sodium metabisulfite (0.62 g, 3.26 mmol). Tan solid, yield (0.57 g, 75%); mp 158 °C, 1H NMR (CDCl3, 500.13 MHz): δ 7.30–7.32 (m, 2H), 7.37–7.9 (m, 1H), 7.45–7.47 (m, 2H), 7.53–7.55 (m, 2H), 7.58–7.61 (m, 4H), 7.78–7.80 (m, 2H), 7.94–7.97 (m, 2H), 8.01–8.04 (m, 2H), 8.08–8.12 (m, 2H), 8.16–8.18 (m, 2H), 8.20–8.22 (m, 2H); 13C NMR (CDCl3, 125.77 MHz): δ 99.99, 105.4, 119.9, 123.1, 123.5, 124.7, 124.9, 125.0, 125.3, 126.1, 127.4, 127.5, 127.6, 127.7, 128.4, 128.8, 128.9, 129.4, 130.03, 130.6, 130.8, 131.0, 131.5, 136.7, 137.1, 137.5, 142.4, 143.2, 152.2 ppm. HRMS calcd for C35H22N2 [M + H]+ m/z 471.1817, found 471.1844.
1-Phenyl-2-(5-(pyren-1-yl)thiophen-2-yl)-1H-benzo[d]imidazole (3c). It was synthesized by following a procedure similar to that described above for 3a, using 5-(pyren-1-yl)thiophene-2-carbaldehyde (0.31 g, 1.00 mmol), 2-aminodiphenyl amine (0.20 g, 1.10 mmol) and sodium metabisulfite (0.38 g, 2.00 mmol). Yellow solid, yield (0.26 g, 56%); mp 211 °C, 1H NMR (CDCl3, 500.13 MHz): δ 6.96 (d, J = 4.0 Hz, 1H), 7.12 (d, J = 8.0 Hz, 1H), 7.18 (d, J = 3.5 Hz, 1H), 7.26–7.28 (m, 1H), 7.33–7.36 (m, 1H), 7.54–7.56 (m, 2H), 7.63–7.69 (m, 3H), 7.90 (d, J = 8.0 Hz, 1H), 8.01–8.11 (m, 5H), 8.17–8.22 (m, 3H), 8.51–8.53 (m, 1H); 13C NMR (CDCl3, 125.77 MHz): δ 110.2, 119.6, 123.2, 123.4, 124.7, 125.0, 125.2, 125.5, 126.2, 127.3, 128.0, 128.2, 128.4, 128.5, 128.6, 128.8, 128.9, 129.8, 130.3, 130.9, 131.3, 131.4, 133.2, 136.5, 137.9, 143.0, 145.7, 147.3 ppm. HRMS calcd for C33H20N2S [M + H]+ m/z 477.1381, found 477.1402.
N-Phenyl-N-(3-(1-phenyl-1H-benzo[d]imidazol-2-yl)phenyl)pyren-1-amine (3d). It was obtained by following a procedure similar to that described above for 3a, using 3-(phenyl(pyren-1-yl)amino)benzaldehyde (0.80 g, 2.00 mmol), 2-aminodiphenyl amine (0.41 g, 2.20 mmol) and sodium metabisulfite (0.76 g, 4.00 mmol). Greenish yellow solid, yield (0.80 g, 72%); mp 131 °C, 1H NMR (CDCl3, 500.13 MHz): δ 6.59 (dt, J = 7.0 Hz, 1.0 Hz, 1H), 6.86–6.93 (m, 6H), 6.95–6.97 (m, 2H), 7.04 (d, J = 8.0 Hz, 1H), 7.11–7.18 (m, 4H), 7.24–7.27 (m, 5H), 7.45–7.46 (m, 1H), 7.66 (d, J = 8.0 Hz, 1H), 7.81 (d, J = 8.0 Hz, 1H), 7.89–7.91 (m, 1H), 7.97–8.04 (m, 2H), 8.07–8.12 (m, 3H), 8.14–8.15 (m, 1H), 8.22 (d, J = 8.0 Hz, 1H); 13C NMR (CDCl3, 125.77 MHz): δ 110.3, 119.7, 121.9, 122.0, 122.7, 122.8, 122.9, 123.0, 123.1, 123.2, 124.9, 125.1, 125.3, 126.0, 126.4, 126.7, 127.2, 127.7, 127.8, 127.9, 128.2, 129.1, 129.2, 129.5, 129.7, 131.1, 136.3, 137.1, 140.1, 148.2, 148.3, 152.2 ppm. HRMS calcd for C41H27N3 [M + H]+ m/z 562.2239, found 562.2251.
N-Phenyl-N-(4-(1-phenyl-1H-benzo[d]imidazol-2-yl)phenyl)pyren-1-amine (3e). It was synthesized by following a procedure similar to that described above for 3a, using 4-(phenyl(pyren-1-yl)amino)benzaldehyde (0.59 g, 1.48 mmol), 2-aminodiphenyl amine (0.30 g, 1.63 mmol) and Na2S2O5 (0.56 g, 2.96 mmol). Tan solid, yield (0.42 g, 32%); mp 232 °C, 1H NMR (CDCl3, 500.13 MHz): δ 6.87–6.89 (m, 2H), 6.99–7.03 (m, 1H), 7.15–7.25 (m, 6H), 7.29–7.34 (m, 3H), 7.38–7.42 (m, 3H), 7.46–7.49 (m, 2H), 7.81–7.84 (m, 2H), 7.92–7.94 (m, 1H), 7.98–8.01 (m, 1H), 8.05–8.08 (m, 3H), 8.16 (dd, J = 12.0 Hz, 4.0 Hz, 3H); 13C NMR (CDCl3, 125.77 MHz): δ 110.2, 119.4, 119.7, 121.9, 122.8, 122.9, 123.0, 123.5, 124.7, 125.2, 125.3, 126.0, 126.3, 127.1, 127.3, 127.5, 127.6, 128.1, 128.2, 128.5, 129.3, 129.8, 130.3, 130.9, 131.1, 137.2, 137.3, 139.9, 143.0, 147.5, 149.7, 152.4 ppm. HRMS calcd for C41H27N3 [M + H]+ m/z 562.2239, found 562.2277.

DFT computations

All computations were performed with the Gaussian 09 program package.49 The ground-state geometries were fully optimized without any symmetry constrains at the DFT level with Becke's three parameters hybrid functional and Lee, Yang and Parr's correlational functional B3LYP41 using the 6-31G* basis set on all atoms in both vacuum and solvation model SMD42 for DCM solvent. Vibrational analyses on the optimized structures were performed to confirm the structure. The excitation energies and oscillator strengths for the lowest 10 singlet–singlet transitions at the optimized geometry in the ground state were obtained by TD-DFT calculations using both the B3LYP functional, 6-31G(d,p) basis set and BMK functional, DGDZVP50 basis set.

OLED fabrication and characterization

The OLED devices were fabricated on a pre-cleaned glass substrate containing a 125 nm layer indium tin oxide as anode, 35 nm poly(3,4-ethylene-dioxythiophene)–poly(styrenesulfonate) (PEDOT:PSS) as hole-injection layer (HIL), emissive layer (EML), 32 nm 1,3,5-tris(N-phenylbenzimidazol-2-yl)benzene (TPBI) as electron transporting layer (ETL), a 0.7 nm LiF electron injection layer (EIL), and a 150 nm Al layer as cathode. The aqueous solution of PEDOT:PSS was spin coated at 4000 rpm for 20 s to form a 40 nm HIL layer. The dyes 3a–3e, either neat or doped into 4,4′-bis(9H-carbazol-9-yl)biphenyl (CBP) were deposited by spin-coating at 2500 rpm for 20 s and served as emissive layer. Subsequently, lithium fluoride and aluminum cathode were thermally evaporated at 1.0 × 10⁻⁵ Torr.

Acknowledgements

Financial support from CSIR, New Delhi to KRJT is gratefully acknowledged and DST for HRMS facility via FIST Program to the Chemistry Department. DK thanks UGC, New Delhi for a research fellowship.

Notes and references

  1. C. W. Tang and S. A. VanSlyke, Appl. Phys. Lett., 1987, 51, 913 CrossRef CAS.
  2. (a) Y.-F. Liu, J. Feng, Y.-F. Zhang, H.-F. Cui, D. Yin, Y.-G. Bi, J.-F. Song, Q.-D. Chen and H.-B. Sun, Org. Electron., 2014, 15, 478 CrossRef CAS; (b) J.-D. You, S.-R. Tseng, H.-F. Meng, F.-W. Yen, I. F. Lin and S.-F. Horng, Org. Electron., 2009, 10, 1610 CrossRef CAS; (c) J.-H. Jou, M.-C. Sun, H.-H. Chou and C.-H. Li, Appl. Phys. Lett., 2005, 87, 043508 CrossRef.
  3. (a) T. Tsutsui, C. Adachi and S. Saito, Synth. Met., 1991, 41, 1193 CrossRef CAS; (b) D. Zhang, L. Duan, C. Li, Y. Li, H. Li, D. Zhang and Y. Qiu, Adv. Mater., 2014, 26, 5050 CrossRef CAS PubMed; (c) L. Xiao, Z. Chen, B. Qu, J. Luo, S. Kong, Q. Gong and J. Kido, Adv. Mater., 2011, 23, 926 CrossRef CAS PubMed; (d) K.-S. Yook and J.-Y. Lee, Adv. Mater., 2012, 24, 3169 CrossRef CAS PubMed.
  4. (a) B. D. Chin and C. Lee, Adv. Mater., 2007, 19, 2061 CrossRef CAS; (b) C.-H. Gao, D.-Y. Zhou, W. Gu, X.-B. Shi, Z.-K. Wang and L.-S. Liao, Org. Electron., 2013, 14, 1177 CrossRef CAS; (c) S.-J. Su, Y. Takahashi, T. Chiba, T. Takeda and J. Kido, Adv. Funct. Mater., 2009, 19, 1260 CrossRef CAS; (d) H. F. Chen, S. J. Yang, Z. H. Tsai, W. Y. Huang, T. C. Wang and K. T. Wong, J. Mater. Chem., 2009, 19, 8112 RSC.
  5. G. Gustafsson, Y. Cao, G. M. Treacy, F. Klavetter, N. Colaneri and A. J. Heeger, Nature, 1992, 357, 477 CrossRef CAS.
  6. Z. Wang, Y. Lou, S. Naka and H. Okada, ACS Appl. Mater. Interfaces, 2011, 3, 2496 CAS.
  7. A. W. Grice, D. D. C. Bradley, M. T. Bernius, M. Inbasekaran, W. W. Wu and E. P. Woo, Appl. Phys. Lett., 1998, 73, 629 CrossRef CAS.
  8. Y. Yu, Z. Wu, Z. Li, B. Jiao, L. Li, L. Ma, D. Wang, G. Zhou and X. Hou, J. Mater. Chem. C, 2013, 1, 8117 RSC.
  9. M.-T. Lee, H.-H. Chen, C.-H. Liao, C.-H. Tsai and C. H. Chen, Appl. Phys. Lett., 2004, 85, 3301 CrossRef CAS.
  10. K. Wang, F. Zhao, C. Wang, S. Chen, D. Chen, H. Zhang, Y. Liu, D. Ma and Y. Wang, Adv. Funct. Mater., 2013, 23, 2672 CrossRef CAS.
  11. X. Wang, S. Wang, Z. Ma, J. Ding, L. Wang, X. Jing and F. Wang, Adv. Funct. Mater., 2014, 24, 3413 CrossRef CAS.
  12. (a) X. Feng, J.-Y. Hu, H. Tomiyasu, N. Seto, C. Redshaw, M. R. J. Elsegood and T. Yamato, Org. Biomol. Chem., 2013, 11, 8366 RSC; (b) N. Prachumrak, S. Namuangruk, T. Keawin, S. Jungsuttingwong, T. Sudyoadsuk and V. Promarak, Eur. J. Org. Chem., 2013, 2013, 3825 CrossRef CAS.
  13. L. Zophel, D. Beckmann, V. Enkelmann, D. Chercka, R. Rieger and K. Müllen, Chem. Commun., 2011, 47, 6960 RSC.
  14. K. Takemoto, M. Karasawa and M. Kimura, ACS Appl. Mater. Interfaces, 2012, 4, 6289 CAS.
  15. M. G. Rabbani, A. K. Sekizkardes, O. M. El-Kadri, B. R. Kaafarani and H. M. El-Kaderi, J. Mater. Chem., 2012, 22, 25409 RSC.
  16. A. Baheti, C.-P. Lee, K. R. J. Thomas and K.-C. Ho, Phys. Chem. Chem. Phys., 2011, 13, 17210 RSC.
  17. (a) S.-I. Kawano, M. Baumgarten, D. Chercka, V. Enkelmann and K. Müllen, Chem. Commun., 2013, 49, 5058 RSC; (b) K. Fujimoto, H. Shimizu, M. Furusyo, S. Akiyama, M. Ishida, U. Furukawa, T. Yokoo and M. Inouye, Tetrahedron, 2009, 65, 9357 CrossRef CAS; (c) S.-W. Yang, A. Elangovan, K.-C. Huang and T.-I. Ho, J. Phys. Chem. B, 2005, 109, 16628 CrossRef CAS PubMed.
  18. (a) K. R. J. Thomas, N. Kapoor, M. N. K. P. Bolisetty, J.-H. Jou, Y.-L. Chen and Y.-C. Jou, J. Org. Chem., 2012, 77, 3921 CrossRef CAS PubMed; (b) Z.-Q. Liang, Z.-Z. Chu, J.-X. Yang, C.-X. Yuan, X.-T. Tao and D.-C. Zou, Synth. Met., 2011, 161, 1691 CrossRef CAS; (c) S. Krotkus, K. Kazlauskas, A. Miasojedovas, A. Gruodis, A. Tomkeviciene, J. V. Grazulevicius and S. Jursenas, J. Phys. Chem. C, 2012, 116, 7561 CrossRef CAS.
  19. S. M. Langenegger and R. Haner, Chem. Commun., 2004, 2792 RSC.
  20. Y. Zhang, T.-W. Ng, F. Lu, Q.-X. Tong, S.-L. Lai, M.-Y. Chan, H.-L. Kwong and C.-S. Lee, Dyes Pigm., 2013, 98, 190 CrossRef CAS.
  21. K. R. J. Thomas, N. Kapoor, C.-P. Lee and K.-C. Ho, Chem.–Asian J., 2012, 7, 738 CrossRef CAS PubMed.
  22. K. L. Chan, J. P. F. Lim, X. Yang, A. Dodabalapur, G. E. Jabbour and A. Sellinger, Chem. Commun., 2012, 48, 5106 RSC.
  23. R. Kim, S. Lee, K.-H. Kim, Y.-J. Lee, S.-K. Kwon, J.-J. Kim and Y.-H. Kim, Chem. Commun., 2013, 49, 4664 RSC.
  24. J. Ye, Z. Chen, M.-K. Fung, C. Zheng, X. Ou, X. Zhang, Y. Yuan and C.-S. Lee, Chem. Mater., 2013, 25, 2630 CrossRef CAS.
  25. (a) Z. Gao, G. Cheng, F. Shen, S. Zhang, Y. Zhang, P. Lu and Y. Ma, Laser Photonics Rev., 2014, 8, L6 CrossRef CAS; (b) D. Kumar, K. R. J. Thomas, C.-C. Lin and J.-H. Jou, Chem.–Asian J., 2013, 8, 2111 CrossRef CAS PubMed.
  26. (a) M. Y. Lai, C. H. Chen, W. S. Huang, J. T. Lin, T. H. Ke, L. Y. Chen, M. H. Tsai and C. C. Wu, Angew. Chem., Int. Ed., 2008, 47, 581 CrossRef CAS PubMed; (b) S. Gong, Y. Zhao, C. Yang, C. Zhong, J. Qin and D. Ma, J. Phys. Chem. C, 2010, 114, 5193 CrossRef CAS; (c) J. Huang, J.-H. Su, X. Li, M.-K. Lam, K.-M. Fung, H.-H. Fan, K.-W. Cheah, C. H. Chen and H. Tian, J. Mater. Chem., 2011, 21, 2957 RSC; (d) S.-H. Chou, W.-Y. Hung, C.-M. Chen, Q.-Y. Liu, Y.-H. Liu and K.-T. Wong, RSC Adv., 2013, 3, 13891 RSC; (e) H. Huang, Y. Wang, B. Pan, X. Yang, L. Wang, J. Chen, D. Ma and C. Yang, Chem.–Eur. J., 2013, 19, 1828 CrossRef CAS PubMed; (f) B. Pan, B. Wang, Y. Wang, P. Xu, L. Wang, J. Chen and D. Ma, J. Mater. Chem. C, 2014, 2, 2466 RSC.
  27. (a) Z. Zeng and L. Spiccia, Chem.–Eur. J., 2009, 15, 12941 CrossRef CAS PubMed; (b) Y. Yang, S. Ji, F. Zhou and J. Zhao, Biosens. Bioelectron., 2009, 24, 3442 CrossRef CAS PubMed; (c) K. R. J. Thomas, A. L. Thompson, A. V. Sivakumar, C. J. Bardeen and S. Thayumanavan, J. Am. Chem. Soc., 2005, 127, 373 CrossRef CAS PubMed.
  28. (a) A. G. Crawford, A. D. Dwyer, Z. Liu, A. Steffen, A. Beeby, L.-O. Pålsson, D. J. Tozer and T. B. Marder, J. Am. Chem. Soc., 2011, 133, 13349 CrossRef CAS PubMed; (b) X. Ouyang, X. Zhang and Z. Ge, Dyes Pigm., 2014, 103, 39 CrossRef CAS.
  29. J.-Y. Hu, X. Feng, N. Seto, J.-H. Do, X. Zeng, Z. Tao and T. Yamato, J. Mol. Struct., 2013, 1035, 19 CrossRef CAS.
  30. H. Detert and V. Schmitt, J. Phys. Org. Chem., 2006, 19, 603 CrossRef CAS.
  31. G. F. Mes, B. de Jong, H. J. van Ramesdonk, J. W. Verhoeven, J. M. Warman, M. P. de Haas and L. E. W. Horsman-van den Dool, J. Am. Chem. Soc., 1984, 106, 6524 CrossRef CAS.
  32. (a) M.-G. Ren, M. Mao and Q.-H. Song, Chem. Commun., 2012, 48, 2970 RSC; (b) W. Li, Y. Pan, L. Yao, H. Liu, S. Zhang, C. Wang, F. Shen, P. Lu, B. Yang and Y. Ma, Adv. Opt. Mater., 2014, 2, 892 CrossRef CAS.
  33. D. J. Stewart, M. J. Dalton, R. N. Swiger, J. L. Fore, M. A. Walker, T. M. Cooper, J. E. Haley and L.-S. Tan, J. Phys. Chem. A, 2014, 118, 5228 CrossRef CAS PubMed.
  34. D. Kumar, K. R. J. Thomas, Y.-L. Chen, Y.-C. Jou and J.-H. Jou, Tetrahedron, 2013, 69, 2594 CrossRef CAS.
  35. B. Zhang, W. Diao, C. Bi, J. Sun, G. Han, Y. Shi, L. Sheng, G. Yin and L. Pu, J. Fluoresc., 2012, 22, 1 CrossRef CAS PubMed.
  36. R. Rusakowicz and A. C. Testa, J. Phys. Chem., 1968, 72, 2680 CrossRef CAS.
  37. G. Jones, W. R. Jackson, C. Y. Choi and W. R. Bergmark, J. Phys. Chem., 1985, 89, 294 CrossRef CAS.
  38. (a) J. M. Hancock, A. P. Gifford, Y. Zhu, Y. Lou and S. A. Jenekhe, Chem. Mater., 2006, 18, 4924 CrossRef CAS; (b) N. Kapoor and K. R. J. Thomas, New J. Chem., 2010, 34, 2739 RSC.
  39. Z.-H. Guo, Z.-X. Jin, J.-Y. Wang and J. Pei, Chem. Commun., 2014, 50, 6088 RSC.
  40. Y. Liu, Z. Gao, Z. Wang, C. Feng, F. Shen, P. Lu and Y. Ma, Eur. J. Org. Chem., 2013, 2013, 7267 CrossRef CAS.
  41. (a) C. Lee, W. Yang and R. G. Parr, Phys. Rev. B: Condens. Matter Mater. Phys., 1988, 37, 785A CrossRef; (b) D. Becke, J. Chem. Phys., 1993, 98, 1372 CrossRef.
  42. A. V. Marenich, C. J. Cramer and D. G. Truhlar, J. Phys. Chem. B, 2009, 113, 6378 CrossRef CAS PubMed.
  43. E. A. B. Kantchev, T. B. Norsten and M. B. Sullivan, Org. Biomol. Chem., 2012, 10, 6682 CAS.
  44. R. A. Marcus, Rev. Mod. Phys., 1993, 65, 599 CrossRef CAS.
  45. P. Anant, N. T. Lucas, J. M. Ball, T. D. Anthopoulos and J. Jacob, Synth. Met., 2010, 160, 1987 CrossRef CAS.
  46. V. Bulovic, R. Deshpande, M. E. Thompson and S. R. Forrest, Chem. Phys. Lett., 1999, 308, 317 CrossRef CAS.
  47. I.-W. Wu, Y.-H. Chen, P.-S. Wang, C.-G. Wang, S.-H. Hsu and C.-I. Wu, Appl. Phys. Lett., 2010, 96, 013301 CrossRef.
  48. A. Rajagopal, C. I. Wu and A. Kahn, J. Appl. Phys., 1998, 83, 2649 CrossRef CAS.
  49. M. J. Frisch, G. W. Trucks, H. B. Schlegel, G. E. Scuseria, M. A. Robb, J. R. Cheeseman, G. Scalmani, V. Barone, B. Mennucci, G. A. Petersson, H. Nakatsuji, M. Caricato, X. Li, H. P. Hratchian, A. F. Izmaylov, J. Bloino, G. Zheng, J. L. Sonnenberg, M. Hada, M. Ehara, K. Toyota, R. Fukuda, J. Hasegawa, M. Ishida, T. Nakajima, Y. Honda, O. Kitao, H. Nakai, T. Vreven, J. A. Montgomery Jr, J. E. Peralta, F. Ogliaro, M. Bearpark, J. J. Heyd, E. Brothers, K. N. Kudin, V. N. Staroverov, R. Kobayashi, J. Normand, K. Raghavachari, A. Rendell, J. C. Burant, S. S. Iyengar, J. Tomasi, M. Cossi, N. Rega, J. M. Millam, M. Klene, J. E. Knox, J. B. Cross, V. Bakken, C. Adamo, J. Jaramillo, R. Gomperts, R. E. Stratmann, O. Yazyev, A. J. Austin, R. Cammi, C. Pomelli, J. W. Ochterski, R. L. Martin, K. Morokuma, V. G. Zakrzewski, G. A. Voth, P. Salvador, J. J. Dannenberg, S. Dapprich, A. D. Daniels, Ö. Farkas, J. B. Foresman, J. V. Ortiz, J. Cioslowski, and D. J. Fox, Gaussian 09, Revision A.02, Gaussian, Inc., Wallingford CT, 2009 Search PubMed.
  50. (a) N. Godbout, D. R. Salahub, J. Andzelm and E. Wimmer, Can. J. Chem., 1992, 70, 560 CrossRef CAS; (b) C. Sosa, J. Andzelm, B. C. Elkin, E. Wimmer, K. D. Dobbs and D. A. Dixon, J. Phys. Chem., 1992, 96, 6630 CrossRef CAS.

Footnote

Electronic supplementary information (ESI) available: Absorption and emission spectra of dyes recorded in different solvents, DPV recorded in DCM, 1H and 13C NMR spectra of dyes. See DOI: 10.1039/c4ra11043a

This journal is © The Royal Society of Chemistry 2015
Click here to see how this site uses Cookies. View our privacy policy here.