Krishna Chaitanya G‡
*a,
Avinash L. Puyada and
Bhanuprakash Kb
aSchool of Chemical Sciences, S.R.T.M. University, Nanded-431 606, India. E-mail: krishnachaitanya.gunturu@gmail.com
bInorganic Chemistry Division, Indian Institute of Chemical Technology, Hyderabad, India
First published on 28th January 2015
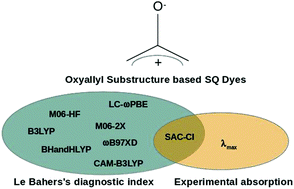
Keeping in view to suggest one more class of molecules in order to make a choice and assessment of exchange–correlation (XC) functionals, symmetrical squarylium dye (SQ) derivatives have been considered and Le Bahers's diagnostic indexes have been applied to study the electronic transition character of these molecular systems through TD-DFT and SAC-CI methods. Unlike calculated absorption using SAC-CI, the TD-DFT results do not match with experimental absorption data. However, the diagnostic indexes obtained with TD-DFT and SAC-CI are apparently similar for all methods. This indicates that care should be taken while choosing XC functionals and assessing the nature of electronic transitions of a specific class of molecules. The centroids of charges associated with the density increase and depletion regions are localized on the central C4 ring and carbonyl groups and with a small extension up to side aromatic substitution of the SQ dye derivative. Hence, the electronic transition occurring in this class of molecules is confined mainly within the central part of molecule. This is in contrast to donor–acceptor–donor type structure in which the charge depletion region is expected at side aromatic substitution of the molecule. The small values of calculated transferred charge (qCT) upon excitation lend support to the theory that the electronic transition in this class of molecules is not CT excitation. This is in agreement with our earlier finding that biradicaloid character and orbital interactions play a key role in their NIR absorption. Hence, highly correlated, single reference and a multi-determinant SAC-CI method is able to explain the nature of electronic excitations in these molecules rather than TD-DFT with various types of XC functionals.
Apart from the success of these new developments in the XC functional, a few important issues have to be noted from recent reports. The inclusion of long range HF exchange into TD-DFT affects the well known accuracy of local excitations, which is a serious problem.14 Li et al. reported that Minnesota functionals are superior than LC functionals for CT excitations with intermediate spatial overlap of orbitals.15 In spite of that, the potential of LC functionals for predicting the CT excitations has been greatly supported by several reports.16–22 On the other hand, Nakano and co-workers highlighted that LC, CAM and Minnesota functionals are developed to minimize the errors between calculated and experimentally measured data only for several molecular sets.23 Hence, there is no assurance of accuracy of results obtained by these methods for a specific set of molecules.
These results indicate that there is a need for a diagnostic test to assess the nature of electronic transitions obtained by TD-DFT and ab initio methods. Several methodologies have been reported recently, which include geometrical descriptors and indexes based on molecular orbitals or electron densities involved in such electronic transitions.24–29 Apart from limitations of these methods with respect to reliability, a few methods have been extensively used as diagnostic tools for assessing TD-DFT results for local, CT and Rydberg kind of electronic transitions.24,26,30 One among them that is based on the overlap of molecular orbital moduli is the Λ-index, which has been successfully applied as a diagnostic tool for different molecular systems.24,31,32 Whenever the extent of orbital overlap is small, a through space CT is thus expected and then the Λ-index values are small enough. Large errors have been predicted for standard GGA and hybrid functionals where range-separated hybrids such as CAM-B3LYP are suggested. On the contrary, this index cannot warn of CT kind of transitions while CT transitions with substantial overlap are correctly obtained by TD-DFT with large Λ values, for example 4-(N,N-dimethylamino)benzonitrile (DMABN).24,31,32 As pointed out by the authors, the problematic excitation where the electron is excited to a spatially extended orbital has not been explained by standard GGA functionals for systems with medium Λ values like triazenes.32
On the other hand, another sophisticated index has been proposed by Le Bahers et al., based on centroids of charge density depletion and charge density increment regions as a qualitative measure of CT associated with electronic excitation.26 This density based descriptor has also found application in studying the excited state evolution, excited state signatures and minimum energy reaction pathways.33–37 The spatial distance between the two barycenters of density distributions as a measure of the CT excitation length is given as DCT. For rod like donor–acceptor (D–A) systems, the half of these centroids axis along the D–A direction is defined as the H-index. The correlation between these two indexes has been suggested as a diagnostic tool for the performance of TD-DFT as well as a warning sign of CT excitation. For H ≥ DCT, the substantial overlap between the centroids along this direction is observed. If H ≤ DCT then the overlap between centroids will be very weak and a through space CT is seen. The difference between DCT and H is given as t-index and has been suggested as a diagnostic tool for TD-DFT results. If t > 1.6 Å, then such excitation seems to be a potentially problematic transition for standard GGA and hybrid functionals. In such cases, the range separated functionals are suggested to cure this problem.26
Even though the validity of this method has been successfully tested with several D–A type of systems (unidirectional charge flow), the symmetrical systems like squarylium (SQ) and croconate (CR) dye derivatives (Scheme 1) have not been tried out for the case in which the net flow of charge is negligible.38–40 Conventionally, SQ dyes and CR dyes were known as D–A–D type of systems and it was believed that the donor (from the side substituent) and acceptor (central four-membered/five-membered ring, respectively, and the carbonyl oxygens) abilities will influence their absorption spectrum.41–46 In contrast, from our earlier calculations through high level ab initio and density functional theory (DFT) calculations, the biradicaloid character (BRC) of these dyes has been unveiled and it has been shown that the orbital interactions and the C–C–C angle in the central ring of SQ/CR are playing a major role in their near infrared (NIR) absorption rather than D–A–D phenomenon.47–49
![]() | ||
Scheme 1 Schematic representation of oxyallyl (OXA) substructure, squarylium (SQ) and croconate (CR) dye derivatives. |
In the same way, the poor performance of LC and CAM functionals for the SQ and CR dye derivatives has been already reported by our group whereas the symmetry adapted cluster configuration interaction (SAC-CI) method correctly describes the electronic transitions in these BRC systems.50,51 The SAC-CI method has also been examined for the study of through-space CT excitation in comparison with TD-DFT methods.52–54 Tawada et al. have found that LC-TD-DFT gives a correct intermolecular behavior of CT energy, which is almost identical with the behavior of the SAC-CI method.54 The applicability and performance of TD-DFT with long-range corrected XC functionals along with the SAC-CI method for Rydberg and valence excited states have also been studied with a benchmark set.55 In addition, the correlation of chemically intuitive indexes for CT excitation based on SAC-CI and TD-DFT calculations on push–pull type of CT systems has been successfully described.56
From the above discussion, it is seen that the validation of Le Bahers's qualitative diagnostic tool has been done through unidirectional charge transfer systems and it also remains a scope for the understanding of the electronic transition mechanism of symmetrical systems. On the other hand, the successful application of a single reference and multi-determinant SAC-CI method is found not only for oxyallyl (OXA) substructured (Scheme 1) and biradicaloid SQ and CR derivatives, but also for Rydberg, valence and CT systems. Hence, there is a need for the study of qualitative analysis and success of the SAC-CI method for symmetrical SQ dye derivatives. Keeping this in view, fourteen SQ dye derivatives have been selected in this study to analyze the electronic transition mechanism by using TD-DFT, SAC-CI and Le Bahers's diagnostic tool. Moreover, this study has an important objective of suggesting one more class of molecules in order to make a choice and assessment of XC-functionals.
The singlet geometries obtained at the B3LYP level were subjected to TD-DFT and SAC/SAC-CI calculations to study the singlet–singlet transition. As there is a negligible difference between excitation energies obtained in the gas phase and solvent media, only gas phase results have been given here for all molecules.47–51 The hybrid XC functionals B3LYP and BH and HLYP, meta hybrid functionals M06-HF and M06-2X, dispersion corrected functional ωB97XD and range corrected functionals LC-ωPBE and CAM-B3LYP have been used for TD-DFT calculations.6,12,58–65 The SAC-CI is restricted to singles and doubles linked operators, whereas the higher order ones are treated through unlinked operators. All orbitals are considered in active space for SQ-1 whereas an active space of 150 to 200 orbitals is chosen with the window option due to the large size of all other molecules in the SAC/SAC-CI calculation. The detailed methodology of SAC-CI is given elsewhere.66–71 The four lowest excited states for each irreducible representation of each molecule are obtained.
In order to study the extent of CT or charge reorganization during the excitations, the qualitative index proposed by Le Bahers et al. has been adopted here. The computed electronic wave functions obtained at ground and excited states are used to quantify the net charge transferred (qCT), CT length (DCT), variation in dipole moment (μCT), H-index and overlap between centroids of charge increased and charge depletion regions (C+/C−) during the electronic excitation by using Multiwfn code.72
In another report, TD-DFT study on a triazene derivative has emphasized the influence of the increased fraction of exact, non-local exchange at long-range from GGA to hybrid and range separated hybrid functionals. In this case, the electron transition has moderate orbital overlap between HOMO and LUMO but still has large errors reported for PBE and this problem is resolved by CAM-B3LYP.32
On the other hand, there are other studies where CT excitations are successfully explained by TD-DFT with standard hybrid functionals such as B3LYP and results are surprisingly accurate. An example is the calculation of the absorption spectra of a series of aromatic donor–acceptor systems of 4-(N,N-dimethylamino)benzonitrile (DMABN) for which the CT excitation is accurate to within a few tenths of an eV.74 This surprising behavior has been reasoned to be due to the large overlap between the frontier orbitals, which are directly involved in the excitation.24 It has been characterized as a CT excitation based on a large dipole moment change upon excitation, which does not imply a small occupied-virtual orbital overlap.75
So far, the different types of electronic excitations have been addressed with regard to small, medium and large overlap between electron donor and acceptor regions. The importance of dipole moment change upon excitations is discussed to assess their CT behavior. In this report we are presenting another class of molecules, i.e. OXA substructure based SQ derivatives in which the extent of overlap between HOMO and LUMO is fairly large and were thought to be D–A–D type of molecules.41–46
In continuation of our previous reports concerning the understanding of the electronic structure of SQ dye derivatives, in this work the extent of charge separation and electronic transitions of fourteen molecules have been studied by Le Bahers's diagnostic indexes. The main difference among these molecules is the side electron rich aromatic groups, such as phenyl, pyrylium, thiopyrylium, pyrrole, thiophene, indole, quinoline, benzoxazole and benzothiazole derivatives including the simple –NH2 group. The calculated absorption wavelengths with various XC functionals by TD-DFT method and SAC-CI along with experimental absorption data are given in Table 1. It is seen from this table that the poor dependence of XC functions on the calculated absorption wavelengths indicates the cyanine like transitions for which TD-DFT is difficult to model.86–89 Apart from the limitations of TDDFT mentioned in the previous sections, electron transitions in cyanine derivatives remained a puzzle. The inadequate treatment of correlation between ground and excited state with TDDFT remains a convincing explanation for its failure.86–89 On the other hand, optical absorption and third-order polarizabilities of a series of cyanine dyes have been obtained successfully by using the dynamic correlated SAC-CI method.90 The contribution of double excitations to the excited state wave function of both cyanine and OXA substructure dyes is another common feature of their electronic structure.47–51,90 The SAC-CI calculated wave function of all SQ dyes have been given in Table 2. The transition from HOMO–LUMO single excitation has maximum CI coefficient of 0.94 where 0.92 has been reported in ref. 90 for cyanines along with less prominent double excitations in both cases that are actually missing at the TDDFT level (ESI†).
Molecule | Experimental | SAC-CI | B3LYP | BH and HLYP | CAM-B3LYP | M06-HF | M06-2X | ωB97XD | LC-ωPBE |
---|---|---|---|---|---|---|---|---|---|
a Ref. 76.b Ref. 45.c Ref. 77.d Ref. 78.e Ref. 79.f Ref. 80.g Ref. 81.h Ref. 82.i Ref. 83.j Ref. 84.k Ref. 85. | |||||||||
SQ-1 | 285a | 293 | 298 | 278 | 292 | 285 | 285 | 293 | 291 |
SQ-2 | 627b | 621 | 519 | 484 | 505 | 502 | 503 | 507 | 505 |
SQ-3 | 636b | 643 | 513 | 480 | 505 | 512 | 504 | 505 | 509 |
SQ-4 | 656c | 650 | 503 | 471 | 495 | 510 | 496 | 495 | 501 |
SQ-5 | 630b | 633 | 534 | 494 | 519 | 514 | 515 | 520 | 518 |
SQ-6 | 540d | 532 | 497 | 460 | 482 | 467 | 476 | 484 | 480 |
SQ-7 | 713e | 721 | 583 | 558 | 583 | 611 | 580 | 587 | 597 |
SQ-8 | 804e | 799 | 638 | 618 | 646 | 689 | 642 | 653 | 666 |
SQ-9 | 565f | 562 | 478 | 467 | 483 | 494 | 478 | 486 | 496 |
SQ-10 | 654g | 662 | 542 | 516 | 536 | 553 | 534 | 539 | 548 |
SQ-11 | 635h | 637 | 541 | 511 | 533 | 552 | 534 | 534 | 540 |
SQ-12 | 732i | 734 | 631 | 579 | 601 | 607 | 602 | 601 | 601 |
SQ-13 | 586j | 580 | 513 | 481 | 503 | 517 | 502 | 503 | 510 |
SQ-14 | 685k | 682 | 549 | 522 | 545 | 567 | 545 | 547 | 556 |
Molecule | λmax | f | CI-wave function |
---|---|---|---|
SQ-1 | 293 | 0.355 | −0.936(H → L) − 0.104(H − 7 → L) + 0.102(H − 3 → L) + 0.067(H − 1 → L + 6) − 0.066(H − 1 → L + 4) + 0.059(H − 1 → L + 11) − 0.177(H → L + 8, H → L) − 0.138(H → L + 3, H − 4 → L) + 0.074(H − 3 → L, H − 5 → L) + 0.063(H − 5 → L, H − 7 → L) + 0.061(H → L, H − 4 → L + 3) − 0.054(H → L + 8, H − 3 → L) − 0.053(H − 3 → L + 3, H − 4 → L) |
SQ-2 | 621 | 1.301 | −0.939(H → L) + 0.111(H − 1 → L + 3) − 0.063(H − 21 → L) − 0.058(H − 7 → L) − 0.112(H → L, H − 1 → L) − 0.079(H → L + 3, H → L) − 0.072(H → L + 11, H − 1 → L) + 0.067(H → L + 11, H − 8 → L) − 0.065(H − 1 → L, H − 2 → L) + 0.056(H → L + 3, H − 2 → L) + 0.053(H → L + 10, H − 10 → L) − 0.052(H → L + 18, H − 3 → L) + 0.050(H → L + 2, H − 4 → L) |
SQ-3 | 643 | 1.255 | −0.937(H → L) − 0.071(H − 3 → L + 1) + 0.062(H − 1 → L + 1) + 0.055(H − 4 → L) + 0.050(H − 2 → L) + 0.120(H → L, H − 3 → L) + 0.088(H → L, H − 1 → L) − 0.072(H → L + 11, H − 3 → L) − 0.070(H → L + 11, H − 6 → L) + 0.064(H → L + 1, H − 4 → L) − 0.062(H → L + 1, H → L) − 0.059(H → L, H − 6 → L) + 0.056(H → L + 28, H − 4 → L) |
SQ-4 | 650 | 1.258 | 0.941(H → L) − 0.104(H − 3 → L + 2) + 0.136(H → L, H − 3 → L) + 0.093(H → L, H − 6 → L) + 0.089(H → L + 11, H − 6 → L) − 0.066(H → L + 2, H − 4 → L) + 0.062(H → L + 2, H → L) + 0.061(H → L + 11, H − 3 → L) + 0.052(H → L + 41, H − 7 → L) |
SQ-5 | 633 | 1.199 | 0.941(H → L) + 0.083(H − 1 → L + 1) + 0.071(H − 19 → L) + 0.101(H → L, H − 1 → L) − 0.072(H → L + 11, H − 1 → L) − 0.071(H → L + 1, H → L) + 0.069(H − 1 → L, H − 2 → L) − 0.060(H → L + 8, H − 9 → L) + 0.059(H → L + 11, H − 8 → L) + 0.057(H → L + 30, H − 2 → L) + 0.051(H − 2 → L + 8, H − 9 → L) |
SQ-6 | 532 | 1.050 | −0.941(H → L) − 0.087(H − 20 → L) − 0.067(H − 5 → L) − 0.050(H − 7 → L) + 0.079(H → L + 6, H − 11 → L) + 0.079(H → L + 1, H → L) + 0.074(H → L, H − 1 → L) + 0.068(H → L + 3, H → L) + 0.066(H → L + 9, H − 1 → L) + 0.065(H − 5 → L + 6, H − 11 → L) − 0.062(H → L + 31, H − 5 → L) − 0.061(H − 1 → L, H − 5 → L) − 0.058(H → L + 31, H → L) + 0.056(H → L + 22, H − 5 → L) + 0.051(H − 22, H → L) |
SQ-7 | 721 | 1.230 | 0.940(H → L) − 0.096(H − 1 → L + 1) + 0.189(H → L + 1, H → L) + 0.092(H → L + 8, H − 1 → L) − 0.060(H → L + 5, H − 1 → L) − 0.057(H − 1 → L, H − 3 → L) + 0.057(H → L + 34, H − 3 → L) + 0.054(H → L + 1, H − 7 → L) − 0.053(H → L + 11, H − 1 → L) |
SQ-8 | 799 | 1.415 | 0.939(H → L) + 0.103(H − 1 → L + 1) + 0.194(H → L + 1, H → L) − 0.104(H → L + 8, H − 1 → L) + 0.063(H → L + 8, H − 8 → L) − 0.060(H − 1 → L, H − 2 → L) − 0.060(H → L + 1, H − 7 → L) − 0.056(H → L, H − 1 → L) − 0.050(H → L + 39, H − 2 → L) |
SQ-9 | 562 | 1.233 | 0.940(H → L) + 0.067(H − 1 → L + 3) + 0.065(H − 2 → L) + 0.130(H → L, H − 1 → L) + 0.114(H → L, H − 3 → L) + 0.093(H → L + 3, H → L) − 0.072(H → L + 19, H − 3 → L) − 0.060(H − 3 → L, H − 5 → L) + 0.058(H → L + 36, H − 5 → L) |
SQ-10 | 662 | 1.220 | −0.935(H → L) − 0.102(H → L + 1) − 0.068(H − 5 → L) − 0.062(H − 2 → L) − 0.053(H − 21 → L) − 0.124(H → L + 1, H → L) + 0.108(H → L, H − 1 → L) + 0.072(H → L + 6, H − 1 → L) + 0.070(H − 1 → L, H − 2 → L) + 0.056(H → L + 40, H − 2 → L) |
SQ-11 | 637 | 1.242 | 0.942(H → L) + 0.088(H − 1 → L + 3) + 0.059(H − 29 → L) − 0.099(H → L + 10, H → L) − 0.097(H → L, H − 1 → L) + 0.080(H → L + 3, H → L) + 0.069(H → L, H − 6 → L) − 0.059(H → L + 31, H − 6 → L) − 0.056(H → L + 10, H − 2 → L) + 0.052(H → L + 25, H − 6 → L) |
SQ-12 | 734 | 1.452 | −0.935(H → L) − 0.099(H − 1 → L + 1) − 0.158(H → L + 1, H → L) + 0.113(H → L + 7, H → L) − 0.074(H → L + 2, H − 1 → L) + 0.055(H → L + 15, H − 6 → L) + 0.051(H → L + 2, H − 3 → L) |
SQ-13 | 580 | 1.365 | 0.944(H → L) + 0.094(H − 1 → L + 1) + 0.060(H − 21 → L) − 0.093(H → L + 10, H → L) + 0.093(H → L, H − 1 → L) + 0.090(H → L + 21, H − 7 → L) + 0.076(H → L + 12, H → L) − 0.069(H → L + 1, H → L) + 0.062(H → L, H − 7 → L) |
SQ-14 | 682 | 1.390 | 0.941(H → L) + 0.077(H − 1 → L + 3) − 0.062(H − 1 → L + 9) − 0.059(H − 1 → L + 1) − 0.053(H25 → L) − 0.109(H → L + 9, H → L) − 0.091(H → L, H − 1 → L) − 0.085(H → L + 3, H → L) + 0.069(H → L + 27, H − 6 → L) + 0.061(H → L + 9, H − 2 → L) − 0.057(H → L + 52, H − 7 → L) − 0.051(H → L, H − 2 → L) |
However, except for SQ-1, none of the TD-DFT results, i.e., hybrid XC functionals B3LYP and BH and HLYP, meta hybrid functionals M06-HF and M06-2X, dispersion corrected functional ωB97XD and range corrected functional LC-ωPBE and CAM-B3LYP are in good agreement with experimental data unlike with the case of SAC-CI, which was explained to be due to the OXA substructure and BRC of these molecular systems.47–51 In general, a molecule can be treated as biradicaloid if the singlet and triplet energy states have a separation below 1 eV.91 Unlike for all other molecules, SQ-1 has a large HOMO–LUMO gap and singlet–triplet states energy splitting are found as 9.73 eV and 2.26 eV, respectively.48 Therefore, SQ-1 cannot be categorized as a biradicaloid molecule even though it has an OXA substructure. Hence, the TD-DFT method worked for this molecule.
The diagnostic index parameters have been calculated with both TD-DFT and SAC/SAC-CI methods for all the molecules and are given in Fig. 2a to c for qCT, C+/C− and H-index, respectively (the results including DCT, μCT are given in Table S1 in ESI†). The current electronic densities for ground and excited states were obtained at SAC and SAC-CI levels, respectively, while SCF and the lowest energy excited state densities were used for each XC functional. On comparison of the results from TD-DFT and SAC/SAC-CI methods, some interesting features can be drawn. Even though experimental absorption wavelengths are not obtained with the TD-DFT method, the diagnostic indexes are quite similar to the SAC/SAC-CI results.
As expected for symmetrical systems, DCT, the distance between charge increment and depletion barycenters during electronic excitation are found to be nearly zero in all molecules, i.e., less than 0.010 Å calculated by hybrid, meta-hybrid, range-separated hybrid, dispersion corrected functionals and the highly correlated SAC/SAC-CI method (ESI†). For centrosymmetric D–A–D type of quadrupolar systems, an equal amount of charge depletion from both side groups to the central acceptor group is anticipated. Indeed, due to their symmetry constraints, the average of charge depletion barycenters (on side donor groups) coincides with the charge increment barycenter, i.e. at the central acceptor group. This gives the DCT as zero for perfectly symmetrical systems and negligible values obtained in this study are due to small out of symmetry variations. This negligible DCT values further leads to negligible μCT values (ESI†).
To quantify the net CT quantity in these molecules, qCT has been calculated and plotted in Fig. 2a. The net amount of charge transferred is negligible when compared to the standard CT type transitions and also not more than 0.5 e obtained irrespective of the methodologies used for all the molecules. It is worth mentioning that if these SQ dyes are considered as D–A–D type of CT systems, then CT from each donor group is even less than 0.25 e to the central C4 ring. Thus, charge reorganization takes place instead of CT during the electronic excitation in these systems. It is also seen from Fig. 2a that there is no correlation obtained with XC functional on net CT quantity in these systems. This clearly indicates that care should be taken about the choice of XC functional while assessing the electronic structure of a specific class of molecules. Correlation study of indexes obtained with different methodologies will not guarantee the accuracy of excitation energies obtained by them.26,56
In order to address this, the total charge depletion (C−), increment regions (C+) and variation of charge density upon excitation (Δρ) have been depicted in Fig. 3. The blue and cyan color regions correspond to charge increment and charge decrement, respectively. In contrast to the D–A–D phenomenon, both the charge increment and depletion regions are mainly centered around the central C4 ring. The difference in the donor ability of side aromatic groups is not represented in the charge depletion plots, which is clear from simple –NH2 groups to large benzoxazole/benzothiazole groups. From the last column of Fig.3, the variation of charge density between ground and excited states is mainly located on the central ring part with negligible contribution from electron rich side donor groups. This is again resembled from the maximum overlap of C+ and C− regions, which is shown in Fig. 2b. Irrespective of the methodology, the extent of overlap of C+ and C− regions is not different for all molecules, only except for SQ-1, which is not considered as biradicaloid and TD-DFT is successful. This shows neither the side aromatic substitutions nor hetero atoms present in them have any significant contribution in this electronic transition mechanism. Hence, the NIR absorption of SQ dye derivatives is accompanied with charge reorganization in the central part of the molecule irrespective of the nature of donor strength of the side aromatic substituent.92
Another important index for rod like systems, the H-index is defined to understand the extent of overlap between electron donating and electron accepting regions. From Fig. 2c, the large H-index values are resultant of confined overlap of C+ and C− regions around the central C4 ring and thus there is no charge separation existing in these molecules. The observed variations for H-index values among phenyl derivatives, i.e., SQ-2, SQ-3, SQ-4, SQ-5 and SQ-6 are assigned for different substitutions on phenyl groups by which the charge stabilization at OXA substructure of the central C4 ring takes place rather than affecting CT behavior.47 Similar observation is found in between pyrylium and thiopyrylium derivatives, and pyrrole and thiophene derivatives. This is in support to BRC of these molecules where orbital interaction between carbonyl oxygens and central C4 ring actually plays a major role in their NIR absorption.47–51
All of these Le Bahers's diagnosing indexes show that there is no charge-separated state that exists in SQ dye derivatives and there exists a perfect overlap of charge depletion and charge increment centroids. Moreover, both the centroids have been localized at and around the central C4 ring. These findings have significant correlation with the recent developments in experimental chemistry and material sciences. New promising materials have been synthesized by substituting electron withdrawing groups at the central C4 ring for a variety of optical response applications.79,93–98
Le Bahers's diagnostic indexes have been used to study the electronic structure of these molecules through TD-DFT and SAC-CI methods. Even though the TD-DFT results do not match with the experimental absorption, the diagnostic indexes are quite similar to the results obtained with SAC-CI. This clearly indicates that care should be taken while choosing XC functionals and assessing the nature of electronic transitions of a specific class of molecules. The centroids of charges associated to the density increase and depletion regions are localized on the central C4 ring and carbonyl groups and with a small extension up to side aromatic substitution of the SQ dye derivative. Hence, the electronic transition occurring in this class of molecules is confined mainly within the central part of the molecule. This is in contrast to the experimentalist hypothesis of the D–A–D type structure in which the charge depletion region is expected at the side aromatic substitution of the molecule. The calculated transferred charge (qCT) upon excitation is less than 0.25 e with respect to each side aromatic donor group, which supports that the electronic transition in this class of molecules is not CT excitation. This is in agreement with our earlier finding that BRC and orbital interactions play a key role in their NIR absorption. Hence, a highly correlated, single reference and multi-determinant SAC-CI method is able to explain the nature of excitations in these molecules rather than TD-DFT with various types of XC functionals.
This observation helps experimentalists in understanding the molecular structure of symmetrical SQ dye derivatives for further design and development of novel molecules in materials chemistry. To support this, the tuning of electronic absorption spectra of SQ derivatives by incorporating electron withdrawing groups at electron rich central C4 ring has become a promising design principle for novel materials recently.79,93–98
Footnotes |
† Electronic supplementary information (ESI) available. See DOI: 10.1039/c4ra10649k |
‡ Present address: Materials Research Laboratory, University of Nova Gorica, Slovenia, SI 5000. |
This journal is © The Royal Society of Chemistry 2015 |