 Open Access Article
Creative Commons Attribution 3.0 Unported Licence
Annealing-induced periodic patterns in solution grown polymer single crystals†
Bin
Zhang
abc,
Jingbo
Chen
c,
Hui
Zhang
a,
Moritz C.
Baier
d,
Stefan
Mecking
d,
Renate
Reiter
af,
Rolf
Mülhaupt
ef and
Günter
Reiter
*af
aInstitute of Physics, University of Freiburg, 79104 Freiburg, Germany. E-mail: guenter.reiter@physik.uni-freiburg.de
bHermann Staudinger Graduate School, University of Freiburg, 79104 Freiburg, Germany
cSchool of Materials Science & Engineering, Zhengzhou University, Zhengzhou 450002, People's Republic of China
dChair of Chemical Materials Science, Department of Chemistry, University of Konstanz, 78464 Konstanz, Germany
eInstitute of Macromolecular Chemistry, University of Freiburg, 79104 Freiburg, Germany
fFreiburg Materials Research Centre, University of Freiburg, 79104 Freiburg, Germany
First published on 16th January 2015
Abstract
Applying a slow annealing procedure, we have transformed geometrically simple, faceted polymer single crystals into periodically branched crystals. Interestingly, the period of the branches increased logarithmically with annealing time and depended on crystallization temperature in a similar fashion as the thickness of the lamellar crystal. We tentatively relate the periodic pattern to meta-stable states, differing in crystalline order and thus melting temperature. The degree of meta-stability and its variance depend on lamellar thickness but can also change with the degree of molecular order, causing differences in melting behaviour. Our results propose that periodic variations in thermal stability within a polymer single crystal can be made visible by annealing.
1. Introduction
Polymer crystals usually grow under conditions far away from thermodynamic equilibrium,1–5 resulting in lamellar crystals of highly folded chain-like molecules.6,7 These crystals may exhibit many different, often complex, morphologies.8–11 However, in particular in solutions, for many decades polymer crystals with a simple faceted morphology have also been frequently observed.12–15 At the corresponding comparatively fast growth rates,16–18 polymers cannot equilibrate and meta-stable states of folded polymers are the rule. Consequently, although of simple shape, faceted polymer crystals should consist of polymers differing in degree of molecular order.19–21 According to the Gibbs–Thomson relation,22 the melting temperature depends on the size of the crystal or the size of the domain of molecules of equal degree of order. Smaller or less ordered regions melt at lower temperatures than larger or better ordered ones.23–27 Thus, when annealing faceted crystals at temperatures below the nominal melting temperature,28,29 one may anticipate observing morphological changes which may provide information on the spatial distribution of less ordered regions within faceted crystals and, possibly, on how the faceted crystals were grown.Annealing-induced morphological changes in polymer single crystals at temperatures well below the nominal melting point have been observed previously.6,30–33 Local molecular reorganization processes were identified as the central mechanism which allowed to partially remove chain folds with increasing annealing time or annealing temperature.31,34,35 As a consequence, the mean lamellar thickness increased, leading to enhanced thermal stability.36,37 Pioneering microscopy works38–42 on individual single crystals have demonstrated that, as a mere consequence of mass conservation, such annealing induced local thickening43 is accompanied by the formation of a “Swiss cheese” morphology or “saw-tooth” patterns.44–47 Such spatially varying changes in morphology induced by annealing reflect heterogeneities, i.e., differences in molecular order within these crystals. However, so far annealing did not reveal any evident spatial correlations of these heterogeneities. No relation to the initial growth conditions and to the conditions of annealing could be established.
One reason for not observing correlated patterns induced by annealing may be attributed to the typically small differences in degree of order within a single crystal. Thus, to uncover heterogeneities,48,49 differences in thermal stability have to be amplified first. Here, we have chosen a lengthy series of annealing steps which started at low temperatures and slowly moved to higher temperatures. Annealing has to remove sequentially, and with high accuracy, crystalline parts which have an only slightly lower thermal stability than more perfect ones. Upon proper annealing, less stable regions will melt. Simultaneously, the remaining regions will become even more stable, e.g., thicker. Consequently, the finally surviving regions reflect, to a large extent, the more stable crystalline parts formed already during crystal growth. By applying suitable annealing sequences, we attempted to unveil the less stable parts of a polymer crystal and aim to answer the following question: are heterogeneities within facetted lamellar single crystals distributed homogeneously or are they arranged according to some pattern?
2. Experimental
As a model system for answering these general questions we have chosen an archetypical crystallisable polymer: polyethylene.50,51 The here reported phenomenon was first revealed and studied in detail for a partially deuterated sample of low polydispersity index (PDI). To demonstrate the generality of the phenomenon we verified that other PE-samples, including commercial products with high PDI, also exhibited analogous morphological changes induced by appropriate annealing procedures. However, the changes were more accentuated and more uniform for polymers with a narrow molecular weight distribution.As shown in Table 1, we studied four high molecular weight polyethylene samples, including two homopolymers of protonated polyethylene (PE), a deuterated PE (dPE) and a diblock copolymer of hydrogenated and deuterated polyethylene (hPE-b-dPE) of different molecular weights.52 For all these polymers, single crystals were prepared by a self-seeding method,53 from dilute solutions at appropriate crystallization temperatures (Tc). The polymers were dissolved in p-xylene at rather low concentrations of 0.001 wt% or 0.0001 wt% by heating the solution (ca. 1 ml in a closed glass vial) first to 130 °C for 30 min, i.e., well above the nominal dissolution temperature of ca. 100 °C. This so homogenized polymer solution was then rapidly crystallized and aged for 2 hours at 70 °C in a thermostated bath filled with silicone oil. The solution was subsequently heated to the respective self-seeding temperature Ts, where it was kept for 10 minutes. For growing single crystals, the samples were subsequently quickly transferred to another thermostated bath at a pre-set crystallization temperature Tc. Drops of such solutions containing suspended PE single crystals were then deposited onto a silicon wafer, an often used substrate.47,54–57 After deposition, the solvent was allowed to evaporate completely in vacuum at 25 °C for 12 hours.
| Code | Material | M w [g mol−1] | PDI | T s (self-seeding temperature), [°C] | Crystallization concentration, [wt%] | T m b, [°C] |
|---|---|---|---|---|---|---|
| a 29 mol% ethylene-d4 (determined by IR spectroscopy). b The temperature control program for DSC was as follows: (a) heat the as-received polymer bulk sample from room temperature to 200 °C at a rate of 10 °C min−1. (b) Keep the polymer melt by holding the temperature at 200 °C for 5 min. (c) Cool at a rate of 10 °C min−1 down to −50 °C. (d) Heat the polymer sample from room temperature to 200 °C at a rate of 10 °C min−1. | ||||||
| PE1 | PE-b-deuterated PEa | 3.8 × 10⁶ | 1.23 | 105 | 0.0001 | 136.1 |
| PE2 | Deuterated PE | 5.76 × 10⁵ | 1.08 | 100 | 0.001 | 132.5 |
| PE3 | PE | 3.5 × 10⁶ | 7.5 | 106 | 0.0001 | 135.8 |
| PE4 | PE | 7.5 × 10⁵ | 7.5 | 100 | 0.001 | 135.4 |
AFM Measurements and annealing of single crystals
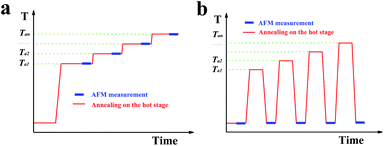
Characterization of the morphology and thermal behaviour of the single crystals was performed by atomic force microscopy (AFM, JPK Instruments, Germany). The microscope was equipped with a high-temperature heating stage accessory, controlling the temperature of the sample, allowing to perform in situ experiments at elevated temperatures. Fig. 1a illustrates a typical temperature protocol used in this study for the in situ AFM experiments. By conducting in situ AFM measurements during annealing of the samples, it was possible to observe, in addition to changes in morphology at the chosen annealing temperature, also changes in the phase-signal of the tapping-mode AFM. This phase-signal reflects viscoelastic properties of the sample and thus allowed to distinguish between crystalline and molten regions. However, the relatively high annealing temperatures caused stickiness between the AFM-tip and the molten polymers and made measurements more complex. In addition, due to the required scanning velocities, it was often difficult to obtain high-resolution in situ images with a low noise level.Thus, some high-resolution AFM images of the morphology evolution after annealing at increasing temperature (Ta) and for prolonged times were performed ex situ at room temperature. For ex situ experiments, the single crystals were annealed first on a Linkam THMS 600 hot stage (Linkam Scientific Instruments, Tadworth, UK) under nitrogen atmosphere at a desired temperature for a chosen time (mostly 20 minutes). The sample was subsequently cooled to room temperature and investigated by AFM. The sample was further annealed on the Linkam hot stage at a slightly higher temperature and re-examined by AFM. This procedure was repeated several times. However, at room temperature the molten polymers re-crystallized and the AFM phase-signal was not able to distinguish them from the crystalline regions existing at elevated Ta. Thus, after a temperature protocol as the one shown in Fig. 1b including a quench to room temperature, AFM measurements could only visualize the morphology obtained after the annealing process but could not indicate the amount of molten polymers and their distribution within the single crystal.
3. Results and discussion
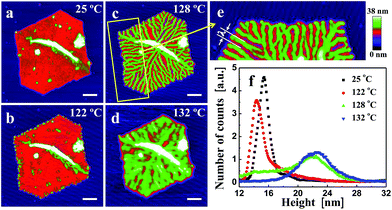
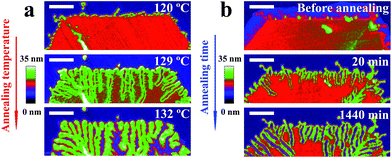
In Fig. 2, we show a sequence of in situ AFM height images of a truncated lozenge-shaped polyethylene single crystal of PE1, taken after different annealing steps. At each temperature, the sample was kept for 20 min, followed by a temperature increase of a maximum of a few degrees (see also Fig. 1a). Up to an annealing temperature (Ta) of ca. 122 °C, the crystal morphology almost did not change. Only the crystal periphery became periodically modulated. Notches, bounded by a thickened rim, appeared along the edges of the crystal. These localized changes reflect modulations of stability favoured by the higher mobility of the polymer chains located at the edges of the crystals, i.e., the most unstable parts of crystal. There, reorganization of thermodynamic meta-stable states towards more stable states occurred first.Upon annealing at Ta > 122 °C, thickened parts became more prominent and grew from the periphery of the crystal in the direction towards the interior of the crystal. The resulting branches progressively carved regularly spaced valleys into the single crystal. Eventually, the branches reached the centre of the crystal, i.e. the initial nucleation site. When heating slightly above 130 °C, valleys were refilled by molten polymers. However, the memory of the branched patterns still existed as the branches re-appeared upon cooling (see also Fig. 3). Only after heating above ca. 135 °C, all memory of a crystalline pattern was lost. It is worth noting that annealing the crystal by jumping right away to temperatures above ca. 130 °C caused the formation of “Swiss-cheese”-like patterns rather than branches. Thus, slowly removing less perfect crystalline regions by providing enough time for re-organisation within the crystal seems to be required to generate periodic patterns formed within a single crystal.
In addition to identifying local morphological changes, we also determined the mean height of the crystal, recorded during annealing. These mean values allowed a direct comparison with results frequently obtained via averaging techniques like X-ray scattering.34,47 As shown in the histogram of Fig. 2f, taken from the recorded AFM images, a sequence of stages can be identified, consistent with previous observations.21 For the early stages (low Ta and/or short annealing times (ta)), the mean height of the crystal (its lamellar thickness (ld)) did not change much. Nonetheless, even at such early stages, the morphology already started to change at the crystal periphery. At progressively higher Ta, or after prolonged annealing, a stage of local melting and significant reorganization followed (Fig. 2c and d), causing a shoulder to appear at higher thickness values and evolving into a peak in the height histogram. With increasing Ta, this new peak, which is typically attributed to lamellar thickening,29,31,58,59 slowly shifted to higher values of ld. In combination with the direct space observation by AFM, we can conclude that the lamellar thickening process was accompanied by the formation of a regular pattern within the single crystal. For Ta > 130 °C, the height distribution became rather broad, related to the simultaneous melting of large parts of the crystal and thickening of the remaining parts, the branches.
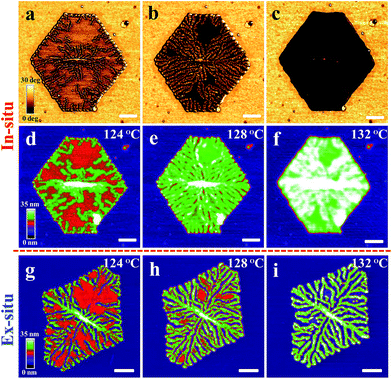
Using the phase-signal of tapping mode AFM, it is possible to visualize differences in viscoelastic properties within an annealed single crystal. Under the imaging conditions used here, the contrast visible in the phase images reflects crystalline (light colours) and molten (dark colours) areas. As can be seen in Fig. 3a, the AFM phase images indicated that in the course of the appearance of the branches, they carved regularly spaced valleys into the single crystal which were partially filled by molten polymers as indicated by the change in the phase signal (the dark colour of the phase signal is indicating molten polymers).
The short waiting time of 10 min at Ta = 124 °C did not allow for the formation of branched structures within the whole crystal. After raising the temperature to 128 °C, only the thickened parts, i.e. the parts forming the branched morphology, exhibited a solid-like response in the AFM phase-signal. At even higher temperatures, such as 132 °C (Fig. 3c), the branched structure seemed to disappear. Under the chosen imaging conditions, it was not visible anymore in the AFM phase-signal. However, when increasing the tapping force,60,61 it became clear that branches still existed but were “hidden” under a layer of molten polymers. In addition, upon quenching to room temperature, the branched structure became clearly visible (compare Fig. 3f and i).
Upon cooling, all molten polymers re-attached to the remaining branches, making them visible again in the AFM topography images. A series of high resolution AFM high images of PE1 single crystals were taken at room temperature after annealing at various Ta (see Fig. 3g–i). When annealing at temperatures lower than 128 °C, the morphological evolution of the annealing-induced branched pattern was obviously very similar to what was demonstrated in the above in situ AFM images (compare Fig. 2b and c and 3b and e). Crack-like structures could be seen both in the central region and at the crystal edges after annealing at 128 °C. As shown in the AFM height image (Fig. 3h), the cracks formed a branched pattern. In addition, the lamellar thickness within such single crystals increased upon annealing.
Upon quenching the sample to room temperature, re-crystallisation of polymers from the partially molten state in between the branches contributed to the morphological changes. This became particularly visible for annealing temperatures above 128 °C. It can be deduced by comparison of Fig. 3d–f with Fig. 3g–i that re-crystallisation of the molten polymers was guided by the crystalline branched pattern.
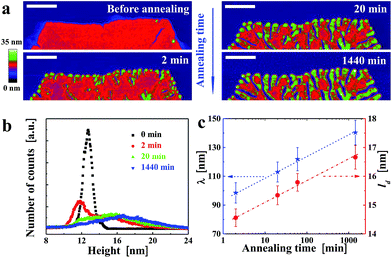
Besides varying Ta, we also varied ta while keeping Ta constant. For example, at Ta = 125 °C, the morphological evolution of one solution-grown faceted crystal is shown in Fig. 4a. Already after ta = 2 min, numerous notches formed along the crystal edges. With increasing ta, these notches penetrated further towards the centre of the crystal. Elongated branches formed in each sector of the initial crystal, all of them pointing preferentially towards the centre (i.e. the nucleation site) of the crystal. As shown in the height histogram of Fig. 4b, a second broad peak emerged at the expense of the initial peak. The comparison of Fig. 2 and 4 reveals a kind of time–temperature superposition. Interestingly, the value of the periodic spacing (λ) of the branches increased with ta, reflected by a decrease in number of branches per unit length. This evolution of λ(ta) followed the same trend as the mean crystal thickness (ld) (Fig. 4c), consistent with previous scattering experiments34,36,47 which averaged over a large number of crystalline domains. Both, λ and ld increased approximately with the logarithm of ta.
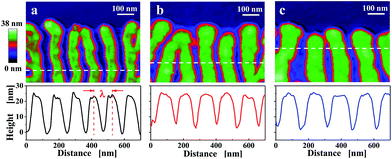
In order to demonstrate the generality of our approach, we have repeated analogous experiments for a variety of PE molecules of high molecular weight, including commercial products (see Experimental section). For all samples, we grew single crystals having the shape of a truncated lozenge. Applying similar annealing procedures, we could generate analogously branched patterns for all studied samples. As shown in Fig. 5a for a constant annealing time of 20 minutes, λ and the length of the branches increased with Ta. Keeping Ta constant (Fig. 5b) and varying ta, a similar increase of λ was observed.
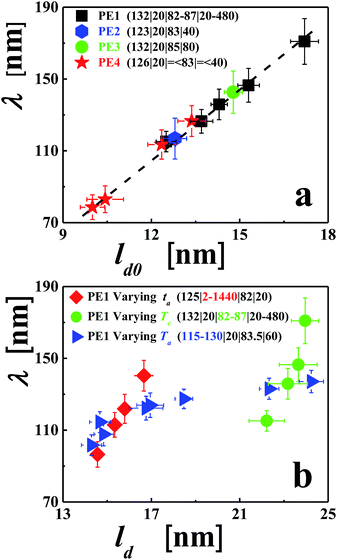
The initial lamellar thickness (ld0) depends on the growth rate, which, in turn, can be controlled by crystallization temperature Tc.35,62 In addition, the thickness (ld) of a crystalline lamella can vary during growth in the regions behind the growth front or during post-growth annealing stages. In Fig. 6, we demonstrate that λ also depends on Tc. This suggests that a relation between λ and ld0 (or ld) exists.
As has been shown previously,34,58 lamellar thickening induced by annealing is a complex process involving (1) a molecular diffusion process of the detached/molten molecules to more stable, thicker crystalline regions, (2) attachment and incorporation of molecules into these regions, followed by (3) further improvement of stability by removing even more folds and disappearance of less stable regions. Consequently, as shown in Fig. 2–6, annealing temperature and time have a crucial influence on the evolution of morphology and lamellar thickness (ld) during/after growth. The rate of such annealing-induced changes depended on the initial degree of order and the morphology of the single crystal, mainly determined by the crystallization temperature.
To shed some light on the origin of annealing-induced branched patterns, we searched for relations between the conditions under which the faceted polymer single crystals were grown and the periodic patterns observed after annealing. For various annealing procedures and crystallization conditions, we analysed a series of single crystals and compared the evolution of λ with the accompanying changes in the parameters ld0 (see Fig. 7a) or ld (see Fig. 7a). The results are summarized in Fig. 7, from which we can draw the following conclusions. λ was found to be much smaller than the size of the faceted crystals and only about ten times larger than ld. As shown in Fig. 4, for constant Ta, λ increased approximately with log(ta). Because ld also increased with log(ta), a clear relation between λ and ld was found. Single crystals prepared at increasing Tc showed an increase in ld0. As shown in Fig. 7b for annealing times increasing with Tc, λ also increased with Tc, giving rise to an approximately linear relation between λ and ld0. A more complex behaviour was found when keeping ta constant (20 minutes) and varying Ta (from 115 to 130 °C). At low Ta, λ increased rapidly with ld. But at high Ta, λ increased only slowly with ld. At low annealing temperatures (from ca. 115 to 120 °C), changes in morphology could only be observed for crystals grown at low Tc. At such conditions, λ was found to be small, i.e., the distances between branches were short, allowing for relatively efficient transport of polymer chains between branches. Thus, a coarsening of λ was observed even for short annealing times. For thicker lamellar crystals, higher temperatures and longer times were required to allow for the annealing-induced changes in morphology to become visible.
4. Conclusions
Using solution grown polymer single crystals of polyethylene, one of the simplest and most widely studied polymers, we have been able to change the morphology of faceted crystals by annealing. Under the here applied low-temperature and long-lasting annealing conditions, we were able to unveil a rather regularly branched pattern within a polymer single crystal which we tentatively relate to variations in the degree of thermal stability. Upon annealing, the less stable regions, characterized by a lower melting temperature, were redistributed between the more stable regions. The branches, which emerged after annealing, all had similar width and were preferentially oriented towards the centre, the initial nucleation site. Like the thickness of the lamellar crystal, the observed period of the branches depended on the crystallization conditions of the starting crystals but also on the conditions of subsequent annealing. Although within experimental error no regions of different lamellar thickness could be identified within as-grown single crystals, we speculate that such regions of differing degrees of thermal stability existed. These observed annealing-induced morphological changes from a faceted to a branched pattern within polymer single crystals may provide an instructive approach for studying differences in organization and thermal stability created within polymer single crystals in the course of growth.Acknowledgements
The authors would also like to thank Gert Strobl, Wenbing Hu, Liangbin Li, Jun Xu, and Murugappan Muthukumar for fruitful discussions. We also would like to acknowledge financial support from the Sino-German Center for Research Promotion and the German Science Foundation. The authors are grateful to the National Science Foundation of China (no. 11172272 and 11372284) and to the China Scholarship Council (CSC) for a grant to BZ and HZ. M.C.B thanks the Fonds der Chemischen Industrie for a Chemiefonds scholarship. The authors thank Lars Bolk for GPC and DSC measurements and Chemtura for the kind donation of MAO solution.References
- T. Haxhimali, A. Karma, F. Gonzales and M. Rappaz, Nat. Mater., 2006, 5, 660–664 CrossRef CAS PubMed.
- G. R. Strobl, The physics of polymers, Springer, 1997 Search PubMed.
- E. Ben-Jacob and P. Garik, Nature, 1990, 343, 523–530 CrossRef PubMed.
- R. Trivedi, S. Liu and S. Williams, Nat. Mater., 2002, 1, 157–159 CrossRef CAS PubMed.
- G. Reiter and G. R. Strobl, Progress in understanding of polymer crystallization, Springer, 2007 Search PubMed.
- X. Jiang, X. Liu, Q. Liao, X. Wang, D.-D. Yan, H. Huo, L. Li and J.-J. Zhou, Soft Matter, 2014, 10, 3238–3244 RSC.
- A. Keller, Polymer, 1962, 3, 393–421 CrossRef CAS.
- G. Tegze, G. I. Tóth and L. Gránásy, Phys. Rev. Lett., 2011, 106, 195502 CrossRef.
- L. Gránásy, T. Pusztai, T. Börzsönyi, J. A. Warren and J. F. Douglas, Nat. Mater., 2004, 3, 645–650 CrossRef PubMed.
- P. Ball, Nature, 2011, 480, 455 CrossRef CAS PubMed.
- X. Liu, Y. Zhang, D. K. Goswami, J. S. Okasinski, K. Salaita, P. Sun, M. J. Bedzyk and C. A. Mirkin, Science, 2005, 307, 1763–1766 CrossRef CAS PubMed.
- G. Reiter, G. Castelein and J.-U. Sommer, Phys. Rev. Lett., 2001, 86, 5918 CrossRef CAS.
- K. Rahimi, I. Botiz, N. Stingelin, N. Kayunkid, M. Sommer, F. P. V. Koch, H. Nguyen, O. Coulembier, P. Dubois and M. Brinkmann, Angew. Chem., Int. Ed., 2012, 51, 11131–11135 CrossRef CAS PubMed.
- M. Voigt, S. Dorsfeld, A. Volz and M. Sokolowski, Phys. Rev. Lett., 2003, 91, 026103 CrossRef CAS.
- S. Z. D. Cheng, Nature, 2007, 448, 1006–1007 CrossRef CAS PubMed.
- S. Organ and A. Keller, J. Polym. Sci., Part B: Polym. Phys., 1986, 24, 2319–2335 CrossRef CAS PubMed.
- B. Wunderlich and P. Sullivan, J. Polym. Sci., 1962, 61, 195–221 CrossRef CAS PubMed.
- P. H. Geil and D. H. Reneker, J. Polym. Sci., 1961, 51, 569–582 CrossRef CAS PubMed.
- K. Kuwabara, H. Kaji, M. Tsuji and F. Horii, Macromolecules, 2000, 33, 7093–7100 CrossRef CAS.
- Y. Jiang, X.-G. Jin, C. C. Han, L. Li, Y. Wang and C.-M. Chan, Langmuir, 2003, 19, 8010–8018 CrossRef CAS.
- Y. Kikkawa, H. Abe, T. Iwata, Y. Inoue and Y. Doi, Biomacromolecules, 2001, 2, 940–945 CrossRef CAS.
- B. Wunderlich and G. Czornyj, Macromolecules, 1977, 10, 906–913 CrossRef CAS.
- N. Dubreuil, S. Hocquet, M. Dosière and D. A. Ivanov, Macromolecules, 2004, 37, 1–5 CrossRef CAS.
- J. Loos and M. Tian, Polymer, 2006, 47, 5574–5581 CrossRef CAS PubMed.
- M. Fujita and Y. Doi, Biomacromolecules, 2003, 4, 1301–1307 CrossRef CAS PubMed.
- T. Liu, J. Petermann, C. He, Z. Liu and T.-S. Chung, Macromolecules, 2001, 34, 4305–4307 CrossRef CAS.
- T. Liu, W. C. Tjiu and J. Petermann, J. Cryst. Growth, 2002, 243, 218–223 CrossRef CAS.
- J. Xu, Y. Ma, W. Hu, M. Rehahn and G. Reiter, Nat. Mater., 2009, 8, 348–353 CrossRef CAS PubMed.
- N. Basu, A. Osichow, S. Mecking and G. Reiter, Eur. Phys. J. E: Soft Matter Biol. Phys., 2012, 35, 1–12 CrossRef CAS PubMed.
- J. Nakamura, M. Tsuji, A. Nakayama and A. Kawaguchi, Macromolecules, 2008, 41, 1358–1363 CrossRef CAS.
- M. Wang, H. Gao, L. Zha, E.-Q. Chen and W. Hu, Macromolecules, 2012, 46, 164–171 CrossRef.
- F. Zhang, G. G. Baralia, B. Nysten and A. M. Jonas, Macromolecules, 2011, 44, 7752–7757 CrossRef CAS.
- B. Zhang, J. Chen, M. C. Baier, S. Mecking, R. Reiter, R. Mülhaupt and G. Reiter, Macromol. Rapid Commun., 2015, 36, 181–189 CrossRef CAS PubMed.
- Y.-X. Liu, J.-F. Li, D.-S. Zhu, E.-Q. Chen and H.-D. Zhang, Macromolecules, 2009, 42, 2886–2890 CrossRef CAS.
- G. Reiter, Chem. Soc. Rev., 2014, 43, 2055–2065 RSC.
- C. N. Rochette, S. Rosenfeldt, K. Henzler, F. Polzer, M. Ballauff, Q. Tong, S. Mecking, M. Drechsler, T. Narayanan and L. Harnau, Macromolecules, 2011, 44, 4845–4851 CrossRef CAS.
- B. Zhang, J. Chen, J. Cui, H. Zhang, F. Ji, G. Zheng, B. Heck, G. N. Reiter and C. Shen, Macromolecules, 2012, 45, 8933–8937 CrossRef CAS.
- W. O. Statton and P. H. Geil, J. Appl. Polym. Sci., 1960, 3, 357–361 CrossRef CAS PubMed.
- P. Dreyfus and A. Keller, J. Polym. Sci., Part B: Polym. Phys., 1970, 8, 253–258 CrossRef CAS PubMed.
- P. H. Geil, Polymer Single Crystals, Interscience Publishers, New York, 1963 Search PubMed.
- A. Peterlin, J. Polym. Sci., Part B: Polym. Phys., 1963, 1, 279–284 CrossRef CAS PubMed.
- R. J. Roe, C. Gieniewski and R. G. Vadimsky, J. Polym. Sci., Polym. Phys. Ed., 1973, 11, 1653–1670 CrossRef CAS PubMed.
- H. E. Bair, R. Salovey and T. W. Huseby, Polymer, 1967, 8, 9–20 CrossRef CAS.
- R. I. Gearba, N. Dubreuil, D. V. Anokhin, Y. K. Godovsky, J.-J. Ruan, A. Thierry, B. Lotz and D. A. Ivanov, Macromolecules, 2006, 39, 978–987 CrossRef CAS.
- X. Wang, J. Zhou, L. Li and C. M. Chan, Macromol. Rapid Commun., 2007, 28, 2001–2006 CrossRef CAS PubMed.
- N. Sanz, J. Hobbs and M. Miles, Langmuir, 2004, 20, 5989–5997 CrossRef CAS.
- S. Hocquet, M. Dosiere, A. Thierry, B. Lotz, M. H. J. Koch, N. Dubreuil and D. A. Ivanov, Macromolecules, 2003, 36, 8376–8384 CrossRef CAS.
- S. Rastogi, D. R. Lippits, G. W. Peters, R. Graf, Y. Yao and H. W. Spiess, Nat. Mater., 2005, 4, 635–641 CrossRef CAS PubMed.
- H. Li, J. Liu, D. Wang and S. Yan, Colloid Polym. Sci., 2003, 281, 973–979 CAS.
- U. W. Gedde and A. Mattozzi, in Long Term Properties of Polyolefins, Springer, 2004, pp. 29–74 Search PubMed.
- D. C. Bassett and A. Keller, Philos. Mag., 1962, 7, 1553–1584 CrossRef CAS PubMed.
- S.-M. Yu and S. Mecking, J. Am. Chem. Soc., 2008, 130, 13204–13205 CrossRef CAS PubMed.
- D. Blundell, A. Keller and A. Kovacs, J. Polym. Sci., Part B: Polym. Phys., 1966, 4, 481–486 CrossRef CAS PubMed.
- Y. Ryousho, S. Sasaki, T. Nagamura, A. Takahara and T. Kajiyama, Macromolecules, 2004, 37, 5115–5117 CrossRef CAS.
- M. Tian and J. Loos, J. Polym. Sci., Part B: Polym. Phys., 2001, 39, 763–770 CrossRef CAS.
- J. Nakamura and A. Kawaguchi, Macromolecules, 2004, 37, 3725–3734 CrossRef CAS.
- Y. Wang, M. Rafailovich, J. Sokolov, D. Gersappe, T. Araki, Y. Zou, A. D. L. Kilcoyne, H. Ade, G. Marom and A. Lustiger, Phys. Rev. Lett., 2006, 96, 028303 CrossRef CAS.
- S. J. Organ, J. K. Hobbs and M. J. Miles, Macromolecules, 2004, 37, 4562–4572 CrossRef CAS.
- M. I. Abo el Maaty and D. C. Bassett, Polymer, 2005, 46, 8682–8688 CrossRef CAS PubMed.
- A. Knoll, R. Magerle and G. Krausch, Macromolecules, 2001, 34, 4159–4165 CrossRef CAS.
- G. Bar, Y. Thomann, R. Brandsch, H.-J. Cantow and M.-H. Whangbo, Langmuir, 1997, 13, 3807–3812 CrossRef CAS.
- J. D. Hoffman and R. L. Miller, Polymer, 1997, 38, 3151–3212 CrossRef CAS.
Footnote |
| † Electronic supplementary information (ESI) available. See DOI: 10.1039/c4ra10563j |
| This journal is © The Royal Society of Chemistry 2015 |

