DOI:
10.1039/C4RA10163D
(Paper)
RSC Adv., 2015,
5, 4109-4120
Photoluminescence, photocatalysis and Judd–Ofelt analysis of Eu3+-activated layered BiOCl phosphors†
Received
10th September 2014
, Accepted 1st December 2014
First published on 2nd December 2014
Abstract
Eu3+-activated layered BiOCl phosphors were synthesized by the conventional solid-state method at relatively low temperature and shorter duration (400 °C for 1 h). All the samples were crystallized in the tetragonal structure with the space group P4/nmm (no. 129). Field emission scanning electron microscopy (FE-SEM) studies confirmed the plate-like morphology. Photoluminescence spectra exhibit characteristic luminescent 5D0 → 7FJ (J = 0–4) intra-4f shell Eu3+ ion transitions. The electric dipole transition located at 620 nm (5D0 → 7F2) was stronger than the magnetic dipole transition located at 594 nm (5D0 → 7F1). The evaluated Commission International de l'Eclairage (CIE) color coordinates of Eu3+-activated BiOCl phosphors were close to the commercial Y2O3:Eu3+ and Y2O2S:Eu3+ red phosphors. Intensity parameters (Ω2, Ω4) and various radiative properties such as transition probability (Atot), radiative lifetime (τrad), stimulated emission cross-section (σe), gain bandwidth (σe × Δλeff) and optical gain (σe × τrad) were calculated using the Judd–Ofelt theory. The experimental decay curves of the 5D0 level in Eu3+-activated BiOCl have a single exponential profile. In comparison with other Eu3+ doped materials, Eu3+-activated BiOCl phosphors have a long lifetime (τexp), low non-radiative relaxation rate (WNR), high quantum efficiency (η) and better optical gain (σe × τrad). The determined radiative properties revealed the usefulness of Eu3+-activated BiOCl in developing red lasers as well as optical display devices. Further, these samples showed efficient photocatalytic activity for the degradation of rhodamine B (RhB) dye under visible light irradiation. These photocatalysts are useful for the removal of toxic and non-biodegradable organic pollutants in water.
1. Introduction
The unique spectroscopic properties of rare-earth ions in different host lattices prompted the development of rare-earth luminescent materials for lamps, cathode ray tubes, radiation monitoring systems, lasers, scintillators, biosensors and white light-emitting diodes (WLEDs).1,2 White light-emitting diodes are potential materials for significantly improving lighting efficiency, resulting in reduction of the excitation energy and also reduction in pollution from fossil fuel power plants.3 The demand for developing efficient luminescent materials such as rare earth activated inorganic compounds has attracted researchers. Due to their possible photonic applications, good luminescent characteristics, stability in high vacuum, biosensors and absence of corrosive gas emission under electron bombardment when compared to currently used sulfide based phosphors. Among all the rare-earth ions, the red emitting trivalent Eu3+-activated phosphors have significant importance because of their potential application in color display and lighting technologies. Trivalent europium ions (Eu3+) activated phosphors were considered to obtain a red-emitting phosphor with proper CIE chromaticity coordinates. This was because the lowest excited level (5D0) of the 4f6 configuration in Eu3+ was situated below the 4f55d configuration. Eu3+ provides a particularly favorable situation for substitution in Bi3+ sites with suitable isostructural replacement. Trivalent europium ions exhibited narrow band emissions, long lifetimes and large Stokes shifts (emission of lower energy radiation upon excitation by higher energy radiation). The intensities and splitting of the spectral lines provide useful information concerning the local site symmetry, sizes of cations and properties of the chemical bonding.4 Eu3+ ions exhibit intense 5D0 → 7F2 emission in the red spectral region at 615 nm, when they occupy the lattice sites without centrosymmetry.
Bismuth oxychloride (BiOCl) belongs to V-VI-VII family, an important ternary phosphor among various inorganic phosphors due to their unique layered structures and high chemical stability.4 Oxyhalides-based phosphors would be advantageous when compared to oxidic hosts due to their low phonon energy, which improved the quantum efficiency of the luminescence. BiOCl compound crystallize in the tetragonal matlockite (PbFCl) structure with [Cl–Bi–O–Bi–Cl] layers stacked together by nonbonding van der Waals interaction through the halogen atoms along c-axis.5 Due to the strong intralayer bonding and weak interlayer van der Waals interaction, BiOCl show promising applications in photocatalysis, pharmaceuticals, battery cathodes, and photoelectrochemical devices.6,7 The internal static electric fields between these layers enable the effective separation of photogenerated electron–hole pairs. Moreover, the electron–hole recombination was prohibited due to the indirect band gap nature of BiOCl where the excited electron in conduction band has to gain the crystal momentum in k-space with the emission or absorption of phonon before annihilating a hole in valence bond radiatively.8 Several methods were employed for the synthesis of BiOCl, namely hydrothermal,9 hydrolysis,10 sonochemical,11 reverse microemulsion,12 microwave4 and chemical vapor deposition7 methods. All these synthesis methods involve several problems, such as high pressure, less yield, lack of composition control, requirement of solvents and long reaction time.
Generally, solid state method offer several advantages over other conventional methods such as mass scale production, higher purity of products, better compositional control and solvent/surfactant free process. As per our knowledge, the spectroscopic properties of Eu3+-activated BiOCl have not been extensively reported so far and need careful examination. In the present study, we employed solid state method to prepare Eu3+-activated BiOCl compounds and reported their structural and optical parameters. The effect of Eu3+ concentration on photoluminescence (PL) properties was investigated. Judd–Ofelt theory was adopted to calculate the intensity parameters and various other radiative properties such as transition probability, radiative life time, quantum efficiency, stimulated emission cross-section, gain bandwidth and optical gain. Further, these compounds were used as photocatalysts for the degradation of rhodamine B (RhB) dye under visible light irradiation.
2. Experimental
2.1. Synthesis
Bi1−xEuxOCl (x = 0, 0.01, 0.03 and 0.05) compounds were synthesized by conventional solid-state method. For the synthesis of host BiOCl, the required amount of Bi2O3 (1.1649 g) and NH4Cl (0.3209 g, 20% excess) were used as the starting materials and were ground finely in an agate mortar with pestle. This mixed powder was transferred into crucible and calcined at 400 °C for 1 h. Similarly, Eu3+-activated BiOCl compounds were synthesized using Bi2O3, Eu2O3 and NH4Cl as the raw materials. The equation for the formation of BiOCl compound was represented by the following reaction:| | |
Bi2O3 + 2NH4Cl → 2BiOCl + 2NH3 + H2O
| (1) |
2.2. Characterization
The crystallinity and phase purity of the samples were examined by powder X-ray diffraction (PANalytical X'Pert Pro Powder diffractometer) using Cu Kα radiation (λ = 1.5418 Å) with a nickel filter. Rietveld refinement data were collected at a scan rate of 1° min−1 with a 0.02° step size for 2θ from 10° to 80°. The structural parameters were estimated by Rietveld refinement method using FullProf Suite-2000 programme. The surface morphology and elemental mapping of these phosphors was investigated using FE-SEM (FEI Sirion). Fourier transform infrared (FTIR) spectra were recorded using Perkin Elmer Spectrometer, Frontier using KBr as a reference. UV-Visible absorption spectra have been recorded for powders on Perkin Elmer Lambda 750 spectrophotometer. Thermogravimetric analysis (TGA) was performed using Mettler-Toledo system in the presence of N2 as a carrier gas upto 900 °C. The PL studies have been carried out using a JobinYvon spectrofluorometer (Fluorolog-3, Horiba) equipped with a 450 W xenon lamp as the excitation source. The photoluminescence (PL) decay lifetime measurements were performed at low temperature (77 K) with a Perkin Elmer spectrofluorimeter. The photocatalytic activity of rhodamine B (RhB) dye solution was analyzed by Perkin Elmer UV-Visible spectrophotometer (Lambda 35) in the range from 200 to 800 nm periodically. All the measurements were performed at room temperature.
2.3. Photocatalytic activity measurement
The photocatalytic activities of Bi1−xEuxOCl compounds were measured by examining the degradation of RhB dye under visible-light irradiation (λ > 420 nm). A 500 W metal halide lamp held at 15 cm from the sample was used as the visible-light source. In each experiment, about 50 mg of photocatalysts was added into 50 mL of RhB solution with a concentration of 5 × 10⁻⁶ M. Prior to Visible illumination, the suspensions were magnetically stirred in the dark for 30 minutes to ensure an adsorption–desorption equilibrium. Then, the stable aqueous dye solution was exposed to visible light for 45 minutes. During the photoreaction, about 3 mL of suspension was collected at different time intervals and centrifuged to remove the catalyst. The transparent solution was analyzed using a UV-Vis spectrophotometer, and the absorbance was measured at a wavelength of 554 nm, which corresponds to the maximum absorption wavelength of RhB. The percentage dye degradation rate was calculated by the following equation:| |
 | (2) |
where C0 is the initial concentration at 0 min and C is the concentration at time t.
3. Results and discussion
3.1. Powder X-ray diffraction (PXRD)
Fig. 1 shows the indexed powder X-ray diffraction patterns for Bi1−xEuxOCl compounds. The sharp intense peaks revealed the crystalline nature of the samples. All diffracted peaks were agreed well with the reported JCPDS Card no. 85-0861. On substitution of smaller Eu3+ ion (rEu3+ = 1.066 Å) to larger Bi3+ ion (rBi3+ = 1.17 Å) upto 5 mol%, we did not see any impurity line of Eu2O3 in the powder XRD patterns. This implies that the Eu3+ substituted to 8-coordinated Bi3+ ion in BiOCl lattice. On substitution of Eu3+ ion, we did not see any appreciable change in the intensity of diffracted lines. The structural parameters were refined from the Rietveld method using powder XRD data. The refinement results confirmed that all the samples were crystallized in the tetragonal phase with space group P4/nmm (no. 129) and the structural parameters were summarized in Table 1. It was noted that there was no appreciable change in the lattice parameters or cell volume upto 5 mol% substitution of Eu3+ ion. Observed, calculated and the difference XRD pattern of Bi0.97Eu0.03OCl compound is shown in Fig. 2a. The crystal structure of BiOCl was modeled using Rietveld refined structural parameters by VESTA program (Fig. 2b). In the BiOCl structure, the Bi3+ atom was coordinated to a square antiprism with four O atoms in one base and four Cl atoms in another base. The BiOCl layers were stacked over one another by the nonbonding van der Waals interaction through chloride atoms along the c-axis. The interplanar lattice spacing between two bismuth ions in BiOCl layers was found to be 4.85 Å.
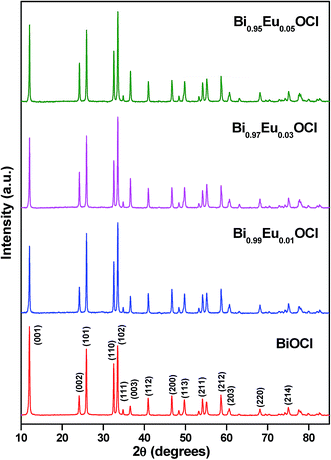 |
| | Fig. 1 XRD patterns of Bi1−xEuxOCl compounds. | |
Table 1 Rietveld refined structural parameters for Bi1−xEuxOCl compounds
| Compounds |
BiOCl |
Bi0.99Eu0.01OCl |
Bi0.97Eu0.03OCl |
Bi0.95Eu0.05OCl |
| Crystal system |
Tetragonal |
Tetragonal |
Tetragonal |
Tetragonal |
| Space group |
P4/nmm (no. 129) |
P4/nmm (no. 129) |
P4/nmm (no. 129) |
P4/nmm (no. 129) |
![[thin space (1/6-em)]](https://www.rsc.org/images/entities/char_2009.gif) |
| Lattice parameters |
| a (Å) |
3.893(2) |
3.894(2) |
3.895(3) |
3.895(2) |
| c (Å) |
7.366(3) |
7.374(3) |
7.372(7) |
7.371(5) |
| Cell volume (Å3) |
111.63(8) |
111.81(3) |
111.85(2) |
111.82(1) |
![[thin space (1/6-em)]](https://www.rsc.org/images/entities/char_2009.gif) |
| Atomic positions |
| Bi/Eu (2c) |
| x |
0.2500 |
0.2500 |
0.2500 |
0.2500 |
| y |
0.2500 |
0.2500 |
0.2500 |
0.2500 |
| z |
0.1707(2) |
0.1703(3) |
0.1704(7) |
0.1703(5) |
![[thin space (1/6-em)]](https://www.rsc.org/images/entities/char_2009.gif) |
| O (2a) |
| x |
0.2500 |
0.2500 |
0.2500 |
0.2500 |
| y |
0.7500 |
0.7500 |
0.7500 |
0.7500 |
| z |
0.0000 |
0.0000 |
0.0000 |
0.0000 |
![[thin space (1/6-em)]](https://www.rsc.org/images/entities/char_2009.gif) |
| Cl (2c) |
| X |
0.2500 |
0.2500 |
0.2500 |
0.2500 |
| Y |
0.2500 |
0.2500 |
0.2500 |
0.2500 |
| z |
0.6447(9) |
0.6560(8) |
0.6479(5) |
0.6535(5) |
![[thin space (1/6-em)]](https://www.rsc.org/images/entities/char_2009.gif) |
| Rfactors (%) |
| Rp |
0.103 |
0.127 |
0.124 |
0.118 |
| Rwp |
0.141 |
0.168 |
0.171 |
0.160 |
| Rexp |
0.119 |
0.135 |
0.156 |
0.148 |
| χ2 |
0.013 |
0.016 |
0.012 |
0.012 |
| RBragg |
0.056 |
0.087 |
0.065 |
0.064 |
| RF |
0.035 |
0.065 |
0.050 |
0.047 |
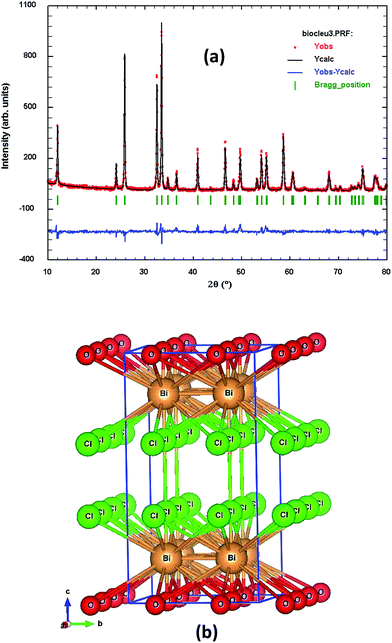 |
| | Fig. 2 (a) Observed, calculated and the difference XRD patterns of Bi0.97Eu0.03OCl and (b) crystal structure of BiOCl compound. | |
3.2. Field emission scanning electron microscopy (FE-SEM) analysis
Fig. 3 shows FE-SEM images of BiOCl and Bi0.95Eu0.05OCl compounds. The micrographs revealed the plate-like morphology. Similar morphology was obtained by Wang et al.6 using hydrolysis method and Li et al.9 via hydrothermal route. The thickness of the plates in both compounds was found in the range of 0.116–0.140 μm. To confirm the homogeneity of elements in the compounds, we have carried out the elemental mapping using energy dispersive X-ray (EDX) analysis. Fig. 4 shows the elemental mapping of (a) BiOCl and (b) Bi0.95Eu0.05OCl compounds. The elemental mapping of BiOCl confirmed that all the elements were homogeneously distributed over the entire area. For 5 mol% Eu3+doping, although the concentration of Eu was low and therefore faintly visible but was evenly distributed.
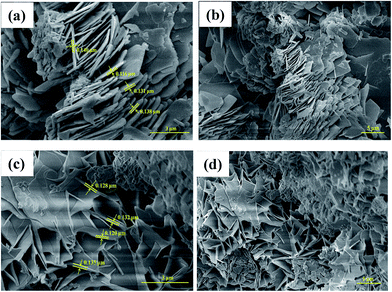 |
| | Fig. 3 FESEM micrographs of (a and b) BiOCl and (c and d) Bi0.95Eu0.05OCl compounds. | |
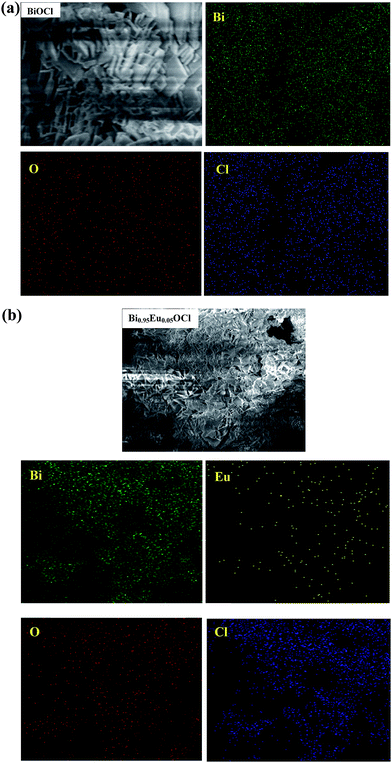 |
| | Fig. 4 Elemental mapping of (a) BiOCl and (b) Bi0.95Eu0.05OCl compounds. | |
3.3. Fourier transform infrared (FTIR) studies
The purity and functional groups of all the compounds were confirmed by the FTIR spectra (Fig. 5). All the samples show absorption peak at 524 cm−1 which was attributed to the characteristic symmetrical stretching vibration of the Bi–O bond. Further, we did not observe any additional bands which confirm that all the compounds were pure phase.
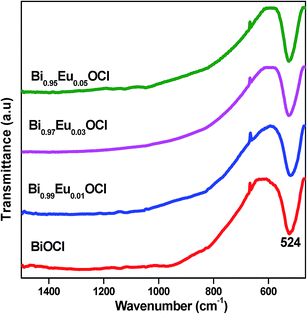 |
| | Fig. 5 FTIR spectra of Bi1−xEuxOCl compounds. | |
3.4. UV-vis absorption spectroscopy
Fig. 6a illustrates the UV-Vis absorption spectra of Bi1−xEuxOCl compounds. A red shift was observed in the absorption edge with increasing Eu3+ concentration in BiOCl. The optical energy band gap (Eg) was estimated from these absorption spectra using Wood and Tauc relation.13 The energy band gap was calculated with absorbance and photon energy by the following equation:where α is the absorption coefficient, hν is the photon energy, A is a proportional constant, Eg is the energy band gap and n depends on the characteristics of the transition in a semiconductor. (n = 1/2, 2, 3/2, or 3 for allowed direct, allowed indirect, forbidden direct, and forbidden indirect electronic transitions, respectively). BiOCl exhibits an optical absorption spectrum governed by indirect electronic transitions (n = 2).14 The intercept of the tangent to the x-axis gives good approximation of the band gap energies of Bi1−xEuxOCl compounds. The energy band gaps for BiOCl, Bi0.99Eu0.01OCl, Bi0.97Eu0.03OCl and Bi0.95Eu0.05OCl were found to be 2.92 (±0.0031), 2.90 (±0.0026), 2.88 (±0.0024) and 2.86 (±0.0017) eV, respectively (Fig. 6b). The obtained band gap energy values were comparable with the reported literature.15 On substitution of smaller Eu3+ ion (rEu3+ = 1.066 Å) to larger Bi3+ ion (rBi3+ = 1.17 Å), the band gap values decrease. The influence of Eu3+ on the electronic structure of the host material was investigated by calculating the positions of the conduction band (CB) and valence band (VB) edges using the equation:where ECB is the CB edge of the compound at the point of zero charge, X is the absolute electronegativity of the compound (6.34 eV), EC is the energy of free electrons on the hydrogen scale (∼4.5 eV) and Eg is the band gap energy of the compound. The calculated bottom of the CBs and top of the VBs of Bi1−xEuxOCl compounds are listed in Table 2. The band gap structures for Bi1−xEuxOCl compounds are shown in Fig. 6c. As can be seen, the VB edge potential of Bi1−xEuxOCl decreases from 3.30 to 3.27 eV due to the smaller ionic radii of Eu3+ ion in the BiOCl lattice.
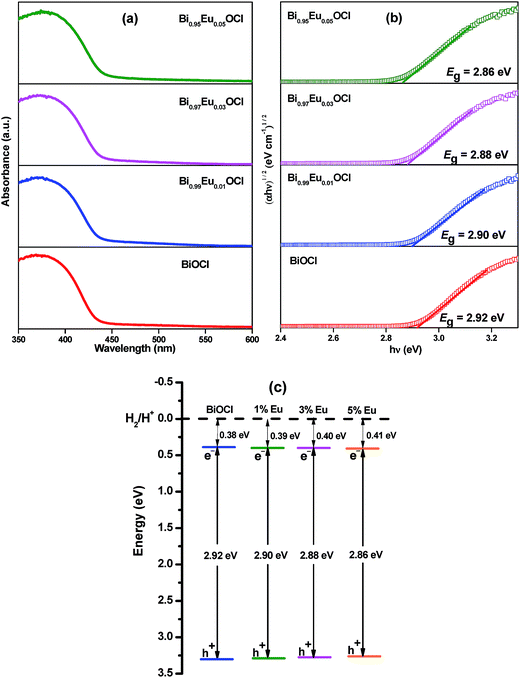 |
| | Fig. 6 (a) UV-Vis absorption spectra, (b) plots of (αhν)1/2 vs. hν and (c) band gap structures for Bi1−xEuxOCl compounds. | |
Table 2 Absolute electronegativity, calculated CB edge, calculated VB position and band gap energy for Bi1−xEuxOCl compounds
| Compounds |
Absolute electronegativity X (eV) |
Calculated CB position (eV) |
Calculated VB position (eV) |
Band gap energy, Eg (eV) |
| BiOCl |
6.34 |
0.38 |
3.30 |
2.92 |
| Bi0.99Eu0.01OCl |
6.34 |
0.39 |
3.29 |
2.90 |
| Bi0.97Eu0.03OCl |
6.34 |
0.40 |
3.28 |
2.88 |
| Bi0.95Eu0.05OCl |
6.34 |
0.41 |
3.27 |
2.86 |
3.5. Thermogravimetric analysis (TGA)
Thermogravimetric analysis was used to evaluate the stability of BiOCl compound. Fig. S1† shows that no significant weight loss was observed upto 590 °C. This confirms that the BiOCl compound was stable. Above 590 °C, a drastic weight loss around 12% was observed in the range of 590 to 780 °C due to the decomposition of BiOCl into bismuth oxide and chlorine gas. Further, the decomposition of bismuth oxide was started above 780 °C.
3.6. Photoluminescence (PL) properties
In Fig. 7a, an excitation spectrum was presented for Bi0.99Eu0.01OCl phosphor recorded at λem = 620 nm. A broad excitation peak at 350 nm (7F0 → 5D4) was observed and this band was due to the Eu3+–O2− charge transfer (CT) which arises from the transition of 2p electrons of O2− to the empty 4f orbitals of Eu3+ ions. The peak at 394 was observed which correspond to 7F0 → 5D3 transition of Eu3+. The excitation spectrum shows a peak at 466 nm (7F0 → 5D2) due to the intra-4f transitions of Eu3+ ions in the host lattice.4 The emission spectra obtained for Eu3+-activated BiOCl phosphors under the visible excitation (466 nm) displayed the typical emissions in the 570–720 nm region (Fig. 7b). The sharp peaks in the emission spectra were correspond to the electronic transitions as 5D0 → 7F0 (580 nm), 5D0 → 7F1 (594 nm), 5D0 → 7F2 (612, 620 nm), 5D0 → 7F3 (651 nm) and 5D0 → 7F4 (698 nm). Fig. S2† depicts the energy level diagram for Eu3+-activated BiOCl phosphors. The presence of unique emission line at 580 nm was due to the J–J mixing by the crystal field effects.16 The 5D0 → 7F1 transition peak originates from magnetic dipole transition. In contrast, the radiative transitions from 5D0 to 7F2 and 7F4 levels were electric dipole in character.16,17 The 5D0 → 7F3 transition was forbidden from both electric and magnetic dipole considerations. It can also be observed that the relative emission intensity of 5D0 → 7F2 transition was higher than 5D0 → 7F1 transition. This was normally associated with Eu3+ ions occupying crystallographic sites without an inversion center.16 The relative intensities of the emissions fall in the order 5D0 → 7F2 > 7F4 > 7F1 > 7F0 > 7F3 for all Eu3+-activated BiOCl phosphors (Fig. S3†). Additionally, it was worth noting that the emission intensities increase with the increase in Eu3+ doping concentration from 1 to 5 mol%. The splitting of 5D0 → 7F2 peak was due to the composition, coordination environment and crystal field symmetry.18
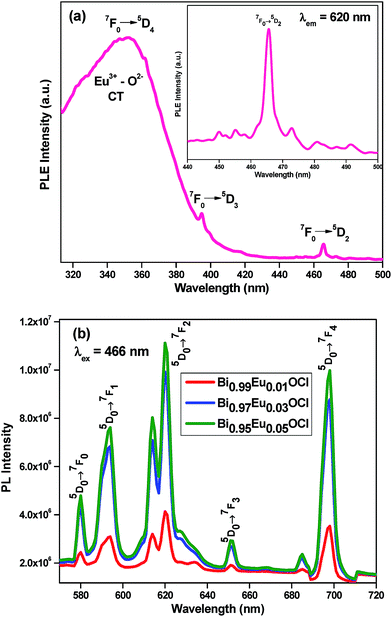 |
| | Fig. 7 (a) Excitation spectra of Bi0.99Eu0.01OCl phosphor (inset shows the magnified view of excitation spectra) and (b) emission spectra of Bi1−xEux OCl phosphors. | |
For practical lighting applications, color quality was specified in terms of 1931 Commission International de l'Eclairage (CIE) chromaticity color coordinates. These color coordinates recognize that the human visual system uses three primary colors: red, green and blue.19 In general, the color of any light source can be represented on the (x, y) coordinates in this color space. To characterize the luminescence of Bi1−xEuxOCl materials under visible excitation (466 nm), the CIE coordinates were calculated using the color calculator program radiant imaging.20 Fig. 8 shows the CIE 1931 chromaticity diagram of Bi1−xEuxOCl phosphors. The calculated CIE color coordinates of Bi1−xEuxOCl (x = 0.01, 0.03 and 0.05) phosphors were found to be (0.6193, 0.3802), (0.6322, 0.3653) and (0.6371, 0.3615), respectively. The evaluated color coordinates for Bi0.95Eu0.05OCl phosphor was close to the commercial Y2O3:Eu3+ (0.645, 0.347) and Y2O2S:Eu3+ (0.647, 0.343) red phosphors.21 The location of the color coordinates of Eu3+-activated BiOCl on the CIE chromaticity diagram presented in Fig. 8 revealed that the color properties of the phosphor materials can be useful for the production of red component in white LEDs.
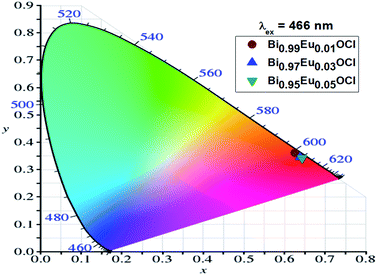 |
| | Fig. 8 CIE 1931 chromaticity diagram of Bi1−xEuxOCl phosphors. | |
3.7. Judd–Ofelt intensity parameters and radiative properties
The PL emission spectrum was further used for the calculation of Judd–Ofelt parameters. The J–O intensity parameters, ΩJ (J = 2, 4) provide an insight into the local structure and bonding in the vicinity of rare earth ions. So the Judd–Ofelt analysis of the PL emission can be used for calculating the parity-forbidden electric-dipole radiative transition rates between the various levels of the rare earth ions.17,22 Through these analyses, the local environment around the metal ion and the bond covalency of metal–ligand bonds can be interpreted. The integrated emission intensities of the spontaneous (radiative) emission of the transition between two manifolds 5D0 and 7FJ (J = 2, 4) were associated with the radiative emission rates and can be written as:| |
 | (5) |
where I0–J and I0–1 are integral intensities for 5D0 → 7FJ and 5D0 → 7F1 transitions and hν0–J and hν0–1 are their energies, respectively. The magnetic dipole radiative emission rate A0–1 has a value of 50 s−1.23 The radiative emission rates A0–J were related to forced electric dipole transitions and they may be written as a function of the J–O intensity parameters:| |
 | (6) |
where χ is the Lorentz local field correction factor given as function of the index of refraction n of the host  . The 〈5D0|U(J)|7F2〉2 are the square reduced matrix elements whose values are independent of the chemical environment of the Eu3+ ion. Their values were known and are 〈5D0|U(2)|7F2〉2 = 0.0032 and 〈5D0|U(4)|7F4〉2 = 0.0023. Thus, using eqn (5) and (6) the values of Ω2,4 were obtained. The calculated Judd–Ofelt parameters have been used to predict some important radiative properties such as radiative transition probability (Arad) and lifetime (τrad).
The radiative transition probability (Arad) can be calculated using the equation below:
| |
 | (7) |
The radiative lifetime τrad of an excited state in terms of Arad, is given by:
| |
 | (8) |
The Judd–Ofelt intensity parameters, radiative transition probability and calculated lifetime of Bi1−xEuxOCl phosphors are displayed in Table 3. The relative intensity of the hypersensitive electric dipole 5D0 → 7F2 transition depends on the local symmetry of the Eu3+ ions. This transition was mainly responsible for the Ω2 value, and it depends on short distance effects. The change of Ω2 parameter was due to distortions around occupied Eu3+ ion sites. The intensity of this transition increases with decreasing local symmetry of the Eu3+ ion. It was observed that the value of Ω2 parameter increases with increase in the Eu3+ concentration. This result reveals the high covalence of the metal–ligand bonds and more distortion of the symmetry of Eu3+ sites in BiOCl matrix.24 The parameter Ω4 was not directly related to the symmetry of the Eu3+ ion but to the electron density on the surrounding ligands. Its value increases with increase in the concentration of Eu3+, indicating the decrease in the electron density on the ligands.
Table 3 Judd–Ofelt intensity parameters (Ω2, Ω4), radiative transition probability (Arad), non-radiative relaxation rate (WNR), total transition probability (Atot), calculated radiative (τrad) lifetime, experimental (τexp) lifetime, quantum efficiency (η) and asymmetry ratio of Bi1−xEuxOCl phosphors
| Eu3+ (mol%) |
J–O intensity parameters (×10−20 cm2) |
Arad (s−1) |
WNR (s−1) |
Atot (s−1) |
τrad (ms) |
τexpa (ms) |
η (%) |
Asymmetry ratio |
| Ω2 |
Ω4 |
| Maximum experimental lifetime error: τexp = 0.0016 ms. |
| 1 |
1.4167 |
0.6861 |
191.98 |
22.19 |
214.17 |
5.21 |
4.67 |
90 |
1.77 |
| 3 |
1.5156 |
0.7454 |
203.05 |
5.95 |
209.00 |
4.92 |
4.78 |
97 |
2.06 |
| 5 |
1.5567 |
0.7506 |
205.68 |
1.71 |
207.39 |
4.86 |
4.82 |
99 |
2.09 |
Asymmetric ratio was used to understand the variation of symmetry and coordination environment around Eu3+ ion doped in BiOCl matrix. The asymmetric ratio is a relative ratio of integrated areas under the peaks of 5D0 → 7F2 and 5D0 → 7F1 transitions.25 In a site with inversion symmetry, the 5D0 → 7F1 transition was dominant while in a site without inversion symmetry, the 5D0 → 7F2 transition dominates. The asymmetric ratios for Bi1−xEuxOCl phosphors increase with increase in Eu3+ concentration (Table 3). This was due to the distortion in symmetry around Eu3+ ion in BiOCl which caused an enhancement in the relative intensity of the hypersensitive electric dipole transition. This indicates strong electric fields of low symmetry at the Eu3+ ions.
Fig. 9 shows the PL decay curve for Bi1−xEuxOCl phosphors measured at low temperature (77 K). The decay curve was monitored for the emission band at 620 nm, corresponding to the 5D0 → 7F2 transition, under the excitation of 466 nm. These PL decay profiles exhibit single exponential behavior and the excited state lifetime was calculated from the slope of the fitting line using the following expression:
where
It and
I0 are the luminescence intensities at time
t and at
t = 0 respectively,
τ is the lifetime of the excited state energy level.
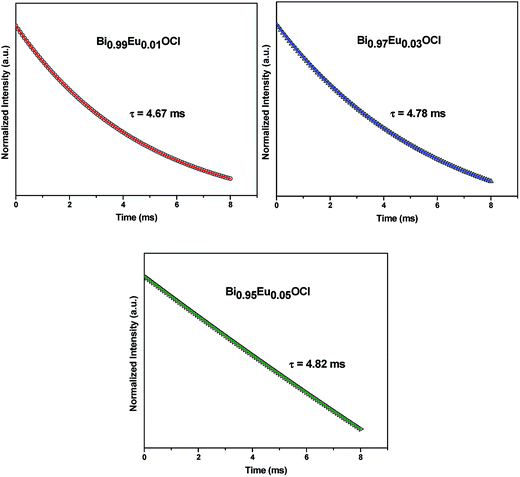 |
| | Fig. 9 Photoluminescence decay curve for the Eu3+-activated BiOCl phosphors measured at 77 K with λex = 466 nm and λem = 620 nm. The dots represent the observed points and the solid line gives its exponential fitting. | |
The experimental lifetime (τexp) values of the 5D0 level of Eu3+ in BiOCl are presented in Table 3. These lifetime values support the increase in luminescence intensity of 5D0 → 7F2 transition in Eu3+-activated BiOCl phosphors. It was obvious that the decay time increases with increase of Eu3+ ion concentration due to the decrease in symmetry around Eu3+ ion.26 It was observed that the experimental lifetime (τexp) values were lower than the calculated radiative lifetime (τrad) values. This was due to the non-radiative relaxation rate (WNR) of the 5D0 energy level of the Eu3+ ions which was determined by the relation:
| |
 | (10) |
The total transition probability is the sum of radiative and non-radiative emission rates. Its value decreases with increase of Eu3+ concentration in BiOCl matrix due to the decrease in symmetry around Eu3+ ion (Table 3). Luminescence quantum efficiency (η) is defined as the ratio of number of photons emitted to the number of photons absorbed. But for the Ln3+ ion system, it is defined as the ratio of the experimental lifetime to the calculated radiative lifetime of the 5D0 level and was measured from the following expression:
| |
 | (11) |
The non-radiative relaxation rate and quantum efficiency of Bi1−xEuxOCl phosphors are shown in Table 3. The calculated WNR values of the present phosphors were less than lead fluorophosphate26 and telluro fluoroborate27 glasses. Table 4 illustrates a comparison of the experimental lifetime and quantum efficiency for 5D0 level of Eu3+ ion in BiOCl along with reported Eu3+ doped different host matrices. As can be seen from Table 4, it was found that the experimental lifetime and quantum efficiency of Bi1−xEuxOCl phosphors were higher than the Eu3+ doped LaOF,28 KLa(PO3)4,29 KLu(WO4)2,30 telluro fluoroborate,27 lead fluorophosphate26 and tellurite31 glass. The quantum efficiency of 99% of 5D0 level suggests the efficiency of the Bi0.95Eu0.05OCl phosphors as a potential host material for red laser applications.
Table 4 Comparison of experimental lifetime (τexp), quantum efficiency (η) of Eu3+ doped different host matrices
| Host matrix |
Eu3+ (mol%) |
τexp (ms) |
η (%) |
Reference |
| BiOCl |
1 |
4.67 |
90 |
Present work |
| 3 |
4.78 |
97 |
Present work |
| 5 |
4.82 |
99 |
Present work |
| LaOF |
0.5 |
1.394 |
95 |
28 |
| 20 |
0.427 |
24 |
28 |
| KLa(PO3)4 |
2 |
3.45 |
66 |
29 |
| 30 |
3.48 |
66 |
29 |
| KLu(WO4)2 |
1 |
0.26 |
— |
30 |
| 1.5 |
0.68 |
— |
30 |
| 3 |
1.04 |
— |
30 |
| 5 |
1.29 |
72 |
30 |
| Telluro fluoroborate glass |
0.05 |
1.452 |
39 |
27 |
| 1 |
1.601 |
63 |
27 |
| Lead fluorophosphate glass |
10 |
2.29 |
86 |
26 |
| Tellurite glass |
0.5 |
0.82 |
64 |
31 |
| 1.5 |
0.88 |
74 |
31 |
The stimulated emission cross-section (σe) is an important factor to predict the laser performance of a material and also the rate of the energy extraction from the lasing material, and was calculated as
| |
 | (12) |
where
λp is the emission peak wavelength,
c is the velocity of light and Δ
λeff is the effective bandwidth of the emission transition.
Some of the radiative properties such as the effective bandwidth of the emission transition (Δλeff), stimulated emission cross-section (σe), gain bandwidth (σe × Δλeff) and optical gain (σe × τexp) for Bi1−xEuxOCl phosphors are displayed in Table 5. The trend of σe for the 5D0 emission transition were observed as 7F2 > 7F4 > 7F1 for Eu3+-activated BiOCl phosphors. The stimulated emission cross-section values of the prepared phosphors for 5D0 → 7F2 transition were found to be better than those reported for Eu3+ doped KLaEu(PO3)4,29 Eu3+ doped ZnAlBiB (ref. 32) and Eu3+ ions in lithium aluminium borophosphate33 glasses. The higher stimulated emission cross section value was an attractive feature for low threshold and high gain laser applications which were used to claim good laser action.29 The product of emission cross-section and the effective bandwidth of the emission transition is a significant parameter to predict the bandwidth of the optical amplifier. The higher the product values were, the better was the amplifiers performance. It was noteworthy that the maximum value of gain bandwidth was 6.20 × 10⁻²⁸ cm3 corresponding to 5D0 → 7F2 transition for Bi0.95Eu0.05OCl phosphor. Similarly, the product of experimental lifetime and stimulated emission cross section is a vital aspect for high optical amplifier gain. The obtained gain bandwidth and optical gain values corresponding to 5D0 → 7F2 transition were found to be larger than Eu3+ doped ZnAlBiB (ref. 32) glass. Therefore, we can conclude that the 5D0 → 7F2 transition (620 nm) provide favorable lasing action, high gain bandwidth and optical gain for amplifiers. The large values of lifetime, stimulated emission cross-section, gain bandwidth and optical gain suggest that the Eu3+-activated BiOCl phosphors can be useful for red laser applications and also for the development of color display devices.
Table 5 Effective bandwidth of the emission transition (Δλeff), stimulated emission cross-section (σe), gain bandwidth (σe × Δλeff) and optical gain (σe × τexp) for Bi1−xEuxOCl phosphors
| Eu3+ (mol%) |
Transitions |
Δλeff (nm) |
σe (×10−22 cm2) |
σe × Δλeff (×10−28 cm3) |
σe × τexp (×10−25 cm2 s−1) |
| 1 |
5D0 → 7F1 |
8.88 |
2.63 |
2.33 |
41.80 |
| 5D0 → 7F2 |
5.66 |
8.95 |
5.06 |
| 5D0 → 7F4 |
5.40 |
7.43 |
4.01 |
| 3 |
5D0 → 7F1 |
7.83 |
2.98 |
2.34 |
45.31 |
| 5D0 → 7F2 |
5.87 |
9.48 |
5.56 |
| 5D0 → 7F4 |
5.20 |
8.26 |
4.29 |
| 5 |
5D0 → 7F1 |
7.96 |
3.12 |
2.48 |
49.40 |
| 5D0 → 7F2 |
6.05 |
10.25 |
6.20 |
| 5D0 → 7F4 |
5.37 |
9.27 |
4.98 |
3.8. Photocatalytic activity
Fig. 10 shows the photocatalytic degradation of RhB dye over Bi1−xEuxOCl catalysts by monitoring the temporal changes of UV-Vis absorbance spectra. A significant reduction in maximum absorption spectra of RhB aqueous solution was verified during the photodegradation process. Before irradiation, the N,N,N′,N′-tetra-ethylated rhodamine molecule, RhB dye, has one band with a maximum absorption centered at λmax = 554 nm. Visible light irradiation of the aqueous RhB/Bi1−xEuxOCl dispersion leads to a decrease in absorption with a concomitant wavelength shift of the band to shorter wavelengths. The blue shift depicted in Fig. 10 was caused by de-ethylation of RhB due to an attack by one of the active oxygen species on the N-ethyl group.34 The shifting of the maximum absorption of RhB dye to other wavelength positions of its major absorption band which moved toward the N,N,N′-tri-ethylated rhodamine (λmax = 539 nm); N,N′-di-ethylated rhodamine, (λmax = 522 nm); N-ethylated rhodamine, (λmax = 510 nm) and rhodamine (λmax = 498 nm) species.35 In the process of photodegradation, the intensity of the main peak reduced gradually to zero at 45 min (BiOCl), 40 min (Bi0.99Eu0.01OCl), 35 min (Bi0.97Eu0.03OCl) and 30 min (Bi0.95Eu0.05OCl). This revealed that the molecular structure of RhB was decomposed to yield environmental friendly species. Fig. 11a shows the percentage of dye degradation after irradiation for different times. When the reaction was performed under dark for 30 min, we observed 42%, 44%, 48% and 51% RhB dye degradation for Bi1−xEuxOCl (x = 0, 0.01, 0.03 and 0.05) catalysts, respectively. This shows that the Bi0.95Eu0.05OCl catalyst has good adsorption capacity. Under visible illumination, the 100% RhB dye was decomposed within 45, 40, 35 and 30 min for Bi1−xEuxOCl (x = 0, 0.01, 0.03 and 0.05) catalysts, respectively.
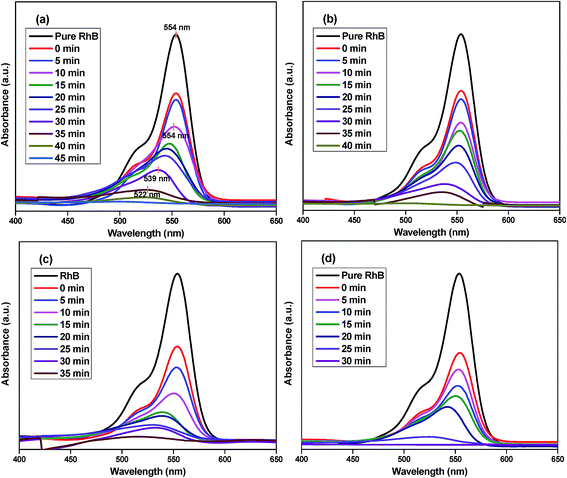 |
| | Fig. 10 UV-Vis absorbance spectra of RhB dye as a function of time over (a) BiOCl, (b) Bi0.99Eu0.01OCl, (c) Bi0.97Eu0.03OCl and (d) Bi0.95Eu0.05OCl catalysts under visible illumination. | |
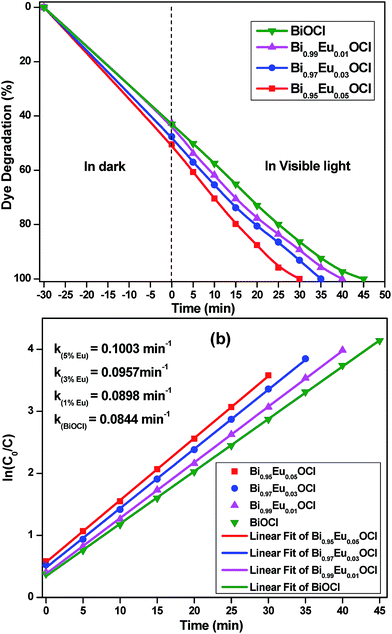 |
| | Fig. 11 (a) Percentage of RhB dye degradation and (b) first order kinetics of dye degradation over Bi1−xEuxOCl catalysts as a function of irradiation time. | |
To prove the efficiency of Bi1−xEuxOCl catalysts with the possibility for future industrial applications, the reaction kinetics was evaluated. The kinetics of RhB degradation reaction under visible light is presented in Fig. 11b, which follows apparent first order kinetics in agreement with a general Langmuir–Hinshelwood mechanism36
| |
 | (13) |
where
R is the degradation rate of reactant (mg L
−1 min
−1),
C is the concentration of reactant (mg L
−1),
t is the illumination time,
K is the adsorption coefficient of reactant (L mg
−1) and
k is the reaction rate constant. If
C is very small then the above equation could be simplified to
| |
 | (14) |
where
C0 is the initial concentration (0 min) of the RhB aqueous solution and
C is the concentration of the RhB aqueous solution for different times of visible illumination.
According to eqn (14), if ln(C0/C) was plotted as a function of t, a straight line was observed, whose slope is equal to the apparent first-order rate constant kapp which were calculated to be 0.0844, 0.0898, 0.0957 and 0.1003 min−1 for Bi1−xEuxOCl (x = 0, 0.01, 0.03 and 0.05) catalysts, respectively. These values substantiate the photocatalytic reaction rate being highest for Bi0.95Eu0.05OCl catalyst. Further, the rate constants increase with increase in Eu3+ concentration for Bi1−xEuxOCl catalysts. This was due to the decrease in band gap energy values with Eu3+ doping concentration. The indirect optical transition and layered structure of BiOCl play an important role in its excellent photocatalytic activity. In indirect transition, an excited electron has to travel certain k-space distance to reach valence band. This reduces the recombination probability of the excited electron and the hole. The layered structure of BiOCl can polarize the related atoms and orbitals by supporting large enough space,10 resulting in an increase in the electron–hole separation efficiency through the appeared dipole, and thus the enhanced photocatalytic activity was observed.
4. Conclusions
Layered Bi1−xEuxOCl compounds were prepared by conventional solid-state method at relatively low temperature. Rietveld refinement results confirmed that these compounds have a tetragonal structure. Based on the CIE chromaticity diagram, the Eu3+-activated BiOCl phosphors exhibit red luminescence under visible excitation. In order to investigate the nature of the luminescence behavior of Eu3+ in BiOCl, the Judd–Ofelt intensity parameters were calculated from the emission data. The J–O intensity parameters increase with the increase in Eu3+ concentration which reveals the high covalence of the metal–ligand bonds and more distortion of the symmetry of Eu3+ sites in BiOCl matrix. The high asymmetric ratio confirmed that the Eu3+ ions locate at sites with low symmetry and without an inversion center. The present Eu3+-activated BiOCl phosphors show higher lifetime, quantum efficiency, stimulated emission cross-section, gain bandwidth and optical gain parameters for 5D0 → 7F2 transition in comparison with different host matrix such as oxides and glasses. We achieved 100% RhB dye degradation using Bi1−xEuxOCl (x = 0, 0.01, 0.03 and 0.05) catalysts within 45, 40, 35 and 30 min under visible illumination. The apparent first-order rate constant was found to be in the decreasing order of Bi0.95Eu0.05OCl > Bi0.97Eu0.03OCl > Bi0.99Eu0.01OCl > BiOCl which followed the 1st order kinetic mechanism. The high efficiency was ascribed to their indirect band gap, layered structure and ability to utilize broad bands in the solar spectrum. The present work provides an effective and economic material ideal for developing red component in white LEDs, red lasers and environment remedy applications.
Acknowledgements
Authors are thankful to DST-IRHPA for FESEM and EDX facility. One of the author R. Saraf would like to thank Indian Academy of Sciences for awarding summer research fellowship 2014.
References
- S. Cho, R. Lee, H. Lee, J. Kim, C. Moon, S. Nam and J. Park, J. Sol-Gel Sci. Technol., 2010, 53, 171 CrossRef CAS
 .
. - J. Wang, Y. Xu, M. Hojamberdiev, J. Peng and G. Zhu, J. Non-Cryst. Solids, 2009, 355, 903 CrossRef CAS PubMed
 .
. - G. G. Li, D. L. Geng, M. M. Shang, Y. Zhang, C. Peng, Z. Y. Cheng and J. Lin, J. Phys. Chem. C, 2011, 115, 21882 CAS
 .
. - A. Dash, S. Sarkar, V. N. Adusumalli and V. Mahalingam, Langmuir, 2014, 30, 1401 CrossRef CAS PubMed
 .
. - X. Zhang, Z. Ai, F. Jia and L. Zhang, J. Phys. Chem. C, 2008, 112, 747 CAS
 .
. - Q. Wang, J. Hui, Y. Huang, Y. Ding, Y. Cai, S. Yin, Z. Li and B. Su, Mater. Sci. Semicond. Process., 2014, 17, 87 CrossRef CAS PubMed
 .
. - H. L. Peng, C. K. Chan, S. Meister, X. F. Zhang and Y. Cui, Chem. Mater., 2009, 21, 247 CrossRef CAS
 .
. - W. L. Huang and Q. Zhu, J. Comput. Chem., 2009, 30, 183 CrossRef CAS PubMed
 .
. - D. K. Li, L. Z. Pei, Y. Yang, Y. Q. Pei, Y. K. Xie and Q. F. Zhang, e-J. Surf. Sci. Nanotechnol., 2012, 10, 161 CrossRef CAS
 .
. - K. L. Zhang, C. M. Liu, F. Q. Huang, W. D. Wang and J. L. Shi, Appl. Catal., B, 2006, 68, 125 CrossRef CAS PubMed
 .
. - Y. Q. Lei, G. H. Wang, S. Y. Song, W. Q. Fan and H. J. Zhang, CrystEngComm, 2009, 11, 1857 RSC
 .
. - J. Henle, P. Simon, A. Frenzel, S. Scholz and S. Kaskel, Chem. Mater., 2007, 19, 366 CrossRef CAS
 .
. - J. Tauc, Optical Properties of Solids, North-Holland, Amsterdam, 1970 Search PubMed
 .
. - W. L. Huang and Q. Zhu, Comput. Mater. Sci., 2008, 43, 1101 CrossRef CAS PubMed
 .
. - L. Chen, S. F. Yin, R. Huang, Y. Zhou, S. L. Luo and C. T. Au, Catal. Commun., 2012, 23, 54 CrossRef CAS PubMed
 .
. - Y. Hui, Y. Zhao, S. Zhao, L. Gu, X. Fan, L. Zhu, B. Zou, Y. Wang and X. Cao, J. Alloys Compd., 2013, 573, 177 CrossRef CAS PubMed
 .
. - G. S. Ofelt, J. Chem. Phys., 1962, 37, 511 CrossRef CAS PubMed
 .
. - R. Saraf, C. Shivakumara, N. Dhananjaya, S. Behera and H. Nagabhushana, J. Mater. Sci., 2015, 50, 287 CrossRef CAS
 .
. - S. Shionoya and W. M. Yen, Phosphor Handbook, Phosphor Research Society, CRC Press, 1998 Search PubMed
 .
. - Color calculator version 2, A software from, Radiant Imaging, Inc, 2007 Search PubMed
 .
. - C. H. Huang, T. W. Kuo and T. M. Chen, Opt. Express, 2011, 19, A1 CrossRef CAS PubMed
 .
. - B. R. Judd, Phys. Rev., 1962, 127, 750 CrossRef CAS
 .
. - G. F. de Sá, O. L. Malta, C. M. Donegá, A. M. Simas, R. L. Longo, P. A. Santa-Cruz and E. F. da Silva, Coord. Chem. Rev., 2000, 196, 165 CrossRef
 .
. - R. Reisfeld, E. Zigansky and M. Gaft, Mol. Phys., 2004, 102, 1319 CrossRef CAS
 .
. - A. M. Cross, P. S. May, F. C. J. M. van Veggel and M. T. Berry, J. Phys. Chem. C, 2010, 114, 14740 CAS
 .
. - C. R. Kesavulu, K. K. Kumar, N. Vijaya, K. S. Lim and C. K. Jayasankar, Mater. Chem. Phys., 2013, 141, 903 CrossRef CAS PubMed
 .
. - R. Vijayakumar, K. Maheshvaran, V. Sudarsan and K. Marimuthu, J. Lumin., 2014, 154, 160 CrossRef CAS PubMed
 .
. - T. Grzyb and S. Lis, Inorg. Chem., 2011, 50, 8112 CrossRef CAS PubMed
 .
. - M. Ferhi, C. Bouzidi, K. H. Naifer, H. Elhouichet and M. Ferid, J. Lumin., 2015, 157, 21 CrossRef CAS PubMed
 .
. - M. C. Pujol, J. J. Carvajal, X. Mateos, R. Sole, J. Massons, M. Aguilo and F. Diaz, J. Lumin., 2013, 138, 77 CrossRef CAS PubMed
 .
. - W. Stambouli, H. Elhouichet, B. Gelloz and M. Ferid, J. Lumin., 2013, 138, 201 CrossRef CAS PubMed
 .
. - K. Swapna, S. Mahamuda, A. S. Rao, T. Sasikala, P. Packiyaraj, L. R. Moorthy and G. V. Prakash, J. Lumin., 2014, 156, 80 CrossRef CAS PubMed
 .
. - P. S. Wong, M. H. Wan, R. Hussin, H. O. Lintang and S. Endud, J. Rare Earths, 2014, 32, 585 CrossRef CAS
 .
. - Y. Zhao, C. Li, X. Liu and F. Gu, J. Alloys Compd., 2007, 440, 281 CrossRef CAS PubMed
 .
. - T. Wu, G. Liu, J. Zhao, H. Hidaka and N. Serpone, J. Phys. Chem. B, 1998, 102, 5845 CrossRef CAS
 .
. - D. F. Ollis, J. Phys. Chem. B, 2005, 109, 2439 CrossRef CAS PubMed
 .
.
Footnote |
| † Electronic supplementary information (ESI) available. See DOI: 10.1039/c4ra10163d |
|
| This journal is © The Royal Society of Chemistry 2015 |
Click here to see how this site uses Cookies. View our privacy policy here. 
![[thin space (1/6-em)]](https://www.rsc.org/images/entities/char_2009.gif)
![[thin space (1/6-em)]](https://www.rsc.org/images/entities/char_2009.gif)
![[thin space (1/6-em)]](https://www.rsc.org/images/entities/char_2009.gif)
![[thin space (1/6-em)]](https://www.rsc.org/images/entities/char_2009.gif)
![[thin space (1/6-em)]](https://www.rsc.org/images/entities/char_2009.gif)


 . The 〈5D0|U(J)|7F2〉2 are the square reduced matrix elements whose values are independent of the chemical environment of the Eu3+ ion. Their values were known and are 〈5D0|U(2)|7F2〉2 = 0.0032 and 〈5D0|U(4)|7F4〉2 = 0.0023. Thus, using eqn (5) and (6) the values of Ω2,4 were obtained. The calculated Judd–Ofelt parameters have been used to predict some important radiative properties such as radiative transition probability (Arad) and lifetime (τrad).


.
.
.
.
.
.
.
.
.
.
.
.
.
.
.
.
.
.
.
.
.
.
.
.
.
.
.
.
.
.
.
.
.
.
.
.


