Kinetic Monte Carlo simulations of the assembly of filamentous biomacromolecules by the dimer addition mechanism

Tianzhi Luo*a and Douglas N. Robinson*ab
aDepartment of Cell Biology, School of Medicine, Johns Hopkins University, Baltimore, MD 21205, USA. E-mail: tzluo@jhu.edu
bDepartment of Chemical and Biomolecular Engineering, Whiting School of Engineering, Johns Hopkins University, Baltimore, MD 21218, USA. E-mail: dnr@jhmi.edu

Received 24th August 2014 , Accepted 4th December 2014

First published on 5th December 2014


Abstract

In cells, several important biomacromolecules form oligomers through a dimer addition mechanism. Rate equations based on mean field approximations are usually employed to describe the assembly process. However, such equations often require multiple assumptions that mask some detailed changes of the biomolecular configurations during aggregations. Here, we present a kinetic Monte Carlo simulation scheme to account for the diffusion and rotation of dimers on two-dimensional hexagonal lattices while naturally including the stochastic features. We investigate the effects of the interaction energy between dimers, the diffusion coefficient and the concentration of dimers on the aggregation by dimer addition mechanism. Our simulations identified unusual double-S shape evolutions of aggregation kinetics, which are probably associated with the formation of metastable clusters.

Introduction

Protein aggregation is critical for many physiology processes while undesired clustering of proteins is usually associated with many diseases. For example, aggregation of amyloid fibrils leads to Alzheimer's disease and type II diabetes;1,2 over-assembly of myosin II results in reduced fidelity of cytokinesis.3,4 The aggregation of monomeric proteins and particles has been investigated for many years. Scaling laws have been identified for the dynamics of both diffusion-limited and reaction-limited clustering of spherical particles.5–7 Over the past few years, a significant amount of effort has been paid to the investigations of the assembly of non-spherical particles and colloids with a variety of shapes, including biomacromolecules such as myosin II, driven by general and more fundamental principles.8 However, the kinetics of these assemblies displayed unusual features and the understanding of the kinetics is still far from complete. Specifically, these particles and colloids have complex surfaces for interactions and some of the assemblies do not from through monomer addition but rather through some uncommon mechanisms, such as dimer addition.

Among these non-spherical particles and colloids, biomacromolecules such as myosin II, keratin and vimentin are particularly of interest for biomedical researchers as these proteins govern the mechanical properties of cells.9–12 More importantly, these proteins assemble into oligomers using a dimer addition mechanism that that remains poorly understood largely because of the difficulty in acquiring structure and detailed kinetic information about such large ensembles (Fig. S1).13–19 It is believed that the dimer addition mechanism produces oligomers of size 2i (i = 1, 2, 3…) since the basic building blocks are dimers. In the past few decades, several attempts have been made to model the kinetics of assembly of proteins through the dimer addition scheme by solving differential equations where reaction-limit was implicitly assumed.20–22 These equations were used to analyze experimentally observed oligomer fractions in the assembly assays by fitting the reaction rates to experimental data and provided many insights. For instance, the sensitivity analysis of the parameters used in these equations allows the detection of the most sensitive reactions as well as the critical cluster size for aggregations.21,22 Despite the great progress reported in previous studies, several limitations are inherently associated with this kind of analysis. One limitation of this type of analysis is that it only works for the situations of highly concentrated biomacromolecules where diffusion processes are faster than reactions because the molecules are able to collide with each other without traveling long distances. However, some experiments indeed were conducted in the low concentration range where the time for collision through diffusion was on the order close to that of the assembly reactions. Therefore, it is questionable whether such an analysis can be readily applied to the experimental data obtained from the low concentration assays. Another limitation of this type analysis is that it ignores the stochastic nature of assembly reactions, i.e., the system noise due to thermal fluctuations and configuration complexity associated which is inherent with multi-dimensionality. Moreover, boundary conditions that cannot be directly obtained from experiments have to be artificially added during the analysis.21–23

Growing attention paid to the nanometer-scale phenomena suggests that stochastic methods should be developed to dissect the details of the assembly reactions that occur through the dimer addition mechanism while most current theoretical methods for the aggregation of biomacromolecules lack the abilities to resolve the issues mentioned above. Among many numerical simulation methods, the kinetic Monte Carlo (KMC) scheme is able to overcome many of these challenges and can complete the simulations in a reasonable amount of time. Additionally, KMC simulations can cover the whole dynamics spectrum from the diffusion-limited extreme to the reaction-limit extreme. In physics and materials science, the KMC simulation method has been commonly used as a powerful simulation tool for understanding nucleation and growth phenomena at nano and atomic scales. Numerical simulations have been conducted with the KMC method to investigate the effects of concentration, electric potential, and temperature on the nucleation and aggregation processes.5,24–31 Moreover, various Monte Carlo simulations have been used to study the aggregation of polymers and biomacromolecules.19,32–38 In these studies, the values of empirical model parameters were obtained by fitting the experimental results. Yet, KMC simulations based on dimer addition mechanism have not been reported.

Filamentous proteins, such as myosin II, keratin and vimentin form closed-packed aggregations in cells through the dimer addition mechanism. Myosins form thick filaments by stacking their tail domains.14,16 Keratins and vimentins assemble into bundles through head-to-tail association.39,40 As the length of these filamentous proteins (several hundred nanometers) is much larger than the size of their diameters (a few nanometers), the assembly process by the interaction between lateral surfaces can be considered as a two-dimensional (2D) problem where the normal direction of the 2D plane is parallel to the axis of the filamentous proteins.41 Considering the closed-packed configurations, we aim to investigate the aggregation of filamentous proteins through dimer addition that can be simplified on 2D hexagonal lattices.

In this work, a coarse-grained KMC approach has been used to simulate the dynamics of the aggregation of filamentous biomacromolecules through a dimer addition mechanism. The kinetics of the aggregations were investigated on 2D hexagonal lattices by varying the interaction energy between dimers, the diffusion coefficient, and the concentration of dimers. The statistical outputs of the kinetics revealed the emergence of unstable clusters during aggregations. The increased interaction energy and diffusion coefficient led to reduced cluster size whereas high concentration of molecules favored the formation of larger clusters. The KMC scheme presented here could be used for the investigations of more complex cases.

Coarse-grained KMC simulations

The simulation scheme considers an idealized system in order to focus on two important processes: the aggregation and the diffusion of dimeric molecules. For filamentous dimers, only the lateral interactions are considered such that the aggregation of the dimers can be simplified into a 2D problem. Specifically, the closed-packed configuration of aggregated clusters observed in experiments allows the simulations of the aggregation on 2D hexagonal lattices where each dimer resides in two neighboring lattice sites.

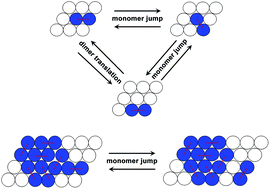
The dimers are permitted to diffuse on the 2D hexagonal lattices through either the movement of one of its monomer or the translational motion of the whole dimer as shown in Fig. 1a. The diffusion rate of the latter is assumed to be half of the former. Namely, rmonodiff = 2rdimdiff where the superscripts “mono” and “dim” refer to monomer and dimer, respectively. The reasoning is based on the Stokes–Einstein relation where the moving speed of an object is inversely proportional to its effective size perpendicular to its moving direction. During monomer movement, the monomer can only hop into two possible neighboring sites since the other monomer in the same dimer is fixed. As to the translation motion of the dimer, there are four possible positions it can move into. During aggregation, a dimer is considered to join an existing cluster once one of its monomer takes over one of the neighboring lattice sites of that cluster through monomer movement as well as dimer translation (Fig. 1b). For simplicity, there is no specific energy barrier for the association of a dimer to an oligomeric cluster. On the other hand, the disassociation (detachment) of a dimer from a cluster is assumed to occur only through monomer movement but not dimer translation because the corresponding energy barrier is at least doubled and the algorithm is more complex. The activation energy for disassociation is assumed to be proportional to the number of near-neighbor bonds that have to be broken, an assumption used in a wide variety of models in chemical and physical systems. The off-rate (detachment rate) associated with monomer movement is

 
image file: c4ra09189b-t1.tif(1)
where Γoff is the frequency of detachment events, Einter is the interaction energy between monomers in different dimers, i loops over the neighboring monomers and kB is the Boltzmann constant. As a dimer gains more nearest neighbors, it becomes more energetically unlikely for the dimer to dissociate. Since the energy barrier for dimer translation is much higher than that of monomer movement, an off-rate due to dimer translation similar to that in eqn (1) is much smaller than the off-rate associated with monomer movement.


image file: c4ra09189b-f1.tif
Fig. 1 Schematic graph of the transport and aggregation process of dimer addition in a kinetic Monte Carlo simulation: (a) example of the dimer diffusion on lattices through either the movement of one of its monomer or the translational motion of the whole dimer; (b) the association and disassociation of a dimer to an existing cluster by the movement of one its monomer. Two monomers in one dimer are connected by a red line.

In the system, 2N particles representing N dimers are randomly seeded in a 2D rectangular window of size L × L. Two-dimensional periodic boundary conditions are applied to avoid any boundary effects. Depending on the neighboring environment, dimers can undergo several transition events, ri, including the diffusion through monomer movement and dimer translation as well as detachment. The N dimers are partitioned over the possible transition events. After the rates of the events are calculated, a list of transition probabilities is constructed in terms of the rates. The individual transition probabilities are

 
image file: c4ra09189b-t2.tif(2)
where ηmax ≥ ∑rk. A sufficiently large system is used to ensure the randomness of the events. The following KMC algorithm is similar to those described previously by others:42–44

(1) Select a random number, r, in the range of (0,1);

(2) choose the transition event from the list by selecting the first index x satisfying the condition image file: c4ra09189b-t3.tif;

(3) execute the event corresponding to rx;

(4) Update all rj events;

(5) advance the time in the simulations by Δτ, where image file: c4ra09189b-t4.tif and ni is the number of transition event with rate ri, the subset of all rates belonging to the ith type event. The computation time was decreased by binning the rates by type. Each time a type of rate is selected first, and an instance of that rate is chosen randomly and executed afterwards.

In general, the rates of most second-order biochemical reactions of proteins inside cells are in the range of 0.1–10.0 μM−1 s−1 (ref. 45 and 46) and the cellular concentrations of proteins are around 1 μM,47,48 which sets the jump frequency Γoff in eqn (1) in the range of 104 ∼ 106 Hz provided that the associated energy barrier ∑Einter is on the order of 10 kBT.49 Similar values were used for the KMC simulations of the interactions of DNA and polymers.32,33 Based on experimentally measured values,50–53 the diffusion coefficients for biomacromolecules inside cells were varied from 0.1 to 10.0 μm2 s−1. For macromolecules such as myosin II, the diffusion coefficient can be as small as 0.8 μm2 s−1.54 As the diameters of myosin II, keratin and vimentin are between 5 and 10 nm, the size of each lattice in KMC simulations was set to 5 nm. Three parameters were varied in KMC simulations, including Einter, rmonodiff and the 2D coverage of the lattice by biomacromolecules, φ.

As the KMC simulations have the power to compute the dynamic process from millisecond up to hours, we monitored the evolutions of the number of clusters N(t), the number average cluster size A(t), the weight average cluster size S(t) and polydispersity P(t) from 10−6 s up to 106 s N(t) is the summation of the number ns(t) of all oligomers of size s, including dimers (s = 1), i.e., N(t) = ∑ns(t). The number average cluster size is A(t) = ∑sns(t)/∑ns(t) while the weight average cluster size is S(t) = ∑s2ns(t)/∑ns(t). The polydispersity is P(t) = ∑A(t)/∑S(t).

Proof tests can ensure that the simulations are independent of the window size and the random seeding process. To investigate the effect of window size, four different window sizes 64 × 64, 128 × 128, 256 × 256, and 512 × 512 were used in the KMC simulations with rmonodiff = 0.1 μm2 s−1 and φ = 0.016 at different Einter. For each lattice size, simulations were carried out until the systems reached the steady-states. Fig. S2 depicts simulation outputs for several characteristic features of the aggregated clusters. The cluster density, the number average cluster size, and the weight average cluster size did not vary appreciably once the simulation window is bigger than 128 × 128 (Fig. S2a–c). Since the 512 × 512 simulations require three times more computational time than the 256 × 256 lattice simulations, and the difference in the outputs of the two lattice sizes was not significant, a 256 × 256 lattice was used in most of the simulations described below.

To test if the random seeding of the dimers has an effect on simulated aggregations, three runs with different random generation approaches were carried out on a 256 × 256 lattice with rmonodiff = 0.1 μm2 s−1 and φ = 0.016 at different Einter. The cluster densities and average cluster sizes from different runs were almost indistinguishable (Fig. S3a and b). The weight average cluster size S(t) only differed slightly in longer simulation time (Fig. S3c). Hence, the simulations results were largely immune to the random number used for the seeding of dimers in the beginning of simulations.

Results and discussion

In this study, we assumed that the energy barrier for the association of a dimer to another dimer or one existing cluster was very small since the mutations in biomacromolecules mostly affect the intermolecular interaction strength that usually governs the dissociation rate, not their configurations for association. Thus, we only considered two critical processes: diffusion and dissociation, which determine the size distribution of aggregates of biomacromolecules. Diffusion tends to narrow down the size distribution whereas system noise broadens the distribution. The mean value of the size distribution at steady-state is mainly determined by the dissociation rate between two dimers.38 Nevertheless, the evolution of the system is largely affected by the diffusion of the basic building blocks, the dimers. Specifically, the time that it takes for a system to reach steady-state depends on the diffusion process. In KMC simulations, the dissociation process was adjusted by varying Einter while diffusion process was tuned by changing rmonodiff. Additionally, different values of coverage φ were also used as the concentration has direct impact on the collision frequency of dimers, which supposedly affects the transport process of dimers. Without further specification, Γoff was assumed to be 106 Hz in most simulations.

Because the disease-associated aggregations of biomacromolecules are usually caused by mutations that change the intermolecular interactions,55–57 we first varied the interaction energy. The statistics of the simulated aggregation for interaction energy Einter at 8, 10, 15, 20, 25 kBT are shown in Fig. 2. The maximum simulation time was up to 108 s. In the simulations, the number of clusters N(t) underwent a fast decay after an initial lag phase and approached a steady-state. As for the cases with Einter ≥ 15 kBT, an intermediate plateau emerged and became more evident with increased Einter. However, these cases had the same number of clusters N(t) at steady-state regardless of the values of Einter. This observation was probably due to the fact that the aggregations at steady-state were limited by the incoming flow of the diffusing dimers when roff became smaller than rmonodiff. According to the classical nucleation theory,58 enhanced interaction strength results in reduced critical cluster size. The trend of decreasing cluster size with Einter is consistent with the theoretical predication (Fig. 2b and c). Similar observation was also reported for simulated aggregations by monomer addition.59 Moreover, the evolution of number average cluster size A(t) and the weight average cluster S(t) displayed a double-S shape. The second “S” is associated with the intermediate plateau in N(t). The presence of double-S suggests the formation of intermediate aggregates.60 Significant fraction of uncompacted clusters was identified in the plateau of the first S phase (Fig. S4a), which disappeared from the steady-state at the end of the second S phase (Fig. S4b). The uncompacted clusters usually have higher energies than compacted ones since they have longer perimeters that correspond to large surface energies. Additionally, the A(t) and S(t) decreased with Einter when Einter ≤ 15 kBT whereas they had almost the same values when Einter ≥ 15 kBT. For all cases, more time was required for the system to reach the final steady-state with increased Einter although the aggregation rate in the first “S” phase was promoted by Einter. As to the polydispersity P(t), it fluctuated around 1.0 for most cases except for the cases of low Einter. When Einter = 8 kBT, the width of the cluster size distribution was highly spread during faster aggregation phase since P(t) deviated dramatically away from 1.0 (Fig. 2d). The significant polydispersity was probably due to the large critical size associated with weak interaction strength. The cluster size distributions of Einter = 8 kBT and 10 kBT are also shown Fig. 3a and b, respectively. In comparison, the cluster size was sparely distributed for the low interaction strength case.


image file: c4ra09189b-f2.tif
Fig. 2 The effect of interaction strength for monomers in different dimers on the aggregation of dimeric biomacromolecules in 256 × 256 hexagonal lattices using the KMC method where Γoff = 106 Hz, rmonodiff = 0.1 μm2 s−1 and φ = 0.016. The evolutions of the number of clusters N(t), number average cluster size A(t), weight average cluster size S(t), and polydispersity P(t) are shown in (a), (b), (c) and (d), respectively.

image file: c4ra09189b-f3.tif
Fig. 3 The size distribution of oligomers at t = 0.01, 0.1, 1.0 and 10 s for Einter = 8 kBT (a) and 10 kBT (b), respectively. The size distribution is more spread in the low Einter case.

Besides the interaction strength between dimers, the diffusion coefficient is another critical factor determining the dynamics of aggregation. To investigate the effect of diffusion process on aggregation, we varied the diffusion coefficient from 0.1 to 10.0 μm2 s−1 for Einter = 10 kBT and φ = 0.016. The comparison of the statistical outputs of the simulations with different diffusion coefficients is shown in Fig. 4. As the diffusion coefficient increased, the fast drop of the number of clusters shifted to smaller time scales and the aggregation kinetics was accelerated. The double-S shape appeared in the evolutions of A(t) and S(t) but not in the evolution of N(t), which is different from that in Fig. 2 where the interaction energy was enhanced. Additionally, A(t) and S(t) at steady-state decreased with diffusion coefficient. Again, the presence of double-S suggests the existence of intermediate aggregates. These intermediates had uncompacted configurations and disappeared in the later stages of aggregation (Fig. S5) as the energy of the system minimized over time.


image file: c4ra09189b-f4.tif
Fig. 4 The effect of diffusion process on the aggregation of dimeric biomacromolecules in 256 × 256 hexagonal lattices using the KMC method. The evolutions of the number of clusters N(t), number average cluster size A(t), weight average cluster size S(t) and polydispersity P(t) are shown in (a), (b), (c) and (d), respectively. The interaction strength Einter was 10 kBT. The diffusion coefficient varied from 0.1–10.0 μm2 s−1.

As the concentration of the biomacromolecules also affects the mean free path for dimers, we varied the coverage φ of the biomacromolecules from 0.016 to 0.16, corresponding to 6400–64[thin space (1/6-em)]000 molecules per μm3 close to the cellular protein concentrations.48 The comparison of the statistical outputs of the simulations with different coverage is shown in Fig. 5. The kinetics of aggregation shifted towards smaller time scale with increased concentration, indicating that the shortening of the travel distance for the collisions between dimers and existing clusters accelerates the aggregation process. The double-S shape emerged in the evolutions of A(t) and S(t) when the coverage φ was higher than 0.1. The steady-state values of A(t) and S(t) only increased slightly with φ in the range of 0.016 to 0.16, similarly to the observations of the aggregations by monomer addition.26


image file: c4ra09189b-f5.tif
Fig. 5 The effect of concentration on the aggregation of dimeric biomacromolecules in 256 × 256 hexagonal lattices using the KMC method. The evolutions of the number of clusters N(t), number average cluster size A(t), weight average cluster size S(t) and polydispersity P(t) are shown in (a), (b), (c) and (d), respectively. The parameters are Einter = 10 kBT, Γoff = 106 Hz, and rmonodiff = 0.1 μm2 s−1.

Similar to the kinetics of aggregation of particles through monomer addition mechanism,20,61 the simulated aggregation of filamentous biomacromolecules started with an initial lag phase and entered a fast elongation phase before reaching the steady-state (Fig. 6). Here, the lag phase was more sensitive to the diffusion coefficient and the concentration (or the coverage) of dimers. The increase of interaction energy between dimers also shortened the lag phase but not as effective because the dissociation rate is an exponential function of the interaction energy and a slight change in the energy leads to a dramatic shift in the dissociation kinetics. The number of building block in the aggregates was usually used to characterize the kinetics of assembly by the monomer addition mechanism.20,62 Comparing the data in Fig. 6 to those in Fig. 2, 4 and 5, it can be seen that N(t), A(t), S(t) and P(t) were more sensitive to the subtle features of aggregation kinetics. For example, the double-S shapes were only captured by the first three parameters, not the amount of the dimer in oligomers; in the late stage of aggregation, A(t) and S(t) still displayed considerable dynamics while the fraction of the dimer in oligomers was already constant (Fig. 6).


image file: c4ra09189b-f6.tif
Fig. 6 The fraction of dimer in oligomers is affected by the interaction energy (a), the diffusion coefficient (b), and molecular concentration (c).

Unlike spherical particles, dimers have an anisotropic shape and possibly a polarized charge distribution. The anisotropicity can lead to singularities in aggregates as indicated by the white arrows in Fig. S5. These singularities do not allow easy fill-in of dimers and hence leave an empty space in the aggregates, which leads to the formation of metastable clusters that may or may not evolve into stable clusters. These metastable clusters have impaired structural stability, which potentially affect their biological functions in cells. Especially for cytoskeletal proteins such as myosin II, keratin and vimentin that govern the mechanical properties of cells, these singularities could potentially cause severe influence on cellular physiology. Importantly, the accelerated assembly of aggregates due to the mutations in these biomacromolecules is prone to these singularities because increased intermolecular interactions do not permit the aggregates to relax to achieve lower energy configurations.

In the above simulations, Γoff was assumed to be 106 Hz that is at the high end of possible frequency range. To investigate the effect of Γoff, we used Γoff = 104 Hz (the low end) for cases with Einter = 10 kBT, φ = 0.016 and different diffusion coefficients (Fig. S6). Again, the double-S feature occurs in all cases. By comparison, the diffusion coefficient only plays a role in the sub-second time scale whereas the first-S phases reside and the second-S phases of these cases are almost indistinguishable, which is also dramatically different from the cases with Γoff = 106 Hz in Fig. 4 where the diffusion coefficient affects both the first- and second-S phases.

To demonstrate the relevance between our simulations and experiments, we compare our simulation results to the experimental observations of the assembly kinetics of myosin II thick filaments reported by R. K. Mahajan and J. D. Pardee.14 In the experiments, the assembly of the purified myosin II proteins was promoted by adding salt to the protein solution and the assembly kinetics of thick filaments was measured by light scattering method. The comparison between the simulation and the experiment is shown in Fig. 7. The solid curves are the data extracted from the experimental results.14 The open symbols are the simulation results at Γoff = 104 Hz, Einter = 10 kBT, rmonodiff = 0.1–10.0 μm2 s−1 and 3D concentration of 0.25 μM (equivalently φ = 0.016 in 2D) dimer, which corresponds to the second-S phase that occurs at the similar time scale when the experimental observations were made. As the first-S phase is too short to be seen in experiments (Fig. S6), it was not included for comparison. It can be seen that the simulation results are in good agreement with the experimental ones. Additionally, the accelerated kinetics of aggregations resulted from the increased 2D coverage φ is consistent with the trend in the experiments where the high concentration promoted the aggregation of proteins. Taken together, the comparison suggests that the values of the parameters and the numerical scheme for dimer addition mechanism used in our simulations are able to reproduce experimental results.


image file: c4ra09189b-f7.tif
Fig. 7 The simulated aggregation of dimers is in good agreement with the experimental observations of the assembly of myosin II thick filaments. The solid curves are the experimental data extracted from R. K. Mahajan and J. D. Pardee (Fig. 2a in Biochemistry 1996, 35:15[thin space (1/6-em)]504–15[thin space (1/6-em)]514). The open symbols are the simulation results at Γoff = 104 Hz, Einter = 10 kBT, and 3D concentration of 0.25 μM (equivalently φ = 0.016 in 2D) dimer, corresponding to the second S phase (Fig. S6), which occurs on a similar time scale as the experimental observations. The first S phase in Fig. S6 is too short to be observed in the reported experiments. The open circles, triangles and squares represent the cases of rmonodiff = 0.1, 1.0 and 10.0 μm2 s−1, respectively.

Intuitively, the dimer translation might be considered equivalent to the combination of two successive rotations of monomers. As the events in KMC simulations are based on associated probabilities, the overall rate of two successive events is the product of the rates of these two events, not the summation. Therefore, numerically the dimer translation is not equivalent to the result of two successive rotations of monomers. To show the effect of dimer translation, simulations in the absence of the dimer translation were conducted for interaction energy at 10 kBT and 20 kBT (Fig. S7). The difference is apparent at 10 kT when compared to the results with dimer translation.

So far, the dimers were only allowed to move in 2D. However, they could move along the direction perpendicular to the 2D plane in cells. To study the effect of the third direction of motion, we performed additional simulations by creating and deleting unassembled dimers randomly at the same rates to ensure the mass conservation. Dramatic effect was observed when these rates are 10 times faster than the dimer rotation rate (Fig. S8). However, when there rates are equal to or smaller than the dimer rotation rate (not shown), the effect is negligible.

It is worth pointing out that the KMC simulations carried out in this study are not purposely fit to any experimental observations but rather to demonstrate the power of the KMC simulations and investigate the effects of interaction energy, diffusion, and molecular concentration on the aggregation processes that are dependent on dimer addition mechanism. To mimic the kinetics of the aggregation of specific biomacromolecules, one can adjust the value of Γoff since it is an empirical parameter that is difficult to directly measure experimentally. By contrast, the values of other parameters such as rmonodiff, Einter, and the size of molecules may be accurately obtained by experimental techniques.

Conclusions

A stochastic simulation model of the assembly of biomacromolecules by the dimer addition mechanism was presented and the statistical outputs were discussed. The values of three critical parameters, the interaction energy, the diffusion coefficient and the concentration, were varied in physiologically relevant ranges. The energy barrier for the dissociation of dimers had the strongest effect on the average cluster size and cluster number in the parameter regimes investigated here. Meanwhile, the diffusion and concentration of biomacromolecules had a weak effect. All three factors influenced the rate of fast aggregation after the initial lag phase. The number of clusters, the number average cluster size, the weight average cluster size, and the polydispersity were used to analyze the kinetics of aggregations under different conditions. These four parameters were able to detect subtle features of the kinetics. Double-S shapes were observed in simulations, which are suggested to be the results of unstable aggregates. KMC simulations make possible the investigation of the aggregation of mutated biomacromolecules from microseconds to hours, where the interaction energy is highly affected by the mutations. Currently, molecular dynamics simulations allow the accurate predication of the interaction energy associated with mutations, which can be potentially combined with KMC simulations to make the molecular simulations more powerful. The simulation approach presented in this work could be used for other phenomena beyond the examples described here used for its initial development. For example, the approach may be extended to investigating more complicated situations where the dipole associated with each dimer is considered. It would also be worthwhile to extend the methodology to the full kinetic spectrum from the diffusion-limited extreme to the reaction-limited extreme, for example, by explicitly setting the energy barrier for the association events. Such extensions, which rely on increased computational power, offer the promise for improved understanding of the disease progression due to the abnormal aggregations of filamentous proteins in cells.

Acknowledgements

The authors greatly acknowledge the helpful discussions with Prof. Pablo Iglesias and members of the Robinson Lab. D. N. R. thanks the financial support from National Institute of Health grant GM66817.

References

  1. F. Chiti and C. M. Dobson, Annu. Rev. Biochem., 2006, 75, 333 CrossRef CAS PubMed.
  2. A. Andersson, S. Bohman, L. A. H. Borg, J. F. Paulsson, S. W. Schultz, G. T. Westermark and P. Westermark, Exp. Diabetes Res., 2008, 2008, 562985 CrossRef PubMed.
  3. W. Liang, H. M. Warrick and J. A. Spudich, J. Cell Biol., 1999, 147, 1023 CrossRef.
  4. S. Yumura, M. Yoshida, V. Betapudi, L. S. Licate, Y. Iwadate, A. Nagasaki, T. Q. Uyeda and T. T. Egelhoff, Mol. Biol. Cell, 2005, 16, 4256 CrossRef CAS PubMed.
  5. T. Vicsek and F. Family, Phys. Rev. Lett., 1984, 52, 1669 CrossRef.
  6. D. A. Weitz and M. Y. Lin, Phys. Rev. Lett., 1986, 57, 2037 CrossRef CAS.
  7. P. Meakin, T. Vicsek and F. Family, Phys. Rev. B: Condens. Matter Mater. Phys., 1985, 31, 564 CrossRef.
  8. S. Sacanna and D. J. Pine, Curr. Opin. Colloid Interface Sci., 2011, 16, 96 CrossRef CAS PubMed.
  9. E. M. Reichl, Curr. Biol., 2008, 18, 471 CrossRef CAS PubMed.
  10. M. Beil, et al., Nat. Cell Biol., 2003, 5, 803 CrossRef CAS PubMed.
  11. T. Luo, V. Srivastava, Y. Ren and D. N. Robinson, Appl. Phys. Lett., 2014, 104, 153701 CrossRef PubMed.
  12. Q. Sun, et al., Cell Res., 2014, 24, 1299 CrossRef CAS PubMed.
  13. X. Liu, S.-M. Hong, S. Shu, S. Yu and E. D. Korn, Proc. Natl. Acad. Sci. U. S. A., 2012, 110, E33 CrossRef PubMed.
  14. R. K. Mahajan and J. D. Pardee, Biochemistry, 1996, 35, 15504 CrossRef CAS PubMed.
  15. R. K. Mahajan, K. T. Vaughan, J. A. Johns and J. D. Pardee, Proc. Natl. Acad. Sci. U. S. A., 1989, 86, 6161 CrossRef CAS.
  16. J. H. Sinard, W. F. Stafford and T. D. Pollard, J. Cell Biol., 1989, 109, 1537 CrossRef CAS.
  17. P. Soellner, R. A. Quinlan and W. W. Franke, Proc. Natl. Acad. Sci. U. S. A., 1985, 82, 7929 CrossRef CAS.
  18. R. Miller, S. Khuon and R. Goldman, J. Cell Biol., 1993, 122, 123 CrossRef CAS.
  19. R. Kirmse, Z. Qin, C. M. Weinert, A. Hoenger, M. J. Buehler and L. Kreplak, PLoS ONE, 2010, 5, e12115 Search PubMed.
  20. W.-F. Xue, S. W. Homans and S. E. Radford, Proc. Natl. Acad. Sci. U. S. A., 2008, 105, 8926 CrossRef CAS PubMed.
  21. S. Prigent, A. Ballesta, F. Charles, N. Lenuzza, P. Gabriel, L. M. Tine and H. Rezaei, PLoS One, 2012, 7, e43273 CAS.
  22. Y. Ren, J. C. Effler, M. Norstrom, T. Luo, R. A. Firtel, P. A. Iglesias, R. S. Rock and D. N. Robinson, Curr. Biol., 2009, 19, 1421 CrossRef CAS PubMed.
  23. T. Luo, K. Mohan, P. A. Iglesias and D. N. Robinson, Nat. Mater., 2013, 12, 1064 CrossRef CAS PubMed.
  24. M. Lach-hab, A. E. González and E. Blaisten-Barojas, Phys. Rev. E, 1996, 54, 5456 CrossRef CAS.
  25. F. Shi, Y. Shim and J. G. Amar, Phys. Rev. E, 2006, 74, 021606 CrossRef.
  26. P. K. Jha, V. Kuzovkov, B. A. Grzybowski and M. Olvera de la Cruz, Soft Matter, 2012, 8, 227 RSC.
  27. C. Ratsch, M. F. Gyure, S. Chen, M. Kang and D. D. Vvedensky, Phys. Rev. B: Condens. Matter Mater. Phys., 2000, 61, R10598 CrossRef CAS.
  28. J. Erlebacher, M. J. Aziz, A. Karma, N. Dimitrov and K. Sieradzki, Nature, 2001, 410, 450 CrossRef CAS PubMed.
  29. J. Rugolo, J. Erlebacher and K. Sieradzki, Nat. Mater., 2006, 5, 946 CrossRef CAS PubMed.
  30. T. O. Drews, A. Radisic, J. Erlebacher, R. D. Braatz, P. C. Searson and R. C. Alkire, J. Electrochem. Soc., 2006, 153, C434 CrossRef CAS PubMed.
  31. X. Zhang, W. Gao, P. Bellon, R. S. Averback and J.-M. Zuo, Acta Mater., 2014, 79, 37 CrossRef CAS PubMed.
  32. B. Sauerwine and M. Widom, Phys. Rev. E, 2011, 84, 061912 CrossRef.
  33. M. J. Hamer, J. A. D. Wattis and R. S. Graham, J. Non-Newtonian Fluid Mech., 2010, 165, 1294 CrossRef CAS PubMed.
  34. B. Linse and S. Linse, Mol. BioSyst., 2011, 7, 2296 RSC.
  35. D.-W. Li, S. Mohanty, A. Irbäck and S. Huo, PLoS Comput. Biol., 2008, 4, e1000238 Search PubMed.
  36. T. Luo, K. Mohan, V. Srivastava, Y. Ren, Pablo A. Iglesias and D. N. Robinson, Biophys. J., 2012, 102, 238 CrossRef CAS PubMed.
  37. B. Zurek, J. M. Sanger, J. W. Sanger and B. M. Jockusch, J. Cell Sci., 1990, 97, 297 Search PubMed.
  38. D. J. Kraft, et al., Proc. Natl. Acad. Sci. U. S. A., 2012, 109, 10787 CrossRef CAS PubMed.
  39. L. Kreplak, U. Aebi and H. Herrmann, Exp. Cell Res., 2004, 301, 77 CrossRef CAS PubMed.
  40. N. Stuurman, S. Heins and U. Aebi, J. Struct. Biol., 1998, 122, 42 CrossRef CAS PubMed.
  41. J. Parkinson, K. E. Kadler and A. Brass, Phys. Rev. E, 1994, 50, 2963 CrossRef CAS.
  42. A. C. Levi and M. Kotrla, J. Phys.: Condens. Matter, 1997, 9, 299 CrossRef CAS.
  43. C. C. Battaile, D. J. Srolovitz and J. E. Butler, J. Cryst. Growth, 1998, 194, 353 CrossRef CAS.
  44. N. Metropolis, A. W. Rosenbluth, M. N. Rosenbluth, A. H. Teller and E. Teller, J. Chem. Phys., 1953, 21, 1087 CrossRef CAS PubMed.
  45. Z. Y. Zhang, W. P. Malachowski, R. L. Van Etten and J. E. Dixon, J. Biol. Chem., 1994, 269, 8140 CAS.
  46. T. D. Pollard, W. C. Earnshaw and J. Lippincott-Schwartz, Cell Biology, Elsevier, 2007 Search PubMed.
  47. Emmanuel D. Levy, J. Kowarzyk and S. W. Michnick, Cell. Reprogramming, 2014, 7, 1333 CAS.
  48. R. Milo, BioEssays, 2013, 35, 1050 CrossRef CAS PubMed.
  49. S. Y. Noskov and C. Lim, Biophys. J., 2001, 81, 737 CrossRef CAS.
  50. C. W. Mullineaux, A. Nenninger, N. Ray and C. Robinson, J. Bacteriol., 2006, 188, 3442 CrossRef CAS PubMed.
  51. F. Ulrich and C. Heisenberg, Traffic, 2009, 10, 811 CrossRef CAS PubMed.
  52. J. Capoulade, M. Wachsmuth, L. Hufnagel and M. Knop, Nat. Biotech, 2011, 29, 835 CrossRef CAS PubMed.
  53. K. Jacobson and J. Wojcieszyn, Proc. Natl. Acad. Sci. U. S. A., 1984, 81, 6747 CrossRef CAS.
  54. R. Uehara, G. Goshima, I. Mabuchi, R. D. Vale, J. A. Spudich and E. R. Griffis, Curr. Biol., 2010, 20, 1080 CrossRef CAS PubMed.
  55. N. T. Snider and M. B. Omary, Nat. Rev. Mol. Cell Biol., 2014, 15, 163 CrossRef CAS PubMed.
  56. J. E. Eriksson, T. Dechat, B. Grin, B. Helfand, M. Mendez, H.-M. Pallari and R. D. Goldman, J. Clin. Invest., 2009, 119, 1763 CrossRef CAS PubMed.
  57. A. Aguzzi and T. O'Connor, Nat. Rev. Drug Discovery, 2010, 9, 237 CrossRef CAS PubMed.
  58. R. Becker and W. Döring, Ann. Phys., 1935, 24, 719 CrossRef CAS.
  59. J. Merikanto, H. Vehkamäki and E. Zapadinsky, J. Chem. Phys., 2004, 121, 914 CrossRef CAS PubMed.
  60. D. Molnar, C. Niedermeier, A. Mora, P. Binkele and S. Schmauder, Continuum Mech. Thermodyn., 2012, 24, 607 CrossRef CAS PubMed.
  61. M. Kreishman-Deltrick and M. K. Rosen, Nat. Cell Biol., 2002, 4, E31 CrossRef CAS PubMed.
  62. M. I. Ivanova, S. A. Sievers, E. L. Guenther, L. M. Johnson, D. D. Winkler, A. Galaleldeen, M. R. Sawaya, P. J. Hart and D. S. Eisenberg, Proc. Natl. Acad. Sci. U. S. A., 2014, 111, 197 CrossRef CAS PubMed.

Footnote

Electronic supplementary information (ESI) available. See DOI: 10.1039/c4ra09189b

This journal is © The Royal Society of Chemistry 2015
Click here to see how this site uses Cookies. View our privacy policy here.