Influence of rare earth doping on the structural and electro-magnetic properties of SmFeAsO0.7F0.3 iron pnictide†
J. B.
Anooja
a,
P. M.
Aswathy
a,
Neson
Varghese
a,
C. K.
Chandrakanth
a,
N.
Devendra Kumar
b,
A.
Sundaresan
c and
U.
Syamaprasad
*a
aNational Institute for Interdisciplinary Science and Technology (CSIR), Trivandrum 695019, India. E-mail: syamcsir@gmail.com; Fax: +91-471-2491712; Tel: +91-471-2515373
bDepartment of Engineering, University of Cambridge, Cambridge CB2 1PZ, UK
cChemistry and Physics of Materials Unit, Jawaharlal Nehru Centre for Advanced Scientific Research, Bangalore 560064, India
First published on 1st July 2015
Abstract
The effects of rare earth site doping on the structural, superconducting and magnetic properties of SmFeAsO0.7F0.3 iron pnictide are investigated. Gd3+ and Ce3+ ions are chosen by virtue of their position being on either side of Sm3+. Doping of both smaller (Gd3+) and larger (Ce3+) ions at the Sm3+ site increases the TC up to 55 K. Doping with the smaller Gd3+ results in lattice contraction and thereby enhances TC. It is interesting to observe that though Ce3+ doping in SmFeAsO0.7F0.3 exhibits an increase in lattice parameters, a substantial enhancement of TC occurs. The enhancement in TC due to increased charge carrier concentration is also confirmed using Hall Effect measurement. Apart from TC enhancement, the simultaneous doping of both at oxygen and rare earth sites prominently increases the superconducting properties such as JC, HC1 and HC2. The co-doped samples also exhibit better magnetic field dependence of JC over the entire field of study. It is also observed that the Ce3+ doped sample shows higher JC in the high field region due to its enhanced flux pinning properties.
Introduction
SmFeAsO1−xFx, superconductor belonging to the 1111 family of iron pnictides has received considerable attention in the field of superconductivity because of its very high upper critical field (HC2) of the order of 100 T and a relatively high transition temperature (TC).1–4 Experiments were done rapidly to characterize the physical properties of this class of compounds and to explore different possibilities for further TC enhancement.5–7 New insights into the underlying physics of high-TC superconductivity are also anticipated since the iron oxypnictides have some similarities to the cuprates with the simultaneous existence of a few significant dissimilarities too. The La1111 system behaves like MgB2 in which thermal fluctuations of vortices do not significantly affect their behavior in the presence of strong magnetic fields to a large extent as it happens in the layered cuprates.8 However, the situation is different for the Sm1111 system having greater mass anisotropy and enhanced thermal fluctuations.9 Generally, the electronic band structure of the parent iron-based superconductors (REFeAsO, RE-rare earths) is semi-metallic, consisting of hole and electron Fermi surface pockets, separated by a (π, π) wave vector in momentum space.10 They have a layered crystal structure belonging to the tetragonal P4/nmm space group with alternating FeAs and REO layers in which conductivity occurs mainly in the FeAs layers while the REO layers act as charge reservoirs. Here the FeAs layer is negatively charged, and the REO layer is positively charged. The parent material shows a structural transition with temperature from the tetragonal to the orthorhombic phase and exhibits a spin density wave (SDW) order. Chemical doping in REFeAsO can suppress the structural transition and thereby SDW, leading to superconductivity. The carrier concentration in the FeAs layer increases by the substitution of F− at the O2− site or Th4+ at the RE3+ site and an increase in TC is achieved by the creation of more carriers in the FeAs layer.2,11 With doping the density of states of the system at the Fermi level was found to increase as the cell volume reduced, favoring the TC enhancement. Both F− for O2− and Th4+ for RE3+ substitutions induce electrons as the charge carriers in the FeAs layer. Hole doping is another effective method to induce superconductivity in this material in which Sr2+ is substituted in place of the RE3+ site.12 Oxygen deficiency also induces superconductivity; the crystal structure could be significantly modified compared with that of the parent compound, and TC becomes maximum when the FeAs4-lattices form a regular tetrahedron.13 Usually, in cuprate based superconductors any change made in the conducting layer (CuO layer) destroys superconductivity; however superconductivity is induced by doping in the FeAs layer of iron pnictides.14 In short, this system can sustain deliberately made changes in the conducting layer like doping at the Fe site and the creation of As vacancies.Another key attraction of the 1111 family is the versatility of doping at different sites at the same time and thereby regulating the electronic properties of this system. Partial replacement of elements in the reservoir layer with those having different valencies or ionic radii causes lattice distortion and modification of crystalline as well as electronic structures. There are reports on doping at the rare earth site along with fluorine doping that improves or modifies the superconducting properties of iron pnictides.7,15,16 Majority of the reports show that rare earth site doping was done with an element having a smaller ionic radius in order to obtain TC enhancement. The higher TC value is attributed to the increased internal chemical pressure from local lattice distortion induced by smaller-size dopants. In this paper, we have made an attempt to find the role of the ionic size of the dopant on the structural and superconducting properties of the superconductor by selectively choosing elements having smaller and larger ionic radii with respect to Sm3+. Herein, Gd3+ (93.5 pm) and Ce3+ (101 pm) were selected as dopants at the Sm3+ (95.8 pm) site in the SmFeAsO0.7F0.3 system. Sm1−yREyFeAsO0.7F0.3 (RE = Gd, Ce) samples were prepared and their structural, as well as superconducting properties, were studied in detail.
Experimental
Polycrystalline samples of Sm1−yREyFeAsO0.7F0.3 (RE = Gd, Ce) were prepared using a conventional solid state reaction method under ambient pressure. Powders of Sm, Fe, Fe2O3, and As were used as the starting materials (M/s Alfa Aesar, purity 99.9%). For rare earth site doping, pure metal powders of Gd and Ce were used. A nominal stoichiometric composition of SmFeAsO0.7F0.3 (Sm3), Sm1−yGdyFeAsO0.7F0.3 (y = 0.05, 0.10, 0.15, 0.20; named SmGd05, SmGd10, SmGd15, and SmGd20 respectively), Sm1−yCeyFeAsO0.7F0.3 (y = 0.05, 0.10, 0.15, 0.20; named SmCe05, SmCe10, SmCe15 and SmCe20 respectively) were chosen. The ingredients were stoichiometrically weighed and mixed thoroughly to form a homogeneous mixture. All chemical handlings were performed in an argon-filled glove box. The homogeneous mixture was compacted into rectangular pellets having dimensions of 15 × 5 × 2 mm, under a pressure of 500 MPa. The pellets were sealed inside evacuated quartz tubes and subjected to the following heating procedure. The samples were pre-processed at a temperature of 360 °C for 5 h. The pre-processed samples were again ground, pelletized, and sealed in evacuated quartz tubes and sintered at 850 °C for 30 h. In order to obtain dense pellets, the samples were again heat treated at a higher temperature of 1000 °C for 20 h. All the heating procedures were done in a programmable muffle furnace.The phase identification of the samples was performed using an X-ray diffractometer (Philips X'Pert Pro) with CuKα radiation employing a proprietary high-speed detector and a monochromator at the diffracted beam side. Microstructural analysis of the samples was done using a scanning electron microscope (JEOL JSM 5600L). The compositional analysis of the samples was done using an energy-dispersive spectrometer attached to Nova Nano SEM 450. Resistivity versus temperature (ρ–T) measurement was carried out using a standard DC four probe method in a closed cycle cryocooler integrated cryostat (Janis Research Co., SHI SRDK-408 SW). The temperature dependence of AC susceptibility (χ–T) was measured using a closed cycle AC susceptometer (ARS-CS202S-DMX-19 SCC). DC magnetization measurements were carried out by using a Physical Property Measurement System (PPMS, Quantum Design). The ρ–T variation with applied magnetic fields and Hall Effect measurements were also carried out in a PPMS (Quantum Design DynaCool) using the four-probe method.
Results and discussion
The powder X-ray diffraction patterns of Gd and Ce doped samples after heat treatment show that the main phase formed in all the samples is SmFeAsO and their corresponding peaks are indexed on the basis of the tetragonal ZrCuSiAs-type structure with the space group P4/nmm (see Fig. S1†). In addition to the main phase, impurity phases of SmOF and FeAs are also present in all the samples. However, no secondary phases corresponding to Gd or Ce or their derivatives could be detected. The volume percentage of SmFeAsO, SmOF, and FeAs was estimated from the XRD data using the formula: vol% of phase X = (∑Integrated peak intensities of phase X)/(∑Integrated peak intensities of all phases), and the data is given in Table 1. The superconducting volume fraction is found to be about 90% or above for all the samples. Fig. 1(a) and (b) are enlarged representations of the XRD patterns around the main peak (102). The peak shows a shift in 2θ with doping. The (102) peak of Gd doped samples shifts towards the right, whereas that of Ce doped ones display a left shift with increasing doping content y. This is of course due to the RE3+ (Gd & Ce) doping at the Sm3+ site. The ionic radius of Gd3+ is smaller than that of Sm3+, but the ionic radius of Ce3+ is larger with respect to Sm3+. Doping with an element having smaller ionic radius usually gives a lattice parameter contraction, while doping with an element of larger ionic radius displays lattice expansion. Hence, the shift in the position of the peaks in the XRD pattern depicts the change of lattice parameters with Gd3+ and Ce3+ doping at the Sm3+ site. The substitution range of the dopants at the Sm3+ site in the SmFeAsO0.7F0.3 system was determined by measuring the change of lattice parameters with the nominal content, y. This is an accepted method for determining the extent of substitution due to which the lattice parameters increase or decrease linearly with increasing doping concentration and finally remains constant despite increasing dopant concentration.17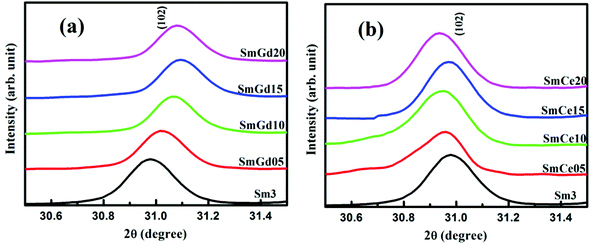 | ||
| Fig. 1 Enlarged view of the main peak (102) of (a) Gd3+ doped and (b) Ce3+ doped samples with respect to Sm3. | ||
| Sample name | Vol% of phases | Sm & Gd\Ce composition from EDAX | Lattice parameters (Å) | Density (g cm−3) | ||||||
|---|---|---|---|---|---|---|---|---|---|---|
| Pure | SmOF | FeAs | Sm | Gd\Ce | A | c | ||||
| Initial | Final | Initial | Final | |||||||
| Sm3 | 94.4 | 4.2 | 1.4 | 1.000 | 0.986 | 0.000 | 0.000 | 3.935(1) | 8.486(2) | 4.85 |
| SmGd05 | 90.9 | 7.4 | 1.7 | 0.950 | 0.935 | 0.050 | 0.044 | 3.928(2) | 8.480(1) | 4.87 |
| SmGd10 | 91.8 | 6.4 | 1.8 | 0.900 | 0.869 | 0.100 | 0.090 | 3.925(1) | 8.475(1) | 5.32 |
| SmGd15 | 91.5 | 6.4 | 2.1 | 0.850 | 0.827 | 0.150 | 0.146 | 3.925(1) | 8.467(1) | 5.28 |
| SmGd20 | 90.6 | 7.1 | 2.3 | 0.800 | 0.772 | 0.200 | 0.194 | 3.925(2) | 8.468(2) | 5.39 |
| SmCe05 | 94.6 | 4.3 | 1.1 | 0.950 | 0.927 | 0.050 | 0.042 | 3.936(1) | 8.492(2) | 5.33 |
| SmCe10 | 94.9 | 4.1 | 1.0 | 0.900 | 0.865 | 0.100 | 0.084 | 3.937(2) | 8.497(1) | 5.38 |
| SmCe15 | 93.8 | 4.9 | 1.3 | 0.850 | 0.826 | 0.150 | 0.118 | 3.940(1) | 8.498(2) | 5.30 |
| SmCe20 | 89.6 | 7.4 | 3.0 | 0.800 | 0.793 | 0.200 | 0.166 | 3.941(2) | 8.499(1) | 5.28 |
The lattice parameters a and c were calculated from Rietvield refined X-ray diffraction patterns and their variation with respect to doping concentration (y) is shown in Fig. 2(a) and (b). The refined lattice parameters obtained for the sample Sm3 (y = 0) are a = 3.935 Å and c = 8.486 Å. With Gd3+ doping, both a and c lattice parameters decrease systematically with nominal increase in the Gd content. For y = 0.15, both the lattice parameters reduce to a = 3.925 Å and b = 8.468 Å, but remain almost constant beyond y = 0.15. This suggests that the solubility limit of the Gd3+ ions is reached at y = 0.15 in the SmFeAsO0.7F0.3 system. Since the ionic size of Gd3+ is smaller than that of Sm3+, the above result confirms the successful substitution of Gd3+ at the Sm3+ site. However, Ce3+ doping at the Sm3+ site results in an elongation of both a and c lattice parameters. Lattice values increase with nominal increase in the y content up to y = 0.15 and then remains almost stagnant for y > 0.15. This is due to the larger ionic size of Ce3+ ions than that of Sm3+.
 | ||
| Fig. 2 Variation of lattice parameters a and c of the samples Sm1−yREyFeAsO0.7F0.3 (RE = Gd, Ce) with variation in y, (a) nominal Gd content and (b) nominal Ce content. | ||
In order to determine the exact composition of the samples, we have performed EDX (Energy Dispersive X-ray) spot analysis on all the samples. Typical EDX patterns of Gd3+ and Ce3+ doped ones (SmGd10 and SmCe10) are shown in Fig. S2.† The C peak observed in the spectra is due to the carbon tape used for sample fixing on the SEM stub. The quantitative analysis shows that Fe, As, O and F amounts to a stoichiometry of around 1, 0.9, 0.7 and 0.2, respectively for all the samples. Though the quantification of light weight elements using EDX is not fully reliable, the observations clearly indicate the fluorine loss in all the samples. The doped samples contain the presence of Ce and Gd peaks in SmCe10 and SmGd10, respectively. In the EDX spectrum of SmGd10 an overlap of Sm and Gd exists since their energy levels are close enough. Nevertheless, the quantitative Sm and Gd/Ce composition of all the samples evaluated from EDX is given in Table 1. The Sm/RE ratio in all the samples is almost equal to the corresponding nominal value. The phase formation and effective doping of Ce/Gd in Sm1111 observed in XRD is thus confirmed using EDX.
Significant microstructural variation resulting from both Gd3+ and Ce3+ doping at the Sm site is observed from the SEM images of the samples. Fig. S3† shows the SEM images of the freshly fractured surfaces of the sample Sm3 and selected samples of Gd3+ (SmGd10 & SmGd20) and Ce3+ (SmCe10 & SmCe20) doped ones. All the samples exhibit a layered flaky morphology, a typical feature of iron pnictides. The pure sample, Sm3 exhibits a mix of layered flaky structure with well-defined edges and occasional granularity present near the voids. With rare earth site doping, these voids get reduced and the sample density increases. The densities of the samples were also calculated using Archimedes’ principle and the obtained values are included in Table 1. We can see that the co-doping in the Sm1111 system increases the density of the samples and that their values are getting closer to the theoretical density of iron pnictides.18 The layered grains are stacked randomly and hence the weak links present at the grain boundaries limit the transport current flow. With Ce3+ doping the surface microstructure changes from the layered flaky nature of pure Sm3 to a more granular (Fig. S3† SmCe10 and SmCe20) one. It is also observed that higher doping of Ce3+ degrades the microstructure (SmCe20 in Fig. S3†). The average grain sizes of the samples were also estimated statistically using software. The grain size of the samples Sm3, SmGd10 and SmGd20 is found to be almost the same and is around 3.5 μm. However, smaller grains having sizes of about 1.8 μm and 1.6 μm are obtained for SmCe10 and SmCe20, respectively.
Fig. 3 shows the resistivity versus temperature (ρ–T) plots of Sm1−yREyFeAsO0.7F0.3 (RE = Gd, Ce) samples at zero magnetic field. The temperature at which resistivity falls sharply is taken as the TC and the observed TC values of all the samples are given in Table 2. All the samples show rather narrow transitions into the superconducting state at their respective transition temperatures and the sample Sm3 has a TC at 46 K. But this value is lower than the highest TC value (∼55 K) reported for the Sm1111 system elsewhere.5,19 The difficulty in preventing or controlling the volatile loss of fluorine at higher processing temperature could be the main reason behind the reduction in TC. However, in the present work all the samples i.e. a fluorine only doped sample and Ce and Gd co-doped samples were prepared using the same fluorine stoichiometry and all these were synthesized under identical conditions. Therefore, we used SmFeAsO0.7F0.3 as the reference sample. It is to be observed that due to the volatile loss of fluorine, the value of the F content in all the samples is almost identical and below the optimum level as observed from EDX. Interestingly, it is observed that both Gd3+ and Ce3+ doping with y = 0.1 increases the TC from 46 to around 55 K. An enlarged view of the ρ–T plot near TC is given in the inset of Fig. 3. A TC of 54.6 K is obtained by Gd3+ substitution at the Sm3+ site (y = 0.1) and a TC of 55.0 K for the Ce3+ (y = 0.1) substituted sample. The TC value of the Gd3+ doped sample improves from 46 to 52.4 K for a stoichiometry of y = 0.05 and reaches a maximum at y = 0.1. Further doping of Gd3+ slightly reduces the TC value and then remains almost constant irrespective of further increase in the dopant concentration. In the case of Ce3+ doping, maximum TC is obtained for y = 0.1 and further doping reduces the TC. It was observed that the over doping of Ce3+ considerably reduces the TC. Therefore, in the present case the optimum doping concentration obtained for both Gd3+ and Ce3+ doping is found to be around y = 0.1.
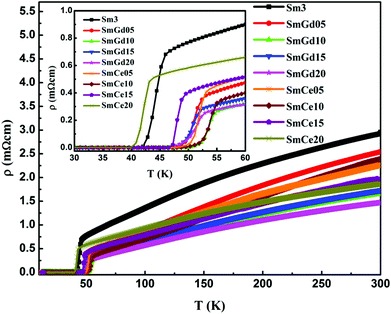 | ||
| Fig. 3 ρ–T plots of Sm3 (SmFeAsO0.7F0.3) as well as Gd3+ and Ce3+ doped samples; inset is an enlarged view around TC. | ||
| Samples | Sm3 | SmGd05 | SmGd10 | SmGd15 | SmGd20 | SmCe05 | SmCe10 | SmCe15 | SmCe20 | |
|---|---|---|---|---|---|---|---|---|---|---|
| T C (K) | ρ–T | 46.0 | 52.4 | 54.6 | 52.7 | 52.6 | 53.1 | 55.0 | 49.6 | 43.9 |
| χ–T | 45.7 | 52.0 | 54.0 | 52.1 | 52.1 | 52.8 | 54.7 | 49.4 | 44.1 | |
| ρ 300 (mΩ cm) | 2.9 | 2.5 | 1.7 | 1.7 | 1.5 | 2.3 | 2.4 | 1.9 | 1.8 | |
| RRR | 3.4 | 6.2 | 6.2 | 5.4 | 5.3 | 5.1 | 6.1 | 3.9 | 2.8 | |
Moreover, the normal state resistivity (ρ300) of the sample Sm3 decreases with rare earth site doping and the resistivity of all samples show nearly linear behavior with temperatures down to a characteristic temperature and thereafter the resistivity drops more quickly down to TC. The abrupt deviation from linearity in the ρ–T plot is due to the presence of a pseudogap, already reported in Sm-based iron pnictides.20,21 Another observation is the suppression of this pseudo gap at optimum doping of both Ce and Gd. The residual resistivity ratio RRR (ρ300/ρ55) of the doped samples increased significantly up to the optimum doping level of y = 0.1 with respect to that of Sm3 (up to 6.2 from 3.4), indicating stronger impurity scattering in the rare earth doped ones. The ρ300 and RRR values of all samples are given in Table 2.
In the case of Gd3+ doping, Sm3+ is replaced with a smaller ion which would create an internal chemical pressure in the system. Here, the substitution of a smaller Gd3+ ion in place of Sm3+ reduces both a and c values of the system and creates an isotropic lattice shrinkage. This triggers charge transfer from the charge reservoir layer (Sm2O2) into the conducting FeAs layer of the Sm1111 system.22,23 Consequently, the TC of the system increases with Gd doping, but only up to y = 0.1, beyond which TC shows a decreasing tendency. This type of behavior was already reported in Y doped RE1111 systems.16,22,24,25 Application of an external pressure into the system also exhibits a similar tendency if the sample is in the under doped region.26,27 While the effect of pressure for the over doped iron pnictide compounds is different or even opposite, i.e. in over doped samples, monotonic decrease of TC with pressure is expected.28–30 However, in the present case, the F doped sample is in the under doped region and hence Gd3+ doping induces a positive chemical pressure on TC, up to its optimum doping level.
Even though creation of an internal chemical pressure is regarded as an essentiality for the suppression of SDW instability and TC enhancement, it is interesting to observe that Ce3+ doping in the multiband superconductor Sm1111 exhibits a lattice parameter increase and a substantial enhancement in TC up to y = 0.1. It is to be noted that, unlike other rare earth elements, elemental Ce can attain a multiple valency of 3 and 4 or mixed valency depending on the surrounding environment at lower temperatures.31 The delocalized 4f electrons in cerium can fluctuate between two extreme valence states depending upon their local atomic configurations within the system. In the present case the structural modification created by the larger Ce3+ ion does not favor an increase in TC but it is probably due to a change in valency from 3+ to 4+ at low temperatures that increases the charge density in the conducting layer. The possibility of variation of valency at lower temperatures could be the reason for the observed TC enhancement. The observations conclude that, despite the difference in lattice parameter variation and origin of TC enhancement, both Ce3+ and Gd3+ doped systems show a critical doping level of y = 0.1 and the maximum TC achieved is around 55 K. Thus, the variation of TC with the doping content i.e. dTC/dy shows a sign reversal above y = 0.1. Doping of Ce3+ and Gd3+ ions can modify the Sm1111 system both structurally and in terms of density of states only up to a critical point above which the system gets distorted.
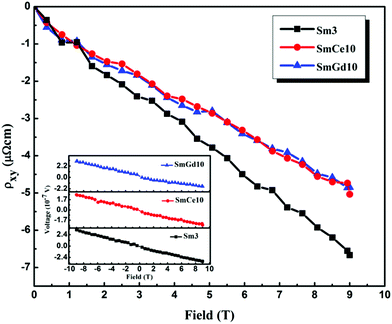
Although, Ce and Gd doping in the Sm1111 system have a different impact on the system, both of them eventually enhance the TC through effective increase in carrier concentration. Hence, an assessment of the charge density of the optimally doped samples is highly essential. For this, we conducted Hall Effect measurements on selected samples (RE-free sample, Sm3 and optimally doped samples from RE-doped sets, SmGd10 and SmCe10). The measurements were done on rectangular pellets of uniform thickness and the transverse Hall-voltage was measured by connecting voltage leads at the middle of the pellets, exactly perpendicular to the line of the current leads and to the direction of the applied magnetic field. The magnetic field was applied in such a way that its direction is perpendicular to the plane of the rectangular pellet. In order to avoid the contribution from longitudinal resistance, the magnetic field was swept from 9 T to −9 T and then the Hall-voltage was estimated by subtracting the longitudinal part. The variation of transverse resistivity (ρxy) with the magnetic field at a fixed temperature of 100 K for the samples Sm3, SmCe10, and SmGd10 is shown in Fig. 4. The inset of Fig. 4 shows the measured voltage at 100 K by varying the magnetic field from 9 T to −9 T. Both Sm3 and RE-doped samples show negative Hall resistivity and also exhibit linear field dependence. From these linear ρxy–B plots, the Hall coefficient of the samples were calculated as RH = ρxy/B. The RH values of the samples are −7 × 10⁻⁹ m3 C−1, −5.1 × 10⁻⁹ m3 C−1, and −5.0 × 10⁻⁹ m3 C−1 for Sm3, SmCe10, and SmGd10, respectively. The negative RH values indicate that electrons are the major charge carriers in the samples.32 We can also see that this negative value of RH decreases with RE doping, indicating the increase in the charge carrier density of the samples with both Gd and Ce doping at the Sm site. Moreover, the obtained RH values for optimally doped samples are almost equal which shows that the charge carrier densities within the optimally doped samples are more or less the same and also higher than Sm3. The charge carrier densities for the samples Sm3, SmCe10, and SmGd10 (calculated from the equation ne = 1/RHe) are 0.89 × 1027 m−3, 1.23 × 1027 m−3, and 1.25 × 1027 m−3, respectively. Thus, substitution of both smaller and larger ions at the Sm site relatively improves the charge carrier density of the system and hence favors the TC enhancement. The lattice shrinkage due to smaller isovalent Gd ions in Gd doped samples and the mixed valency nature of Ce in Ce doped ones assist the increase in charge density.
The real (χ′) and imaginary (χ′′) components of the AC susceptibility (at frequency, f = 208 Hz and AC field, Hac = 4.94 × 10⁻⁴ T) as a function of the temperature have been investigated. Both χ′ and χ′′ are normalized with χ′max and χ′′peak, respectively. Fig. 5 shows the temperature versus χ′/χ′max and χ′′/χ′′peak of all the samples. All the samples exhibit diamagnetic transition in χ′ and the corresponding TC values obtained are given in Table 2. Moreover, the χ′ of AC magnetic susceptibility is a measure of the energy stored in the sample due to the diamagnetic response of the screening current induced in the superconductor by the external magnetic field, whereas χ′′ is proportional to the energy loss due to the vortex motion. In the present study, the real part χ′ shows double step transition in all the samples. However, the double-stepping nature is not pronounced in the undoped sample and the sample SmCe20. A double step transition in the real part and its corresponding double peak in the imaginary part of AC susceptibility is a property of granular superconductors.33 Corresponding to the lower temperature transition, the χ′′ plot shows a peak; although the peak corresponding to the higher temperature transition is not well resolved in Fig. 5. The observed double step nature of χ′, an indication of granular behavior of our samples, confirms the inherent property of iron pnictides.34,35 In granular superconductors, screening current flows concurrently among the grains (intergrain current) and within the grains (intragrain current). Therefore, the output signal of AC measurement is a contribution of these two types of screening currents within the superconductor. Hence, the double step in χ′ of our samples can be also attributed to the existence of both intergrain and intragrain currents in the samples. It is also observed that the diamagnetic transition width gets broadened, and the depth of the first drop increases with an increase in doping up to the optimum doping level as shown in Fig. 5. The lowering of TC due to Ce doping at y = 0.2 makes the nature and the position of the AC susceptibility curve for SmCe20 get closer to that of the undoped sample, resembling the reduction in TC and revival of the pseudo gap in the resistivity data of SmCe20.
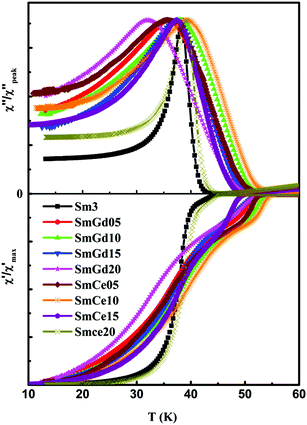 | ||
| Fig. 5 Normalized real (χ′) and imaginary (χ′′) part of AC susceptibility of Sm3 (SmFeAsO0.7F0.3) as well as Gd3+ and Ce3+ doped samples with frequency, f = 208 Hz and ac field, Hac = 4.94 × 10⁻⁴ T. | ||
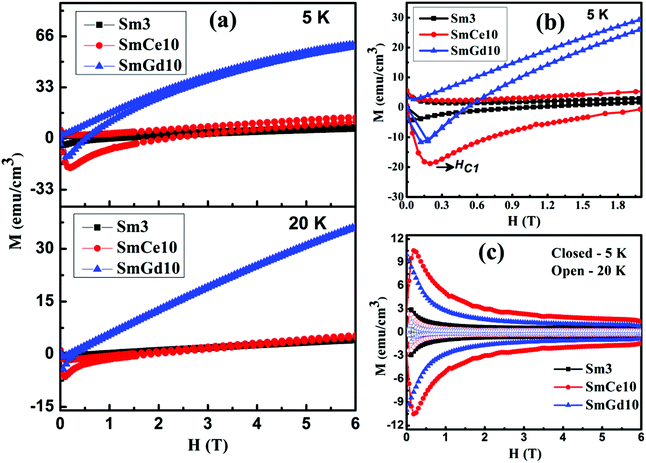
The dc magnetization of the sample was measured as a function of the applied magnetic field at different temperatures 5, 10, 20, 30, and 35 K. Fig. 6(a) shows the magnetization (M–H) loops of the sample Sm3 and the optimally doped samples (SmCe10 and SmGd10) at 5 and 20 K, with the applied magnetic fields up to 6 T. The obtained M–H curve is asymmetrical in nature, as already reported in RE1111 superconductors.36 Application of an external magnetic field produces a negative magnetization inside the sample up to a particular field, and then the magnetization starts to increase and takes a positive value. The effect is evidently more pronounced for the Gd doped sample. The field at which magnetization starts to increase is taken as the lower critical field (HC1) of the samples. An enlarged view of the M–H curve at 5 K around HC1 is shown in Fig. 6(b). For the sample Sm3, HC1 of 0.12 T is found at 5 K. Doping increases the HC1 values, i.e., HC1–0.2 T for SmCe10 and HC1 ∼ 0.18 T for SmGd10. Here, the M–H curves can be treated as a superposition of both the superconducting contribution and a paramagnetic background. The paramagnetic contribution comes from the presence of RE3+ magnetic ions and magnetic impurity phases. It is also interesting to note that the paramagnetic background detected is very high in Gd3+ doped samples. This can be attributed to the relatively high paramagnetic moment of the Gd3+ ions (7.94μB for Gd3+, 2.4μB Ce3+ and 0.84μB for Sm3+). Reports on GdFeAsO1−xFx samples also reveal that a strong paramagnetic background in these samples arises due to the presence of Gd3+.37 This paramagnetic background can be evaluated as a mean of the upper and lower hysteresis branch, MP = (M+ + M−)/2, for each loop and this has been deducted from the experimentally obtained M–H curves.
Fig. 6(c) shows the paramagnetic background subtracted hysteresis curves of the respective samples. At 5 K, the M–H curves of all three samples show a clear hysteresis loop. With increasing temperature, the width of the loop was found to decrease for all the samples. Rare earth site doping with both Ce3+ and Gd3+ considerably enhances the M–H loop width at 5 and 20 K. The maximum loop width is obtained for the sample SmCe10. Also, the maximum width of the background subtracted curve is found to be at a low magnetic field (around HC1) and then the width reduces rapidly with increasing field and then demonstrates a field independent property. This typical behavior of granular superconductors is due to the weak-link nature of the grain boundaries, and its extreme sensitivity towards the magnetic field. However, at higher fields the width of the hysteresis curve remains almost constant up to the highest measured magnetic field of 6 T.
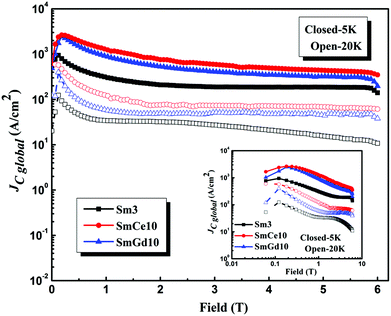
The critical current density (JC) values estimated from the M–H loops at 5 K and 20 K of the samples Sm3, SmCe10 and SmGd10 are given in Fig. 7. The width of the M–H loop (ΔM) is due to the irreversible magnetization retained in the sample due to the flux pinning property of the superconductors. ΔM was calculated as M+ − M−; M+ and M− are the magnetization produced in the increasing and decreasing branches. The numerical value of ΔM is proportional to the critical current density of the superconductor and the length scale of the current flow. Using the Bean critical state model,38 we can calculate inter-grain/global JC (JC-global – current flowing through the entire sample) and intra-grain/local JC (JC-local – current flowing within the grains). JC-global of the samples has been evaluated from the width of the M–H loop as JC-global = 20ΔM/a(1 − a/3b); where a and b are the dimensions of the sample perpendicular to the applied magnetic field, a < b. Here ΔM is in emu cm−3, sample dimensions are in cm, and the obtained JC is in A cm−2. The sample Sm3 shows a JC-global ∼ 0.9 × 10³ A cm−2 in the low field region. However, JC-global values of ∼2.5 × 10³ A cm−2 are obtained for both the doped samples at around 0.18 T at 5 K. Though, these JC values show a decreasing tendency with the field up to around 2 T, JC remains constant (∼0.8 × 10³ A cm−2 for SmCe10, ∼0.5 × 10³ A cm−2 for SmGd10, and ∼0.2 × 10³ A cm−2 for Sm3) with further increase in the magnetic field. These JC values are distinctly better than those observed in randomly oriented polycrystalline cuprates, which are typically ∼100 A cm−2.39 Thus, the rare earth site doping in SmFeAsO0.7F0.3 considerably improves the JC of the samples, in addition to the enhancement of TC and HC2 values. It is also found that JC of the Ce3+ doped sample is higher than the Gd3+ doped one in the high field region; and its value is four times higher than the F only doped sample (Sm3). These observations suggest that the lattice defects created by the larger ion Ce3+ at the Sm3+ site in the SmFeAsO0.7F0.3 system act as stronger pinning centers than that created by smaller Gd3+ ions and thereby exhibit enhanced JC (H) performance compared to the Gd doped sample. No obvious second peak in JC-global–H is observed for the samples at 5 and 20 K. But, there exists reports revealing the second peaking in the Sm1111 samples at a temperature close to TC. Therefore, for a close observation, a double logarithmic representation of JC-global–H was plotted and is shown in the inset of Fig. 7. At 20 K, the F only doped sample, Sm3, depicted the second peak in the high field region. However, this is not clearly visible in the rare earth site doped samples even up to the highest magnetic field applied. This can be attributed to the very high HC2 values of the rare earth doped samples as discussed in the succeeding section.
The intra-grain JC (JC-local) was also calculated using the equation JC-local = 30ΔM/r, where r is the grain size in cm. An average grain size of 3.5 μm for Sm3 and SmGd10 and 1.8 μm for SmCe10 was estimated from the SEM images. At 5 K, JC-local of 3.5 × 10⁶ A cm−2 was obtained for the Ce doped sample which is almost one order higher than the intra-grain JC of Sm3 i.e. around 5.0 × 10⁵ A cm−2. Ce3+ doping at the Sm site in Sm3 remarkably enhanced the JC value within the grain over the entire magnetic field. Gd3+ doping in Sm3 also improved the JC-local values, but to a lesser extent compared to the Ce3+ doped ones. A JC-local of ∼1.3 × 10⁶ A cm−2 was obtained for SmGd10. The microstructural analysis has already revealed that optimum doping of Ce3+ gives well-connected grains of a smaller size. In addition, the lattice mismatch between Ce3+ and Sm3+ is higher than that between Gd3+ and Sm3+. This in turn results in comparatively higher flux pinning in the SmCe10 sample than in SmGd10 at higher fields. The above reasons seem to be responsible for the better JC–H behavior of SmCe10 over the entire field studied.
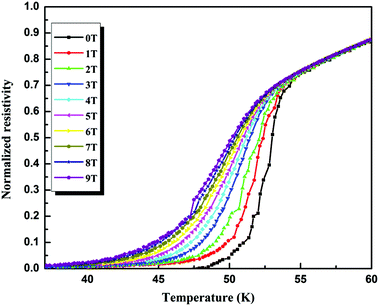
The HC2 values of the samples Sm3, SmCe10 and SmGd10, have been also evaluated from the temperature dependence of their resistivity under varying magnetic fields. Fig. 8 shows the field dependent ρ–T plots for the sample SmCe10 with the magnetic fields varying from 0 to 9 T. The transition width broadens with the applied magnetic field in which there is a considerable reduction in the TCoffset value with a slight decrease in TConset. This broadening was already reported in RE1111 pnictides and cuprate based superconductors and could be interpreted in terms of weak links or flux flow existing in the sample.40,41 Weak link behavior of our samples has been revealed from their AC magnetic susceptibility measurements and discussed earlier. The magnetic field and temperature dependence of the resistivity value give information about the upper critical field, HC2 and the irreversibility field, Hirr. The resistivity data was normalized with respect to the normal state resistivity at 65 K and then using the criteria of 90% and 10% of the normal state resistivity (ρn – resistivity value just above transition), both HC2 and Hirr was estimated. HC2 at zero temperatures for the samples is given by the Werthamer–Helfand–Hohenberg (WHH) formula HC2(0) = 0.693 × (dHC2/dT) × TC.42 The slope dHC2/dT was calculated from the temperature dependence plot of HC2.
Fig. 9 shows the H–T phase diagram i.e. the temperature dependence of both HC2 (closed symbol) and Hirr (open symbol) of the samples Sm3, SmCe10 and SmGd10, derived from the ρ–T plots at different magnetic fields. The dHC2/dT ∼ −5.4 T K−1 for Sm3, dHC2/dT ∼ −10.1 T K−1 for SmCe10 and dHC2/dT ∼ −9 T K−1 for SmGd10 are obtained from the H–T phase diagram and the corresponding HC2 (0) values are 170 T, 385 T and 340 T, respectively. Thus, a very high value of HC2 was achieved by rare-earth site doping in the SmFeAsO0.7F0.3 system, especially for the Ce3+ doped system. The Hirr values were also estimated following the same WHH formula, from the slope of the H–T curves corresponding to 10% ρn. The Hirr values obtained for the samples Sm3, SmCe10, and SmGd10 are 34.7, 51.1, and 46.5 T, respectively. We can see that the irreversibility field of the samples SmCe10 and SmGd10 are rather high compared to that of Sm3. Therefore, it is evident that simultaneous doping at the oxygen and rare earth site increases the number of effective pinning centres in the form of lattice defects and substantially increases the critical fields of the Sm1111 system. The enhanced JC (H) performance and very high upper critical fields in addition to the relatively high TC around 55 K confirm the significant enhancement of superconducting properties by rare earth-site doping in the SmFeAsO0.7F0.3 system.
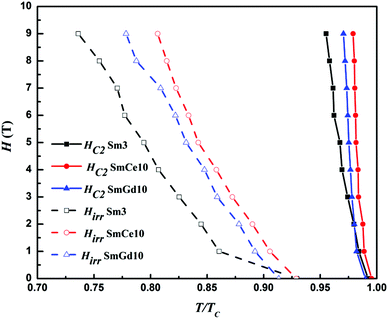 | ||
| Fig. 9 H–T phase diagram of the samples Sm3, SmCe10 and SmGd10; HC2 and Hirr were determined from 90% and 10% points on the ρ–T plots at different magnetic fields. | ||
Conclusions
In summary, rare-earth site doping in addition to F− doping at the O2− site has a significant impact on both structural and superconducting properties of SmFeAsO0.7F0.3. TC increased up to 55 K for both Gd3+ and Ce3+ doped samples. Even though Ce and Gd doping have their own signature in TC enhancement; both are found to increase the charge carrier concentration. Very high upper critical fields have also been obtained by rare earth site doping in SmFeAsO0.7F0.3. In addition, rare-earth site doping improves the critical current density of the samples throughout the entire range of the magnetic field studied. Enhanced flux pinning due to additional doping at the Sm3+ site is found to be responsible for the improved JC (H) performance. However, the higher lattice mismatch in Ce doped samples is found to have better pinning capability than the Gd doped samples especially in the high field region.Acknowledgements
J. B. Anooja, P. M. Aswathy and Neson Varghese acknowledge the Council for Scientific and Industrial Research (CSIR) for their research fellowships. The authors acknowledge the Department of Science & Technology (DST) and CSIR 12th Five Year Plan Project, “Sustainable technologies for the Utilization of Rare Earths (SURE),” (no. CSC0132) for financial support. We also thank Mr Ajeesh P. Paulose and Chithra H. Sharma for timely technical support.References
- Y. Kamihara, T. Watanabe, M. Hirano and H. Hosono, J. Am. Chem. Soc., 2008, 130, 3296 CrossRef CAS PubMed.
- X. H. Chen, T. Wu, G. Wu, R. H. Liu, H. Chen and D. F. Fang, Nature, 2008, 453, 761 CrossRef CAS PubMed.
- C. Senatore, R. Flükiger, M. Cantoni, G. Wu, R. H. Liu and X. H. Chen, Phys. Rev. B: Condens. Matter, 2008, 78, 054514 CrossRef.
- P. M. Aswathy, J. B. Anooja, P. M. Sarun and U. Syamaprasad, Supercond. Sci. Technol., 2010, 23, 073001 CrossRef.
- Z. A. Ren, W. Lu, J. Yang, W. Yi, X. L. Shen, Z. C. Li, G. C. Che, X. L. Dong, L. L. Sun, F. Zhou and Z. X. Zhao, Chin. Phys. Lett., 2008, 25, 2215 CrossRef CAS.
- Z. A. Ren, G. C. Che, X. L. Dong, J. Yang, W. Lu, W. Yi, X. L. Shen, Z. C. Li, L. L. Sun, F. Zhou and Z. X. Zhao, Europhys. Lett., 2008, 83, 17002 CrossRef.
- Z. Wei, H. Li, W. L. Hong, Z. Lv, H. Wu, X. Guo and K. Q. Ruan, J. Supercond. Novel Magn., 2008, 21, 213 CrossRef CAS.
- G. Fuchs, S. L. Drechsler, N. Kozlova, G. Behr, A. Köhler, J. Werner, K. Nenkov, R. Klingeler, J. Hamann-Borrero, C. Hess, A. Kondrat, M. Grobosch, A. Narduzzo, M. Knupfer, J. Freudenberger, B. Büchner and L. Schultz, Phys. Rev. Lett., 2008, 101, 237003 CrossRef CAS.
- J. Jaroszynski, S. C. Riggs, F. Hunte, A. Gurevich, D. C. Larbalestier, G. S. Boebinger, F. F. Balakirev, A. Migliori, Z. A. Ren, W. Lu, J. Yang, X. L. Shen, X. L. Dong, Z. X. Zhao, R. Jin, A. S. Sefat, M. A. McGuire, B. C. Sales, D. K. Christen and D. Mandrus, Phys. Rev. B: Condens. Matter, 2008, 78, 064511 CrossRef.
- I. I. Mazin, Nature, 2010, 464, 183 CrossRef CAS PubMed.
- N. D. Zhigadlo, S. Katrych, S. Weyeneth, R. Puzniak, P. J. W. Moll, Z. Bukowski, J. Karpinski, H. Keller and B. Batlogg, Phys. Rev. B: Condens. Matter, 2010, 82, 064517 CrossRef.
- K. Kasperkiewicz, J. W. G. Bos, A. N. Fitch, K. Prassides and S. Margadonna, Chem. Commun., 2009, 707–709 RSC.
- C. Lee, A. Iyo, H. Eisaki, H. Kito, M. T. Fernandezdiaz, T. Ito, K. Kihou, H. Matsuhata, M. Braden and K. Yamada, J. Phys. Soc. Jpn., 2008, 77, 083704 CrossRef.
- V. P. S. Awana, P. Anand, A. Vajpayee, R. S. Meena, H. Kishan, M. Husain, R. Zeng, S. Yu, K. Yamaura and E. Takayama-Muromachi, J. Appl. Phys., 2010, 107, 09E146 Search PubMed.
- W. Yi, J. Yang, X. L. Shen, W. Lu, Z. C. Li, Z. A. Ren, G. C. Che, X. L. Dong, F. Zhou, L. L. Sun and Z. X. Zhao, Supercond. Sci. Technol., 2008, 21, 125022 CrossRef.
- A. K. Ganguli, J. Prakash, S. J. Singh and S. Patnaik, Eur. Phys. J. B, 2010, 73, 177 CrossRef CAS.
- L. Vegard, Z. Phys., 1921, 5, 17 CrossRef CAS.
- Y. Ding, Y. Sun, J. C. Zhuang, L. J. Cui, Z. X. Shi, M. D. Sumption, M. Majoros, M. A. Susner, C. J. Kovacs, G. Z. Li, E. W. Collings and Z. A. Ren, Supercond. Sci. Technol., 2011, 24, 125012 CrossRef.
- J. B. Anooja, P. M. Aswathy, P. M. Sarun and U. Syamaprasad, J. Alloys Compd., 2012, 514, 1 CrossRef CAS PubMed.
- A. L. Solov'ev and V. M. Dmitriev, Low Temp. Phys., 2009, 35, 169 CrossRef PubMed.
- E. Arushanov, G. Fuchs, S. Levcenko, S. L. Drechsler, B. Holzapfel and L. Schultz, Supercond. Sci. Technol., 2011, 24, 105004 CrossRef.
- M. Tropeano, C. Fanciulli, F. Canepa, M. R. Cimberle, C. Ferdeghini, G. Lamura, A. Martinelli, M. Putti, M. Vignolo and A. Palenzona, Phys. Rev. B: Condens. Matter, 2009, 79, 174523 CrossRef.
- S. L. Shi, A. H. Fang, X. M. Xie, F. Q. Huang and M. H. Jiang, Chem. Mater., 2011, 23, 3039 CrossRef CAS.
- J. L. Yang, W. J. Ren, D. Li and Z. D. Zhang, J. Appl. Phys., 2011, 109, 07E154 Search PubMed.
- P. M. Shirage, K. Miyazawa, H. Kito, H. Eisaki and A. Iyo, Phys. Rev. B: Condens. Matter, 2008, 78, 172503 CrossRef.
- W. Yi, C. Zhang, L. Sun, Z. Ren, W. Lu, X. Dong, Z. Li, G. Che, J. Yang, X. Shen, X. Dai, Z. Fang, F. Zhou and Z. Zhao, Europhys. Lett., 2008, 84, 67009 CrossRef.
- A. S. Sefat, Rep. Prog. Phys., 2011, 74, 124502 CrossRef.
- H. Takahashi, K. Igawa, K. Arii, Y. Kamihara, M. Hirano and H. Hosono, Nature, 2008, 453, 376 CrossRef CAS PubMed.
- Y. Takabayashi, M. T. McDonald, D. Papanikolaou, S. Margadonna, G. Wu, R. H. Liu, X. H. Chen and K. Prassides, J. Am. Chem. Soc., 2008, 130, 9242–9243 CrossRef CAS PubMed.
- W. Yi, L. Sun, Z. Ren, W. Lu, X. Dong, H. J. Zhang, X. Dai, Z. Fang, Z. Li, G. Che, J. Yang, X. Shen, F. Zhou and Z. Zhao, Europhys. Lett., 2008, 83, 57002 CrossRef.
- A. Alam and D. D. Johnson, Phys. Rev. B: Condens. Matter, 2014, 89, 235126 CrossRef.
- S. C. Riggs, R. D. McDonald, J. B. Kemper, Z. Stegen, G. S. Boebinger, F. F. Balakirev, Y. Kohama, A. Migliori, H. Chen, R. H. Liu and X. H. Chen, J. Phys.: Condens. Matter, 2009, 21, 412201 CrossRef PubMed.
- H. Salamati and P. Kameli, J. Magn. Magn. Mater., 2004, 278, 237 CrossRef CAS PubMed.
- M. Polichetti, M. G. Adesso, D. Zola, J. L. Luo, G. F. Chen, Z. Li, N. L. Wang, C. Noce and S. Pace, Phys. Rev. B: Condens. Matter, 2008, 78, 224523 CrossRef.
- G. Bonsignore, A. A. Gallitto, M. L. Vigni, J. L. Luo, G. F. Chen, N. L. Wang and D. V. Shovkun, J. Low Temp. Phys., 2011, 162, 40 CrossRef CAS.
- A. Yamamoto, A. A. Polyanskii, J. Jiang, F. Kametani, C. Tarantini, F. Hunte, J. Jaroszynski, E. E. Hellstrom, P. J. Lee, A. Gurevich, D. C. Larbalestier, Z. A. Ren, J. Yang, X. L. Dong, W. Lu and Z. X. Zhao, Supercond. Sci. Technol., 2008, 21, 095008 CrossRef.
- Y. J. Cui, Y. L. Chen, C. H. Cheng, Y. Yang, Y. Zhang and Y. Zhao, J. Supercond. Novel Magn., 2010, 23, 625 CrossRef CAS.
- C. P. Bean, Phys. Rev. Lett., 1962, 8, 250 CrossRef.
- J. M. Seuntjens and D. C. Larbalestier, J. Appl. Phys., 2007, 67, 1990 Search PubMed.
- Z. Gao, L. Wang, Y. Qi, D. Wang, X. Zhang, Y. Ma, H. Yang and H. Wen, Supercond. Sci. Technol., 2008, 21, 112001 CrossRef.
- Y. Sun, Y. Ding, J. C. Zhuang, L. J. Cui, X. P. Yuan, Z. X. Shi and Z. A. Ren, Supercond. Sci. Technol., 2011, 24, 085011 CrossRef.
- N. R. Werthamer, E. Helfand and P. C. Hohenberg, Phys. Rev., 1966, 147, 295 CrossRef CAS.
Footnote |
| † Electronic supplementary information (ESI) available. See DOI: 10.1039/c5qi00047e |
| This journal is © the Partner Organisations 2015 |

