Nucleation and growth of surfactant-passivated CdS and HgS nanoparticles: Time-dependent absorption and luminescence profiles†
S. K.
Mehta
*,
Sanjay
Kumar
,
Savita
Chaudhary
and
K. K.
Bhasin
Department of Chemistry and Centre for Advanced Studies in Chemistry, Panjab University, Chandigarh 160014, India. E-mail: skmehta@pu.ac.in; Fax: +91 172 2545074; Tel: +91 172 2534423
First published on 14th October 2009
Abstract
In this study, we have monitored the formation of CdS and HgS nanoparticles (NPs) using a precipitation method in the presence of surface-active agents. Three surfactants were tested to analyze the dependence of various parameters such as size, growth rate, photoluminescence (PL) emission and polydispersity of NPs on surfactant structure. Optical absorption spectroscopy was mainly used to estimate the optical bandgap and the size of NPs. The surfactant-induced quenching of PL intensity was found to be consistent with the different tendencies of the surfactants to act as Lewis acids towards these surfaces. The time-evolution of the absorbance suggested that the nucleation and growth rates markedly vary in a first-order fashion w.r.t. Cd2+ and Hg2+ salt concentration in excess of sulfide ions. The differences in the stabilization ability of the surfactants are discussed in reference to their structure-dependent adsorption behavior onto the particles. The comparative aspects of the different properties of CdS and HgS NPs prepared with identical methodology are presented in terms of metal cation–surfactant interactions. Changes in UV–vis and PL spectra during nucleation and growth of NPs were used to establish the possible mechanisms for the adsorption of surfactant molecules on the particle surface to restrict the unlimited growth.
1. Introduction
Controlling the shape, size and structure of semiconductor nanomaterials remains a key goal in current material science because of the strong dependence of their unique properties, such as photostability, bright photoluminescence, narrow and broad emission, on these parameters.1–3 Among these materials, CdS and HgS are typical wide-direct-bandgap semiconductors having a bandgap of 2.42 and 2.0 eV respectively at room temperature. Specifically, these materials have immense potential applications in light-emitting diodes, optical detectors, solar cells and other photoelectric devices.4–7 The fundamental application problem of these semiconducting NPs is connected with the insufficient stability of their dispersions and generation of large aggregates when dry that lead to loss of their special nanoscale properties. In aqueous media, the nanosized particles are mainly dispersed by the ionic repulsion forces generated due to different adsorbed species on their surface.8–12 In this context, surfactant-supported stabilization of the NPs in aqueous solution has been proven to be one of the most effective methods. In contrast to their bare counterparts, these NPs remains well dispersed in solution for a long time. Various surfactants can tune NP shape, size and other surface properties to different extents depending on their molecular structure i.e. the nature of head group, the length of the hydrophobic tail and type of counter ions. Existing experimental studies explain the self-assembly of CdS and HgS NPs and their properties in the presence of surfactants with the help of some simple parameters.13–17 Shankar et al.18 explained the improved optoelectronic properties of CdS NPs within thermally evaporated thin films of sodium bis(2-ethylhexyl) sulfosuccinate; aerosol OT (AOT) by electrostatic entrapment of Cd2+ ions and observed some patterned structures of nanoparticulate CdSthin films . Yu et al.19 used a hyper-Rayleigh scattering (HRS) technique to measure the first-order hyperpolarizability, β, of CdS NPs using the anions of the surfactantbis(2-ethylhexyl)sulfosuccinate, disodium salt (named AOT–SO3−) and pyridine. Zhu and co-workers20 developed a surfactant-assisted photochemical method to prepare single-crystalline mercury sulfide (α-HgS) nanotubes. In addition, the absorption and emission characteristics of these NPs are quite complex and needed to be explored under different surface passivations and synthesis conditions. There are some reports involving the effect of surfactants on the PL of semiconductor NPs. Hamity and co-workers21 investigated the fluorescence quenching effect of tetraalkylammonium salts (R4NCl) as analogs of cationic surfactants and alkylsulfate salts (NaRSO4) as analogs of anionic surfactants on CdS quantum dots which exhibit an isolated excitonic or trapped fluorescence band. Recently, they observed the fluorescence quenching of CdS QDs by several different surfactants, e.g., cetyltrimethylammonium chloride (CTAC), sodium dodecyl sulfate (SDS), and Triton X-100, based on different quenching processes.22 None of the prior studies on surfactant–NP systems, addressed the comparative role of one particular series of surfactants on the photophysical properties of CdS and HgS NPs specifically in reference to their growth processes. Moreover, for several applications, it is desirable that the unique optical properties of semiconductor NPs are not affected by the stabilizing agent. Therefore, comparative investigations of the optical properties of NPs in the presence of different surfactants would be valuable to identify their suitability for various applications.Here, CdS NPs with different cationic surfactants as passivating agents have been synthesized in aqueous media. The purpose of this paper is to explore the optical and PL properties of CdS NPs during nucleation and growth in the presence of cationic surfactants that could be useful in understanding the origin of these properties. With an intention to establish whether results related to surfactant-assisted synthesis of semiconducting NPs of one material could be equally applicable on the others, we have also synthesized HgSNPs under identical conditions and the comparative aspects of the results have been presented. To the best of our knowledge, such a comparative study on time-dependent UV absorption and PL emission behavior during the evolution of CdS and HgS NPs has never been reported. The structures of the three surfactants used in the syntheses, having same hydrophobic chain length (C16) with different head group and counter ions, are shown in Fig. 1.
 | ||
| Fig. 1 Molecular structures of the surfactants. | ||
2. Result and discussions
2.1. Shape, size and crystal structure of CdS and HgS NPs
In aqueous solution, surfactants with cationic head groups control the synthesis of metal sulfide semiconductor NPs by binding S2− ions generated by Na2S. Thereafter, the adsorption of surfactantvia ion pairing or polarization of the electrons in electron-rich aromatic nuclei i.e. pyridinium rings having 6 π-electrons, passivates the surface of NPs once formed. Here we have tested three cationic surfactants to determine how the head group and counter ions would affect the function of the surfactant in controlling both the sizes and optical properties of the CdS and HgS NPs. The generation of CdS and HgS NPs in aqueous micellar, solutions of cationic surfactants can be preliminarily identified by visual inspection of any color change as well as by taking the UV–vis spectrum of the resultant dispersions. Each of the surfactant solutions containing Na2S were colorless, transparent and exhibited a UV–vis absorption peak at 229 nm. After the addition of Cd2+, the appearance of a pale-yellow color indicates the formation of CdS NPs whereas the color change for HgSNPs is the appearance of a light-brown color that changes to dark-brown with time.In the absence of any surfactant, CdS and HgS precipitated within 30 min due to the unlimited growth of crystals. The UV–vis absorption spectra of the obtained dispersions of CdS and HgS NPs were recorded after one hour and the spectra are shown in Fig. 2. Each spectrum shows an absorption onset in the range of 480–490 nm and 495–502 nm for CdS and HgS NPs respectively in different surfactants with the disappearance of the peak at 229 nm. As compared to the UV absorption of the bulk sulfides, the apparent blue-shift in the absorption edges of CdS and HgS NPs indicates that the NPs may be near or within the quantum confinement regime.23 In addition, the UV–vis spectra of CdS NPs display characteristic shoulders in the 390–410 nm regions. The extent of the blue-shift in the absorption edge for both the NP types has been found to be surfactant dependent. The sizes and morphologies of NPs in different surfactants have been imaged using transmission electron microscopy (TEM) (Fig. 3). The intensity size-distribution histograms of the NPs in each surfactant as obtained from a zetasizer are given below the respective micrographs. From the TEM images, all of the NPs appear to be almost spherical and only small variations were observed in the average particle sizes synthesized in different surfactants. However, bimodal size distributions were observed in all cases which significantly depend upon the surfactant–NP system. The size distributions were observed to be more narrow for CdS NPs as compared to HgSNPs in all the three surfactants and much narrower in cetylpyridinium chloride (CPyC) for both types of NPs. The small difference in the sizes of CdS NPs obtained by the zetasizer compared to other techniques is justifiable as the zetasizer measures the hydrodynamic radii of the nanodispersions that includes both the size of the adsorbed surfactant layer and the water of hydration. However, other techniques measure the size of CdS NPs without taking into account the surroundings. Fig. S1 of the ESI† shows the plots for the optical bandgap determination of CdS NPs and HgSNPs. The NP sizes were calculated from the bandgap values using the effective mass approximation (EMA).24 There are known shortcomings to this model, which include surface effects that become more prominent for very small particles.25 Nevertheless, this model is widely used in the literature and is sufficient for our comparative study. The optical bandgap values and average sizes of NPs in three surfactants calculated using the EMA are given in Table 1. Only small variations were observed in the bandgap values and average sizes of the NPs capped with different surfactants.
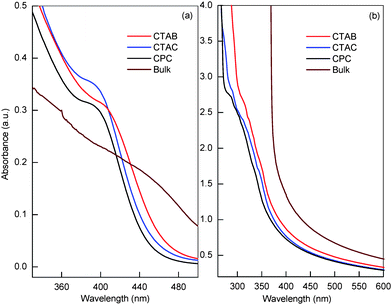 | ||
| Fig. 2 UV–vis absorption spectra of bulk and (a) CdS and (b) HgSNPs in aqueous micellar solution of three cationic surfactants. | ||
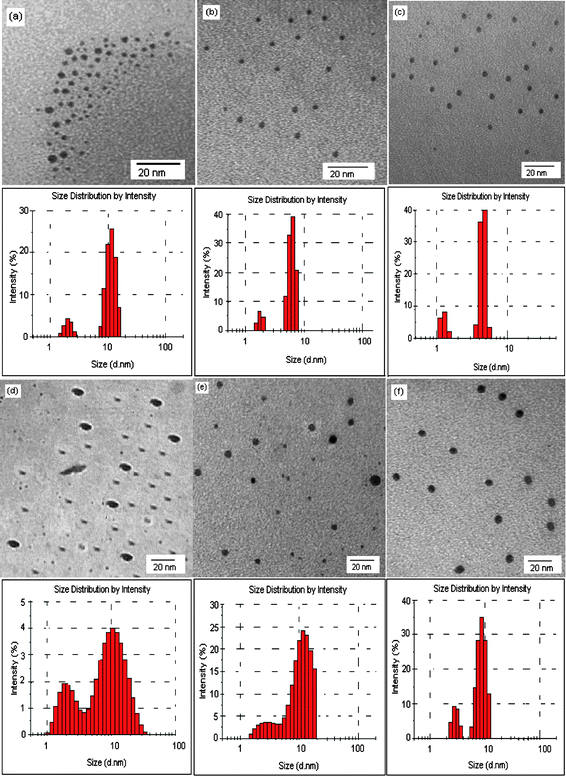 | ||
| Fig. 3 TEM images of CdS NPs (a,b,c) and HgSNPs (d,e,f) formed in aqueous micellar solutions of CTAB, CTAC and CPyC respectively. Particle size-distribution histograms as obtained from a zetasizer are given under each respective image. | ||
It is evident from Table 1 that particle-size dependence on the type of surfactant for either of the NP types is less consistent than particle-size dependence on metal cation (Cd2+ or Hg2+) for a given surfactant. For both CdS and HgS NPs, the size has been found to be smallest in the presence of CPyC and largest in cetyltrimethylammonium bromide (CTAB); whereas NPs of intermediate size were produced in the presence of CTAC. These differences can be attributed to the different adsorption tendencies of surfactants onto the particle surface depending upon their hydrophilic head group and counter ions.26 In addition, the interactions of Cd2+ or Hg2+ ions with surfactants are responsible for the differences in sizes of CdS and HgS NPs in a given surfactant. Under identical experimental conditions, in a given surfactant the average size as well as the size-range is found to be larger for HgSNPs as compared to that of CdS.
The crystal structure of the obtained CdS and HgS NPs in three surfactants was established by X-ray powder diffraction (XRD) and the typical diffractograms are shown in Fig. 4. On comparison with standard JCPDS database values, all the peaks can be indexed to pure cubic CdS and cubic β-HgS with some noise peaks due to the presence of surfactant. It is also remarkable that all the XRD patterns of CdS and HgS NPs have been found to be similar irrespective of the surfactants used for synthesis (Fig. S2 of the ESI† ). It is therefore obvious to conclude that all three surfactants lead to the same average NP size in powder form and that the structure-dependent tendencies of the surfactants towards stabilization of NPs are significant only in aqueous solution. Chae et al.27 reported comparative XRD studies for spherical and rod-shaped CdS NPs and found that the diffraction patterns were NP-shape dependent. The diffraction pattern in our case resembles those reported for spherical CdS NPs. This can be taken as being indicative of the formation of spherical CdS NPs in all three surfactants and was further confirmed from scanning electron microscopy (SEM) images in Fig. 4 (a,b) of powdered samples clearly depicting spherical particles with some aggregates.
 | ||
| Fig. 4 XRD patterns of CdS and HgS NPs separated from an aqueous micellar solution of CTAB and their respective SEM images shown at the right. | ||
However, it is clear from Fig. 4 that the diffraction peaks due to CdS NPs are relatively broader and smoother as compared to those of HgSNPs, indicating the formation of smaller CdS NPs than those of HgS, consistent with SEM observations. The role of surfactants again comes into play after the powdered NPs were re-suspended in water and the suspensions were the most stable for the NPs prepared in CPyC. From the broadening of XRD peaks, the sizes of the nanocrystallites were calculated using the Debye–Scherrer formula28 and the average crystallite sizes were found to be 2.1 ± 0.1 and 12.2 ± 0.3 nm for CdS and HgS NPs respectively. The sizes of both types of NPs, as obtained from powder XRD, overestimate the size obtained by TEM and the bandgap values. Qualitatively, this size difference is justified as the XRD method does not take into account the other contributions (e.g. lattice defects, dislocations, faulting, and lattice strain) to line broadening.29
2.2. PL emission behavior of CdS and HgS NPs
We have examined the PL emission properties of CdS and HgS NPs to monitor surface–adsorbate adduct formation as a measure of the stabilization tendencies of the surfactants towards the NPs. Fig. 5 presents the PL emission spectra of aqueous suspensions of CdS and HgS NPs in the presence of three surfactants. It is important to mention here that what is observed is not the band-edge emission, but the emission due to the radiative recombination of charge carriers immobilized in deep-trap states of different energies.30 An increase in the intensity of the PL signal of CdS NPs at 427 nm in the presence of surfactants as compared to bulk CdS (without surfactant) has been clearly observed. This increase has been found to be related to surface defects in small particles that act as traps for the excitons producing luminescence as compared to the very few and/or inaccessible traps in large crystals.23 It is also noteworthy that enhanced PL, as a method for characterizing passivation, depends heavily on the nature of the surfactant. Several researchers have reported that the adsorbing Lewis acids draw electrons from the semiconductor bulk to surface states and quench the PL intensity, whereas adsorbing Lewis bases enhance the PL intensity.31 | ||
| Fig. 5 PL emission spectra of CdS NPs prepared in aqueous micellar solutions of (a) CTAB, (b) CTAC, (c) CPyC and (d) without any surfactant. PL spectra of HgSNPs are shown in the inset. | ||
The cationic surfactants (having ammonium and pyridinium head groups) acting as Lewis acids towards the NP surface can stabilize the surface states of the CdS semiconductor to different extents depending on their structure. Also, the surface states of smaller particles can be easily stabilized due to the large percentage of atoms on or near the surface, and show less PL due to the more efficient transfer of electrons to suitable species adsorbed on the surfaces.32 As described above, the lowest PL intensity in the presence of CPyC is consistent with the smallest CdS NPs leading to effective passivation. The UV-absorption size calculations also support these findings and the NPs were found to be larger in CTAC and still larger in CTAB and hence the PL intensity increases accordingly. Furthermore, the pyridinium ring of CPyC can act as a better Lewis acid (as compared to the trimethylammonium head group of CTAB and CTAC) due to resonance on the ring, and can stabilize the electrons to be transferred from the NP surface more efficiently therefore quenching the PL intensity.31 On this basis, as CTAB and CTAC have identical head groups i.e. trimethylammonium and hence similar Lewis acid strength; therefore one would expect the same PL intensity for CdS NPs in these two surfactants. However, the decrease in PL intensity in CTAC as compared to CTAB can be attributed to counter-ion-dependent strong binding of CTAC to the surface leading to efficient surface passivation. Ravindern et al.33 calculated the effect of particle-size distributions on the PL spectrum of CdS NPs and observed that superposition of the contributions from each individual particle would result in inhomogeneous broadening of the PL spectrum. Hence, the full width at half maximum (FWHM) of the PL emission peak can be taken as a measure of the size distribution, and peak broadening is indicative of polydispersed NPs. It can be clearly interpreted from the PL emission peak for CdS NPs in CTAB and CTAC, that the NPs are almost equally polydispersed (CTABFWHM = 119 ± 4 nm; CTABFWHM = 125 ± 4 nm) as compared to the narrow size-distribution in the presence of CPyC (FWHM = 87 ± 4 nm). These results have been found to be in good agreement with the size distributions of CdS NPs as measured using the zetasizer, within the technique-based measurement errors.
The PL properties of HgSNPs stabilized with different stabilizers have not been explored much. Recently, some groups have reported fluorescence spectra of HgS in the visible range.12,34 However we do not observe any PL spectra of HgS in any of the surfactants in the wavelength range of 400–800 nm (Inset Fig. 5) though different excitation wavelengths between 300–420 nm were tried. It is not possible to provide any definitive explanation for such a behaviour at this stage in the absence of any strong evidence about the formation of NPs without any surface-defect related trap-states or complete passivation of trap-states by surfactants. However, Herron et al.35 explained the change in the nature of emitting states as being a result of the size and type of NP. However, it is also possible that the lack of any strong emitting surface state is an intrinsic property of the materials made using this procedure.
2.3. Kinetics of NP formation and time-dependent PL emission properties
The UV–vis absorbance of semiconductor NPs is directly proportional to the number of absorbing species i.e. the concentration of NPs formed during the process. Therefore, the process of particle formation and growth can be monitored by UV–vis spectroscopy by measuring the absorbance as a function of the time elapsed after the addition of metal acetates. The effect of surfactant on the kinetics of nucleation and growth of CdS and HgS NPs in aqueous micellar solutions was measured by monitoring the absorbance changes at 395 nm for CdS and 400 nm for HgSNPs (Fig. 6). For comparison sake, the time-dependent UV–vis spectra and absorbance profiles were taken under identical conditions by keeping the concentrations of surfactants (3 mM) as well as that of metal ions (0.7 mM) the same in each system. The initial absorbance values indicate that the nucleation was instantaneous and most of the nuclei formed within the mixing time of 30–35 s before starting the absorbance measurements. The much steeper upward trend in the first few minutes and the time taken to reach a plateau significantly depends upon surfactant–metal cation interactions. At a constant surfactant concentration (3 mM) and an excess of sodium sulfide, the formation of CdS and HgS NPs can be assumed to follow pseudo first-order kinetics and the absorbance profiles in Fig. 6 are equivalent to fits by a first-order rate equation36| At = A∞(1 − e−kt) | (1) |
 | ||
| Fig. 6 Time evolution of the absorbance of (a) CdS NPs at λ = 395 nm and (b) HgSNPs at λ = 400 nm in the presence of different surfactants. | ||
However, the influence of changing the head group (from pyridinium to trimethylammonium) on increasing the rate constant has been found to be 3.7 times for CdS and 1.6 times for HgSNPs. The CdS NPs in CTAC show exceptionally high value of rate constant as compared to any others reflecting its unique behavior of the surfactant in stabilizing CdS NPs. This unique behaviour of CTAC is also evident from the time-dependent PL emission profiles discussed in next section of this paper. As given in Fig. 1, the critical micelle concentration (cmc) of CTAC is about 1.5 times than that of CTAB and CPyC, therefore more detailed adsorption-/aggregation-dependent studies are needed to justify the anomalous behavior of CTAC, and will be explored separately. It is also observed from Fig. S4 (of the ESI† ) that along with the increase in absorbance, the position of UV–vis spectra of CdS NPs has also been red-shifted with time to reach some limiting value that depends upon the type of surfactant. This can be attributed to growth of the small-nucleated NPs to reach a stable critical size along with the formation of some new nuclei.
It is interesting to note from Fig. S4 (of the ESI† ) that in the case of CdS NPs the red-shift is not observed in the whole spectra, but only in a particular portion that displays almost no change in absorption edges and beautiful isosbestic behavior at 388 ± 5 nm. Also, the portion of the CdS NPsspectra to undergo red-shift and the extent of the shift have been found to be surfactant dependent. From Fig. 7 it is evident that below the isosbestic wavelength the time-dependent absorbance profile display the reverse trend i.e. a decrease in absorbance with time. As already suggested by Ma et al.,37 aggregation of smaller NPs that show UV–vis absorbance at a particular wavelength is accompanied by loss of absorbance at that wavelength. On the basis of above observations, we believe that the CdS NPs of a particular size range, that give rise to absorbance above the isosbestic wavelength, grow at the expense of very small particles absorbing below the isosbestic wavelength with almost no effect on the very large particles that contribute to the near-band-edge UV–vis absorption. On the other hand, unlike CdS NPs, the HgSNPs display a growth-dependent red-shift in the whole range of the UV–vis spectrum without showing any isosbestic behavior (Fig. S5 of the ESI† ). However, the UV–vis spectral red-shift has been found to be surfactant-dependent with a similar pattern observed to CdS NPs. As discussed in the previous section, the surfactant molecules interact with the surfaces of NPs and thereby modulate their emission properties. The change in emitting states of CdS NP during growth and/or adsorption of surfactants can be useful in understanding the origins of the changes in PL properties. For this purpose, the suspensions of CdS NPs in the absence and presence of the three surfactants were photoactivated with wavelength of 380 nm, immediately after formation, and the PL emission intensity was recorded as a function of time.
 | ||
| Fig. 7 Time dependent UV–vis absorption behavior of CdS NPs. (a) Loss of absorbance with time at λ = 380 nm in the presence of different surfactants. (b) The shift in the UV–vis spectra with time, showing isosbestic behavior. | ||
The PL intensity profiles are presented in Fig. 8. Interestingly in the presence of three surfactants, the CdS NPs show different PL intensity profiles reflecting the unique structure-dependent adsorption onto the CdS NP surface. It was reported earlier that the growth of particles leads to quenching of PL intensity due to changes in surface states.32 It is also evident from Fig. 8(a) that PL intensity decreases with precipitation of CdS due to growth in the absence of any surfactant. Finally, CdS crystals not settled within 40 min lead to noise in the PL intensity profile. However, in the presence of surfactant, two opposing factors will decide the resultant PL intensity profile. First, the initial fast nucleation generating new emitting species i.e.CdS NPs, results in an increase in PL intensity and second, growth and surfactant adsorption leads to decrease in PL intensity due to change in the surface states.31
 | ||
| Fig. 8 Time evolution of PL intensity of CdS NPs suspensions at λ = 528 nm (a) without any surfactant and in the presence of (b) CTAB, (c) CTAC, (d) CPyC. | ||
In CTAB, the initial sharp rise in PL intensity can be attributed to the initial dominance of the first factor i.e. nucleation and then the second factor starts dominating to reach a plateau of PL peak intensity where both the factors counterbalance each other after reaching the critical NP size. Similar profiles have been evidenced in CPyC, but the second factor could not outweigh the first, due to the slow growth and continuous nucleation of small CdS NPs as is also evident from their time-dependent UV–vis absorbance behaviour. In contrast, the PL intensity profile of CdS in CTAC show the reverse trend i.e. a decrease in PL intensity probably due to the fast growth, and fast and stiff adsorption of CTAC that overcomes the first factor leading to overall quenching of PL intensity. In order to confirm whether there is any shift in the PL peak to lower or higher energies with time, we also recorded the PL emission spectra at different time intervals immediately after formation of CdS NPs (30–35 s delay time from mixing) in aqueous micellar solutions of the three surfactants for 16 min. The PL peaks of CdS NPs in CTAB and CPyC show almost no shift with time, whereas the PL peaks in CTAC has been found to be slightly red-shifted, confirming the fast growth that overpowers the nucleation.
3. Experimental section
3.1. Materials and methods
Cadmium acetate (Cd(OAc)2, 99%) and sodium sulfide (Na2S.xH2O, 58% assay ) were purchased from CDH, India. Mercuric acetate (Hg(OAc)2, 99%) and CPyC (99%) were purchased from Himedia Laboratories, India. CTAB (99%) was purchased from Sigma Aldrich, India and CTAC (25% in water) was purchased from Fluka. All the chemicals were used as received without further purification. Water used in the preparation of solutions and suspensions was double distilled.3.2. Preparation of surfactant stabilized CdS and HgS NPs
Syntheses of CdS and HgS NPs using three cationic surfactants were performed using a molar ratio of 1 : 2 for metal acetate:Na2S at room temperature. Typically, 5 ml of a 3 mM surfactant solution containing 0.5 mM cadmium acetate was added into another containing 1 mM Na2S with the same surfactant concentration. The appearance of pale-yellow hydrosol manifested the formation of CdS NPs. A similar procedure was followed for the formation of HgSNPs by taking mercuric acetate and the color that appeared was dark-brown. As will be shown, the final concentration of NPs and the time needed for the formation of stable NPs depends on the kind of surfactant and NPs. The NPs were separated by slow evaporation of solvent at 50–60 °C, washed with water and then with ethanol repeatedly to obtain a fine powder of NPs containing the minimum surfactant.3.3. Characterization techniques
Particle size distribution was measured with a particle size analyzer (Malvern, Zetasizer Zen 3600) by illuminating the aqueous colloidal suspension of as-prepared NPs with a He–Ne laser.
4. Conclusions
All the three cationic surfactants used in this study have been proven to be ideal surface passivating agents to obtain CdS and HgS NPs stabilized enough in aqueous media with a small size range. The surfactant head group and counter ions do affect the size of both types of NPs in aqueous media, though not very significantly. Under identical conditions, the efficiency of surfactants in controlling the size of NPs has also been found to depend upon surfactant–metal ion interactions, thus stabilizing CdS NPs at smaller sizes as compared to HgSNPs. When extracted from aqueous solutions, the NP size averages to the same values irrespective of the nature of the surfactants, making us conclude that the separation method needed to be modified to maintain the particle sizes in powder form also. The surfactants as Lewis acids, serve to modulate the emission properties of the particles to different extents and CPyC is believed to be most efficient in stabilizing the electron density to be transferred from the surface of the CdS NPs and witnessed the maximum PL quenching. The exceptionally high rate constant, k, for the growth of CdS NPs in CTAC and the reverse trend in time-dependent PL intensity profiles, opens up new avenues to extend the study to other semiconductor NPs in order to explore the origin of these changes.Acknowledgements
Sanjay Kumar is thankful to CSIR, India, for a senior fellowship. SKM is grateful to DST for financial assistance. The authors would like to thank SAIF, at the Panjab University Chandigarh for their assistance in sample characterization.References
- A. P. Alivisatos, Science, 1996, 271, 933–937 CrossRef CAS.
- A. L. Efros, M. Rosen, M. Kuno, M. Nirmal, D. J. Norris and M. G. Bawendi, Phys. Rev. B: Condens. Matter Mater. Phys., 1996, 54, 4843–4856 CrossRef CAS.
- M. Kuno, J. K. Lee, B. O. Dabbousi, F. V. Mikulec and M. G. Bawendi, J. Chem. Phys., 1997, 106, 9869–9882 CrossRef CAS.
- D. Routkevitch, T. Bigioni, M. Moskovits and J. Ming Xu, J. Phys. Chem., 1996, 100, 14037 CrossRef CAS.
- D. Xu, Y. Xu, D. Chen, G. Guo, L. Gui and Y. Tang, Adv. Mater., 2000, 12, 520 CrossRef CAS.
- D. Xu, Y. Xu, D. Chen, G. Guo, L. Gui and Y. Tang, Chem. Phys. Lett., 2000, 325, 340 CrossRef CAS.
- J. Zhan, X. G. Yang, D. W. Wang, S. D. Li, Y. Xie, Y. Xia and Y. Qian, Adv. Mater., 2000, 12, 1348 CrossRef CAS.
- C. H. Chou, H. S. Wang, K. H. Wei and J. Y. Huang, Adv. Funct. Mater., 2006, 16, 909–916 CrossRef CAS.
- A. Priyam, A. Chatterjee, S. K. Das and A. Sah, Chem. Commun., 2005, 4122–4124 RSC.
- H. S. Zhou, H. Sasahara, I. Honma, H. Komiyama and J. W. Haus, Chem. Mater., 1994, 6, 1534–1541 CrossRef CAS.
- V. Biju, R. Kanemoto, Y. Matsumoto, S. Ishii, S. Nakanishi, T. Itoh, Y. Baba and M. Ishikawa, J. Phys. Chem. C, 2007, 111, 7924–7932 CrossRef CAS.
- D. Z. Qin, X. M. Ma, L. Yang, L. Zhang, Z. J. Ma and J. Zhang, J. Nanopart. Res., 2008, 10, 559–566 CrossRef CAS.
- B. Liu, G. Q. Xu, L. M. Gan, C. H. Chew and W. S. Li, J. Appl. Phys., 2001, 89, 1059 CrossRef CAS.
- W. Que, Y. Zhou, Y. L. Lam, Y. C. Chan and C. H. Kam, Appl. Phys. Lett., 1998, 73, 2727 CrossRef CAS.
- I. Chakraborty, D. Mitra and S. P. Moulik, J. Nanopart. Res., 2005, 7, 227–236 CrossRef CAS.
- J. Jin, L. Li, Y. Tian, Y. Zhang, Y. Liu, Y. Zhao, T. Shi and T. Li, Thin Solid Films, 1996, 327, 559–562.
- Y. Zhang, M. Mab, X. Wang, D. Fu, H. Zhang, N. Gu, J. Liu, Z. Lu, L. Xu and K. Chena, J. Phys. Chem. Solids, 2003, 64, 927–931 CrossRef CAS.
- S. Shiv Shankar, S. Chatterjee and M. Sastry, PhysChemComm, 2003, 6, 36–39 RSC.
- Z. Yu, F. Degang, W. Xin, L. Juzheng and L. Zuhong, Colloids Surf., A, 2001, 181, 145–149 CrossRef.
- T. Ren, S. Xu, W. B. Zhao and J. J. Zhu, J. Photochem. Photobiol., A, 2005, 173, 93–98 CrossRef CAS.
- M. Hamity, R. H. Lema and C. A. Suchetti, J. Photochem. Photobiol., A, 1998, 115, 163–168 CrossRef CAS.
- M. Hamity, R. H. Lema and C. A. Suchetti, J. Photochem. Photobiol., A, 2000, 133, 205–211 CrossRef CAS.
- Y. Wang and N. Herron, J. Phys. Chem., 1991, 95, 525–532 CrossRef CAS.
- Y. Kayanuma, Solid State Commun., 1986, 59, 405 CrossRef CAS.
- S. Nunes, Z. Zhou, J. D. Evansek and J. D. Madura, Encyclopedia of Nanoscience and Nanotechnology ed. J. A. Schwarz, C. I. Contescu and K. Puttiera, Dekker, New York, 2004, pp. 787 Search PubMed.
- S. Paria and K. C. Khilar, Adv. Colloid Interface Sci., 2004, 110, 75 CrossRef CAS.
- W. S. Chae, H. W. Shin, E. S. Lee, E. J. Shin, J. S. Jung and Y. R. Kim, J. Phys. Chem. B, 2005, 109, 6204–6209 CrossRef CAS.
- R. Jenkins and R. L. Snyder, Introduction to X-ray powder diffractions, John Wiley & Sons Inc., New York, 1996, ch. 1, pp. 89–91 Search PubMed.
- P. Scardi and M. Leoni, Acta Crystallogr., Sect. A: Found. Crystallogr., 2002, 58, 190–200 CrossRef CAS.
- L. Spanhel, M. Haase, H. Weller and A. Henglein, J. Am. Chem. Soc., 1987, 109, 5649–5655 CrossRef CAS; D. P. S. Negi and T. I. Chanu, Nanotechnology, 2008, 19, 465503 CrossRef.
- K. D. Kepler, G. C. Lisensky, M. Patel, L. A. Sigworth and A. B. Ellis, J. Phys. Chem., 1995, 99, 16011–16017 CrossRef CAS and references therein.
- X. L. Diao, Y. S. Xia, T. L. Zhang, Y. Li and C. Q. Zhu, Anal. Bioanal. Chem., 2007, 388, 1191 CrossRef CAS.
- T. R. Ravindran, A. K. Arora, B. Balamurugan and B. R. Mehta, Nanostruct. Mater., 1999, 11, 603–609 CrossRef CAS.
- P. S. Nair, T. Radhakrishnan, N. Revaprasadu, G. A. Kolawole and P. O. Brien, J. Mater. Chem., 2004, 14, 581–584 RSC.
- N. Herron, Y. Wang and H. Eckert, J. Am. Chem. Soc., 1990, 112, 1322–1326 CrossRef.
- L. M. Liz-Marzán and I. Lado-Touriño, Langmuir, 1996, 12, 3585–3589 CrossRef CAS.
- N. Ma, J. Yang, K. M. Stewart and S. Kelley, Langmuir, 2007, 23, 12783–12787 CrossRef CAS.
Footnote |
| † Electronic supplementary information (ESI) available: Tauc plots, XRD patterns and UV–vis and PL spectra for the CdS and HgS nanoparticles. See DOI: 10.1039/b9nr00070d |
| This journal is © The Royal Society of Chemistry 2010 |